
Brocade Network Advisor SAN User Manual v12.0.0 (53-1002696-01, April 2013)

Brocade Network Advisor SAN User Manual 203
53-1002696-01
Dashboard widgets
8
Status widget
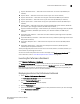
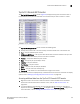
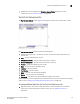
The Status widget (Figure 65) displays the number of products managed and the number of events
within the selected event time range.
FIGURE 65 Status widget
The Status widget displays the following items for each product license:
• Fibre Channel Fabrics — The number of managed fabrics.
• SAN Switches — The number of managed SAN switches.
• Hosts — The number of managed hosts.
• Events — The number of events within the last hour.
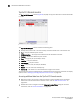
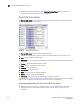
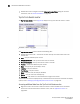
VM Alarms widget
The VM Alarms widget displays the vCenter alarms for the specified fabric and time range in a
table.
The VM Alarms widget includes the following data:
• Severity icon/widget title — The worst severity of the data shown next to the widget title.
• Show list — List of available managed fabrics with at least one product running Fabric OS 6.4 or
later.
• Range — Time range from last hour to last month.
• VM — Virtual Machine name.
• Host — Host name.
• Total — Number of alarms triggered by the following violations: VM disk aborts, VM disk resets,
VM disk usage (kbps), and VM total disk latency (ms).
• Latency — Number of latency violations.
• Usage — Number of usage violations.
• Aborts — Number of abort violations.
• Resets — Number of reset violations.