
Brocade Network Advisor SAN User Manual v12.0.0 (53-1002696-01, April 2013)

196 Brocade Network Advisor SAN User Manual
53-1002696-01
Dashboard widgets
8
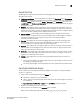
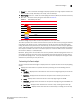
Customizing the Bottlenecked Ports widget
You can customize the widget to display data for a specific fabric and duration.
• Display data by selecting the fabric you want to monitor from the Show list.
Select All Fabrics to include all managed and monitored fabrics in your AOR. The default is All
Fabrics.
If the fabric you select is deleted from discovery, the widget refreshes and returns to the
default (All Fabrics).
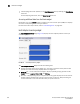
• Display data for a specific duration by selecting one of the following from the Range list:
• Hour — Displays data for the current hour beginning when you launch the dashboard.
• 12 Hours — Displays data for the previous 12 hours to when you launch the dashboard.
• Day — Displays data for the current day beginning at 12:00 AM.
• Week — Displays data for the last 7 days, including the current day.
• 1 Month — Displays data for the last 30 days, including the current day.
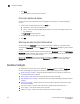
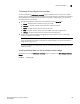
Accessing additional data from the Bottlenecked Ports widget
Right-click a row in the widget to access the shortcut menu available for the associated device. For
more information about shortcut menus, refer to “SAN shortcut menus” on page 1071.
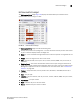
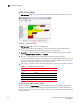
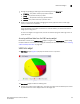
Events widget
The Events widget (Figure 60) displays the number of events by severity level for a specified time
range as a stacked bar graph.
FIGURE 60 Events widget
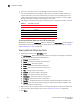
The Events widget includes the following data:
• Severity icon/widget title/event count — The color of the worst severity followed by the event
count with that severity displays before the widget title.