
Brocade Network Advisor SAN User Manual v12.0.0 (53-1002696-01, April 2013)


190 Brocade Network Advisor SAN User Manual
53-1002696-01
Dashboard overview
8
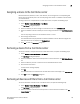
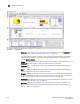
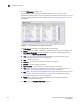
FIGURE 56 Dashboard tab
1. Menu bar — Lists commands you can perform on the dashboard. For a list of Dashboard tab
menu commands, refer to “Dashboard main menus” on page 1061.
The dashboard also provides a shortcut menu to reset the dashboard back to the defaults.
Reset the dashboard back to the default settings by right-clicking in the white space and
selected Reset to Default.
2. Toolbar — Provides buttons that enable quick access to dialog boxes and functions. For a list of
Dashboard tab toolbar options, refer to “Dashboard toolbar” on page 191.
3. Dashboard tab — Provides a high-level overview of the network managed by Management
application server.
4. SAN tab — Displays the Master Log, Minimap, Connectivity Map (topology), and Product List.
For more information, refer to the “SAN tab overview”.
5. Widgets — Displays operational status, inventory status, event summary, and overall network
or fabric status as well as performance monitors. For more information, refer to “Dashboard
widgets” on page 194 and “Performance Dashboard monitors” on page 204.
6. Master Log — Displays all events that have occurred on the Management application. For more
information, refer to “Master Log” on page 245.
7. Status bar — Displays the connection, port, product, fabric, special event, Call Home, and
backup status, as well as Server and User data. For more information about the status bar,
refer to “Status bar” on page 247.