
Brocade Network Advisor SAN User Manual v12.0.0 (53-1002696-01, April 2013)


Brocade Network Advisor SAN User Manual 189
53-1002696-01
Chapter
8
Dashboard Management
In this chapter
•Dashboard overview . . . . . . . . . . . . . . . . . . . . . . . . . . . . . . . . . . . . . . . . . . . 189
•Dashboard widgets . . . . . . . . . . . . . . . . . . . . . . . . . . . . . . . . . . . . . . . . . . . . 194
•Performance Dashboard monitors . . . . . . . . . . . . . . . . . . . . . . . . . . . . . . . . 204
•User-defined performance monitors . . . . . . . . . . . . . . . . . . . . . . . . . . . . . . 222
Dashboard overview
NOTE
Only devices in your area of responsibility (AOR) display in the dashboard.
The dashboards (Dashboard tab and the Performance Dashboard window) provide a high-level
overview of the network and the current states of managed devices. This allows you to easily check
the status of the devices on the network. The dashboards also provide several features to help you
quickly access reports, device configurations, and system logs.
The dashboards update regardless of the currently selected tab (SANor Dashboard) or the SAN
size. However, data may become momentarily out of sync between the dashboards and other areas
of the application. For example, if you remove a product from the network while another user
navigates from the dashboard to a more detailed view of the product, the product may not appear
in the detailed view.
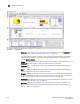
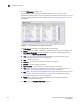
Dashboard tab overview
The Dashboard tab displays the status widgets, top N port performance monitors, and the Master
Log. You can also display additional performance monitors on the Dashboard tab (Figure 56).
You can change the default size of the status widgets and performance monitors by placing the
cursor on the divider until a double arrow displays. Click and drag the adjoining divider to resize the
window.
Reset the Dashboard back to the default size by right-clicking in the white space and selected
Reset to Default.