53-1002696-01 17 December 2012 Brocade Network Advisor SAN User Manual Supporting Network Advisor 12.0.
Copyright © 2010-2012 Brocade Communications Systems, Inc. All Rights Reserved. Brocade, Brocade Assurance, the B-wing symbol, DCX, Fabric OS, MLX, SAN Health, VCS, and VDX are registered trademarks, and AnyIO, Brocade One, CloudPlex, Effortless Networking, ICX, NET Health, OpenScript, and The Effortless Network are trademarks of Brocade Communications Systems, Inc., in the United States and/or in other countries.
Contents Contents About This Document In this chapter . . . . . . . . . . . . . . . . . . . . . . . . . . . . . . . . . . . . . . . . . . xxxv How this document is organized . . . . . . . . . . . . . . . . . . . . . . . . . . . xxxv Supported hardware and software . . . . . . . . . . . . . . . . . . . . . . . . xxxvii What’s new in this document . . . . . . . . . . . . . . . . . . . . . . . . . . . . . . . . xl Document conventions . . . . . . . . . . . . . . . . . . . . . . . . . . . . . . . . . . . .
Connecting to the database using the ODBC client (Linux systems) . . . . . . . . . . . . . . . . . . . . . . . . . . . . 21 Changing the database user password . . . . . . . . . . . . . . . . . . . 23 Supported open source software products. . . . . . . . . . . . . . . . . . . . 24 SAN feature-to-firmware requirements . . . . . . . . . . . . . . . . . . . . . . . 27 Chapter 2 Licenses Licenses overview . . . . . . . . . . . . . . . . . . . . . . . . . . . . . . . . . . . . . . . . 29 Managed count . . . .
Host discovery . . . . . . . . . . . . . . . . . . . . . . . . . . . . . . . . . . . . . . . . . . . 59 Discovering Hosts by Network address or host name . . . . . . . 59 Importing Hosts from a CSV file . . . . . . . . . . . . . . . . . . . . . . . . . 61 Importing Hosts from a Fabric . . . . . . . . . . . . . . . . . . . . . . . . . . 62 Importing Hosts from a VM manager . . . . . . . . . . . . . . . . . . . . .64 Editing Host adapter credentials . . . . . . . . . . . . . . . . . . . . . . . .
Flyover settings . . . . . . . . . . . . . . . . . . . . . . . . . . . . . . . . . . . . . . . . . . 89 Configuring flyovers . . . . . . . . . . . . . . . . . . . . . . . . . . . . . . . . . . 89 Turning flyovers on or off . . . . . . . . . . . . . . . . . . . . . . . . . . . . . . . 92 Viewing flyovers . . . . . . . . . . . . . . . . . . . . . . . . . . . . . . . . . . . . . . 92 SAN name settings . . . . . . . . . . . . . . . . . . . . . . . . . . . . . . . . . . . . . . . 92 Setting names to be unique .
Accepting changes for all fabrics . . . . . . . . . . . . . . . . . . . . . . .134 Accepting changes for a switch, access gateway, or phantom domain . . . . . . . . . . . . . . . . . . . . . . . . . . . . . . . . . . . .135 Chapter 6 User Account Management Users overview . . . . . . . . . . . . . . . . . . . . . . . . . . . . . . . . . . . . . . . . .137 Configuration requirements . . . . . . . . . . . . . . . . . . . . . . . . . . .137 Viewing configured users . . . . . . . . . . . . . . . . . . . . . .
User profiles . . . . . . . . . . . . . . . . . . . . . . . . . . . . . . . . . . . . . . . . . . .161 Viewing your user profile . . . . . . . . . . . . . . . . . . . . . . . . . . . . .161 Editing your user profile. . . . . . . . . . . . . . . . . . . . . . . . . . . . . . .162 Changing your password . . . . . . . . . . . . . . . . . . . . . . . . . . . . . .163 Viewing your password policy . . . . . . . . . . . . . . . . . . . . . . . . . .163 Resetting optional messages . . . . . . . . . . . . . . . . .
Chapter 8 Dashboard Management Dashboard overview . . . . . . . . . . . . . . . . . . . . . . . . . . . . . . . . . . . . .189 Dashboard tab overview . . . . . . . . . . . . . . . . . . . . . . . . . . . . . .189 Dashboard toolbar . . . . . . . . . . . . . . . . . . . . . . . . . . . . . . . . . . .191 Customizing the dashboard displays . . . . . . . . . . . . . . . . . . . .191 General functions. . . . . . . . . . . . . . . . . . . . . . . . . . . . . . . . . . . .193 Exporting the dashboard display . . .
Chapter 9 View Management In this chapter . . . . . . . . . . . . . . . . . . . . . . . . . . . . . . . . . . . . . . . . . .237 SAN tab overview . . . . . . . . . . . . . . . . . . . . . . . . . . . . . . . . . . . . . . .237 SAN main toolbar . . . . . . . . . . . . . . . . . . . . . . . . . . . . . . . . . . . .239 View All list . . . . . . . . . . . . . . . . . . . . . . . . . . . . . . . . . . . . . . . . .240 Port Display buttons. . . . . . . . . . . . . . . . . . . . . . . . . . . . . . . . . .
Grouping on the topology . . . . . . . . . . . . . . . . . . . . . . . . . . . . . . . . .270 Collapsing groups . . . . . . . . . . . . . . . . . . . . . . . . . . . . . . . . . . .270 Expanding groups . . . . . . . . . . . . . . . . . . . . . . . . . . . . . . . . . . .270 Viewing connections . . . . . . . . . . . . . . . . . . . . . . . . . . . . . . . . .270 Configuring custom connections . . . . . . . . . . . . . . . . . . . . . . . 271 Deleting a custom connection configuration . . . . . . . . . . . .
Restarting all services . . . . . . . . . . . . . . . . . . . . . . . . . . . . . . . .292 Changing the database password . . . . . . . . . . . . . . . . . . . . . .292 Ports tab . . . . . . . . . . . . . . . . . . . . . . . . . . . . . . . . . . . . . . . . . . . . . .293 Viewing server port numbers . . . . . . . . . . . . . . . . . . . . . . . . . .293 AAA Settings tab . . . . . . . . . . . . . . . . . . . . . . . . . . . . . . . . . . . . . . . .294 Configuring Radius server authentication . . . . . . .
Firmware management. . . . . . . . . . . . . . . . . . . . . . . . . . . . . . . . . . .344 Downloading firmware . . . . . . . . . . . . . . . . . . . . . . . . . . . . . . .344 Displaying the firmware repository . . . . . . . . . . . . . . . . . . . . . .347 Importing a firmware file . . . . . . . . . . . . . . . . . . . . . . . . . . . . . .348 Deleting a firmware file . . . . . . . . . . . . . . . . . . . . . . . . . . . . . . .349 Frame viewer . . . . . . . . . . . . . . . . . . . . . . . . . . . . . .
Enabling port auto disable on all ports on a device . . . . . . . .383 Disabling port auto disable on individual ports . . . . . . . . . . . .384 Disabling port auto disable on all ports on a device . . . . . . . .385 Unblocking ports . . . . . . . . . . . . . . . . . . . . . . . . . . . . . . . . . . . .385 Chapter 13 Host Port Mapping In this chapter . . . . . . . . . . . . . . . . . . . . . . . . . . . . . . . . . . . . . . . . . .387 Host port mapping overview. . . . . . . . . . . . . . . . . . . . .
Host adapter discovery . . . . . . . . . . . . . . . . . . . . . . . . . . . . . . . . . . .408 VM Manager . . . . . . . . . . . . . . . . . . . . . . . . . . . . . . . . . . . . . . . . . . .408 Adding a VM Manager . . . . . . . . . . . . . . . . . . . . . . . . . . . . . . . .408 Editing a VM Manager . . . . . . . . . . . . . . . . . . . . . . . . . . . . . . . .409 Deleting a VM Manager . . . . . . . . . . . . . . . . . . . . . . . . . . . . . . .
FCoE protocols supported . . . . . . . . . . . . . . . . . . . . . . . . . . . . . . . .437 Ethernet link layer protocols supported . . . . . . . . . . . . . . . . . .437 FCoE protocols . . . . . . . . . . . . . . . . . . . . . . . . . . . . . . . . . . . . . .437 FCoE licensing . . . . . . . . . . . . . . . . . . . . . . . . . . . . . . . . . . . . . . . . . .438 Save running configurations. . . . . . . . . . . . . . . . . . . . . . . . . . . . . . .438 Copying switch configurations to selected switches .
802.1x authentication . . . . . . . . . . . . . . . . . . . . . . . . . . . . . . . . . . .470 Enabling 802.1x authentication . . . . . . . . . . . . . . . . . . . . . . . . 471 Disabling 802.1x authentication . . . . . . . . . . . . . . . . . . . . . . . 471 Setting 802.1x parameters for a port. . . . . . . . . . . . . . . . . . . . 471 Switch, port, and LAG deployment . . . . . . . . . . . . . . . . . . . . . . . . . .473 Deploying DCB product, port, and LAG configurations . . . . . .
Chapter 19 Virtual Fabrics Virtual Fabrics overview . . . . . . . . . . . . . . . . . . . . . . . . . . . . . . . . . .511 Terminology for Virtual Fabrics . . . . . . . . . . . . . . . . . . . . . . . .512 Virtual Fabrics requirements . . . . . . . . . . . . . . . . . . . . . . . . . . . . . .512 Configuring Virtual Fabrics . . . . . . . . . . . . . . . . . . . . . . . . . . . . . . . . 514 Enabling Virtual Fabrics. . . . . . . . . . . . . . . . . . . . . . . . . . . . . . .515 Disabling Virtual Fabrics .
Importing the signed KAC certificate . . . . . . . . . . . . . . . . . . . .546 Uploading the CA certificate onto the DPM appliance (and first-time configurations) . . . . . . . . . . . . . . . . .546 Uploading the KAC certificate onto the DPM appliance (manual identity enrollment) . . . . . . . . . . . . . . . . . .548 DPM key vault high availability deployment . . . . . . . . . . . . . . .548 Loading the CA certificate onto the encryption group leader . . . . . . . . . . . . . . . . . . . . . . . . . . .
Steps for connecting to a KMIP appliance (SafeNet KeySecure). . 574 Setting FIPS compliance . . . . . . . . . . . . . . . . . . . . . . . . . . . . . .575 Creating a local CA. . . . . . . . . . . . . . . . . . . . . . . . . . . . . . . . . . . 576 Creating a server certificate . . . . . . . . . . . . . . . . . . . . . . . . . . .577 Creating a cluster. . . . . . . . . . . . . . . . . . . . . . . . . . . . . . . . . . . .582 Signing the encryption node KAC CSR on KMIP . . . . . . . . . . .
Enabling and disabling tape LUN write early and read ahead . . . . . . . . . . . . . . . . . . . . . . . . . . . . . . . . . . . . . . . . .662 Tape LUN statistics . . . . . . . . . . . . . . . . . . . . . . . . . . . . . . . . . . . . . .664 Viewing and clearing tape container statistics . . . . . . . . . . . .664 Viewing and clearing tape LUN statistics for specific tape LUNs . . . . . . . . . . . . . . . . . . . . . . . . . . . . . . . . . . .
HA Clusters tab. . . . . . . . . . . . . . . . . . . . . . . . . . . . . . . . . . . . . .705 Link Keys tab . . . . . . . . . . . . . . . . . . . . . . . . . . . . . . . . . . . . . . .707 Tape Pools tab . . . . . . . . . . . . . . . . . . . . . . . . . . . . . . . . . . . . . .708 Engine Operations tab . . . . . . . . . . . . . . . . . . . . . . . . . . . . . . . . 711 Encryption-related acronyms in log messages . . . . . . . . . . . . . . . . 712 Chapter 21 Zoning Zoning overview. . . . . . . . . . . .
Exporting an offline zone database . . . . . . . . . . . . . . . . . . . . .737 Importing an offline zone database . . . . . . . . . . . . . . . . . . . . .738 Rolling back changes to the offline zone database . . . . . . . .738 LSAN zones . . . . . . . . . . . . . . . . . . . . . . . . . . . . . . . . . . . . . . . . . . . .738 Supported configurations for LSAN zoning . . . . . . . . . . . . . . .738 Configuring LSAN zoning . . . . . . . . . . . . . . . . . . . . . . . . . . . . .
FCIP trunking . . . . . . . . . . . . . . . . . . . . . . . . . . . . . . . . . . . . . . . . . . .762 Design for redundancy and fault tolerance . . . . . . . . . . . . . . .763 FCIP tunnel restrictions for FCP and FICON emulation features. . . . . . . . . . . . . . . . . . . . . . . . . . . . . . . . . . .763 FCIP Trunk configuration considerations . . . . . . . . . . . . . . . . .763 FCIP circuit failover capabilities . . . . . . . . . . . . . . . . . . . . . . . .
Disabling FCIP circuits . . . . . . . . . . . . . . . . . . . . . . . . . . . . . . . . . . .793 Enabling FCIP circuits . . . . . . . . . . . . . . . . . . . . . . . . . . . . . . . . . . . .793 Deleting FCIP Circuits . . . . . . . . . . . . . . . . . . . . . . . . . . . . . . . . . . . .794 Displaying FCIP performance graphs. . . . . . . . . . . . . . . . . . . . . . . .794 Displaying performance graphs for FC ports . . . . . . . . . . . . . .794 Displaying FCIP performance graphs for Ethernet ports. . . .
Unblocking a port. . . . . . . . . . . . . . . . . . . . . . . . . . . . . . . . . . . .822 Avoiding port fencing inheritance . . . . . . . . . . . . . . . . . . . . . . .822 Editing thresholds . . . . . . . . . . . . . . . . . . . . . . . . . . . . . . . . . . . . . . .823 Editing a C3 Discard Frames threshold . . . . . . . . . . . . . . . . . .823 Editing an Invalid CRCs threshold. . . . . . . . . . . . . . . . . . . . . . .823 Editing an Invalid Words threshold . . . . . . . . . . . . . . . . . . . . . .
Chapter 26 VLAN Management VLAN Manager. . . . . . . . . . . . . . . . . . . . . . . . . . . . . . . . . . . . . . . . . .853 Default VLAN . . . . . . . . . . . . . . . . . . . . . . . . . . . . . . . . . . . . . . .853 Super-aggregated VLAN . . . . . . . . . . . . . . . . . . . . . . . . . . . . . .853 Configuration requirements for VLAN Manager . . . . . . . . . . .854 Displaying a list of VLANs . . . . . . . . . . . . . . . . . . . . . . . . . . . . .854 VLAN management in a VCS environment . . . . . .
Chapter 28 Fibre Channel Troubleshooting In this chapter . . . . . . . . . . . . . . . . . . . . . . . . . . . . . . . . . . . . . . . . . .881 FC troubleshooting . . . . . . . . . . . . . . . . . . . . . . . . . . . . . . . . . . . . . .881 Tracing FC routes . . . . . . . . . . . . . . . . . . . . . . . . . . . . . . . . . . .882 Troubleshooting device connectivity. . . . . . . . . . . . . . . . . . . . .883 Confirming Fabric Device Sharing. . . . . . . . . . . . . . . . . . . . . . .
Inheriting alert parameters from a switch . . . . . . . . . . . . . . . .926 Copying alert parameters from one switch or port to another . . . . . . . . . . . . . . . . . . . . . . . . . . . . . . . . . . . . . . . . . . . .926 Displaying bottleneck statistics . . . . . . . . . . . . . . . . . . . . . . . .927 Displaying devices that could be affected by an F_ or FL_Port bottleneck . . . . . . . . . . . . . . . . . . . . . . . . . . .928 Disabling bottleneck detection . . . . . . . . . . . . . . . . . . . .
Viewing a policy monitor report . . . . . . . . . . . . . . . . . . . . . . . . . . . .969 Exporting a policy monitor report . . . . . . . . . . . . . . . . . . . . . . . 971 Viewing historical reports for all policy monitors . . . . . . . . . . . . . .972 Viewing historical reports for a policy monitor . . . . . . . . . . . . . . . .972 Chapter 32 Fault Management Fault management overview . . . . . . . . . . . . . . . . . . . . . . . . . . . . . .973 Event notification . . . . . . . . . . . . . . . . .
Setting pseudo event policies . . . . . . . . . . . . . . . . . . . . . . . . .1011 Filtering pseudo event traps . . . . . . . . . . . . . . . . . . . . . . . . . .1012 Creating a pseudo event definition by copying an existing definition . . . . . . . . . . . . . . . . . . . . . . . . . . . . . . . .1014 Editing a pseudo event definition . . . . . . . . . . . . . . . . . . . . . .1014 Deleting a pseudo event . . . . . . . . . . . . . . . . . . . . . . . . . . . . .
Viewing the technical support repository . . . . . . . . . . . . . . . 1046 Saving technical support information to another location . .1047 E-mailing technical support information . . . . . . . . . . . . . . . 1048 Copying technical support information to an external FTP server . . . . . . . . . . . . . . . . . . . . . . . . . . . . . . 1048 Deleting technical support files from the repository . . . . . . 1049 Upload failure data capture . . . . . . . . . . . . . . . . . . . . . . . . . . . . .
Product events. . . . . . . . . . . . . . . . . . . . . . . . . . . . . . . . . . . . . . . . 1095 IP Performance monitoring events. . . . . . . . . . . . . . . . . . . . . . . . 1095 Appendix D User Privileges About user privileges . . . . . . . . . . . . . . . . . . . . . . . . . . . . . . . . . . .1097 About Roles and Access Levels . . . . . . . . . . . . . . . . . . . . . . . . . . .1114 Appendix E Device Properties SAN device properties. . . . . . . . . . . . . . . . . . . . . . . . . . . . . . . .
Appendix H Database Fields Database tables and fields . . . . . . . . . . . . . . . . . . . . . . . . . . . . . .1157 Views . . . . . . . . . . . . . . . . . . . . . . . . . . . . . . . . . . . . . . . . . . . . . . . 1360 ADAPTER_PORT_CONFIG_INFO . . . . . . . . . . . . . . . . . . . . . . 1360 AG_CONNECTION_INFO . . . . . . . . . . . . . . . . . . . . . . . . . . . . . 1360 BOOT_IMAGE_FILE_DETAILS_INFO . . . . . . . . . . . . . . . . . . . . 1361 CNA_ETH_PORT_CONFIG_INFO . . . . . . . . . . . . . . . . .
PORT_PROFILE_MAC_INFO . . . . . . . . . . . . . . . . . . . . . . . . . . 1394 SFLOW. . . . . . . . . . . . . . . . . . . . . . . . . . . . . . . . . . . . . . . . . . . 1395 SFLOW_MINUTE_L3_VIEW . . . . . . . . . . . . . . . . . . . . . . . . . . 1396 SFLOW_MINUTE_MAC_VIEW . . . . . . . . . . . . . . . . . . . . . . . . . .1397 SCOM_EE_MONITOR_INFO . . . . . . . . . . . . . . . . . . . . . . . . . . 1398 SENSOR_INFO . . . . . . . . . . . . . . . . . . . . . . . . . . . . . . . . . . . .
xxxvi Brocade Network Advisor SAN User Manual 53-1002696-01
About This Document In this chapter • How this document is organized . . . . . . . . . . . . . . . . . . . . . . . . . . . . . . . . . xxxv • Supported hardware and software. . . . . . . . . . . . . . . . . . . . . . . . . . . . . . . xxxvii • What’s new in this document . . . . . . . . . . . . . . . . . . . . . . . . . . . . . . . . . . . . . . xl • Document conventions . . . . . . . . . . . . . . . . . . . . . . . . . . . . . . . . . . . . . . . . . xliii • Additional information . . . . . . . . . . . .
• Chapter 14, “Storage Port Mapping,” provides instructions about how to create and assign properties to a storage device. • • • • Chapter 15, “Host Management,” provides information on how to configure an HBA. Chapter 16, “Fibre Channel over Ethernet,” provides information on how to configure FCoE. Chapter 17, “Security Management,” provides security configuration instructions. Chapter 18, “FC-FC Routing Service Management,” provides information on how to manage Fibre Channel Routing.
Supported hardware and software In those instances in which procedures or parts of procedures documented here apply to some devices but not to others, this guide identifies exactly which devices are supported and which are not. Although many different software and hardware configurations are tested and supported by Brocade Communications Systems, Inc. for Network Advisor 12.0.X, documenting all possible configurations and scenarios is beyond the scope of this document.
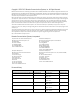
TABLE 1 Fabric OS-supported hardware Device name Terminology used in documentation Brocade 200E switch 16-port, 4 Gbps FC Switch Brocade 300 switch 24-port, 8 Gbps FC Switch Brocade 4012 switch Embedded 12-port, 4 Gbps FC Switch Brocade 4016 switch Embedded 16-port, 4 Gbps FC Switch Brocade 4018 switch Embedded 18-port, 4 Gbps FC Switch Brocade 4020 switch Embedded 20-port, 4 Gbps FC Switch Brocade 4024 switch Embedded 24-port, 4 Gbps FC Switch Brocade 4100 switch 32-port, 4 Gbps FC Switc
TABLE 1 Fabric OS-supported hardware (Continued) Device name Terminology used in documentation Firmware level required Brocade 1860 Fabric Adapter 16 Gbps FC HBA mode 10 Gbps CNA mode 10 Gbps NIC mode Adapter Software 3.0.0.0 or later Brocade 1867 HBA 16 Gbps Mezzanine HBA Adapter Software 3.0.3.
TABLE 1 Fabric OS-supported hardware (Continued) Device name Terminology used in documentation Firmware level required Brocade DCX 8510-81, 2 16 Gbps 8-slot Backbone Chassis Fabric OS v7.0.0 or later Brocade Encryption Switch 8 Gbps Encryption Switch Fabric OS v6.1.
- Port Group Support (VLAN Management) Database tables MEASURE PM_COLLECTOR_MEASURE_SETTING PM_COLLECTOR_TARGET_SETTING PM_DASHBOARD_WIDGET PM_DATA_COLLECTOR PM_WIDGET_MEASURE_TYPE PM_WIDGET_MONITOR_TYPE PM_WIDGET_TARGET_ENTRY PM_WIDGET_TIME_SERIES_ENTRY PM_WIDGET_TOP_N_COLLECTOR_ENTRY PM_WIDGET_USER_ENTRY GRE_TUNNEL_INTERFACE TIME_SERIES_DATA TIME_SERIES_DATA_1DAY TIME_SERIES_DATA_2HOUR TIME_SERIES_DATA_30MIN POLICY_RUL
VM_DATASTORE_DETAILS VM_VIRTUAL_MACHINE_DATASTORE_MAP PM_COLLECTOR_TIME_SERIES_MAPPING DEVICE_CONNECTION WIRELESS_PRODUCT_DETAILS WIRELESS_PRODUCT_RELATION MAPS_EVENT MAPS_EVENT_DETAILS PM_STATS_AGING_POLICY ENCRYPTION_KMIP_PARAMETERS PORT_COMMISSION_CIMOM_SERVER DISK_USAGE HYPER_V_VIRTUAL_MACHINE HYPER_V_VM_HBA_PORT_MAP CNA_ETH_PORT_CONFIG MAPS_EVENT_CAUSE_ACTION DEPLOYMENT_REPORT_TEMPLATE Information that was changed: • - Dashboard Firmware Management Client and server
Document conventions This section describes text formatting conventions and important notice formats used in this document.
Notice to the reader This document may contain references to the trademarks of the following corporations. These trademarks are the properties of their respective companies and corporations. These references are made for informational purposes only. Corporation Referenced trademarks and products Linus Torvalds Linux Microsoft Corporation Windows, Windows NT, Internet Explorer Netscape Communications Corporation Netscape Red Hat, Inc.
Other industry resources For additional resource information, visit the Technical Committee T11 website. This website provides interface standards for high-performance and mass storage applications for Fibre Channel, storage management, and other applications: http://www.t11.org For information about the Fibre Channel industry, visit the Fibre Channel Industry Association website: http://www.fibrechannel.
• Brocade 5000—On the switch ID pull-out tab located on the bottom of the port side of the switch • Brocade 7600—On the bottom of the chassis • Brocade 48000—Inside the chassis next to the power supply bays • Brocade DCX and DCX-4S—On the bottom right on the port side of the chassis 4. World Wide Name (WWN) Use the licenseIdShow command to display the WWN of the chassis.
Chapter Getting Started 1 In this chapter • User interface components . . . . . . . . . . . . . . . . . . . . . . . . . . . . . . . . . . . . . . . 1 • Management server and client. . . . . . . . . . . . . . . . . . . . . . . . . . . . . . . . . . . . . 3 • Accessibility features for the Management application . . . . . . . . . . . . . . . . 16 • PostgreSQL database . . . . . . . . . . . . . . . . . . . . . . . . . . . . . . . . . . . . . . . . . . . 19 • Supported open source software products . . . . .
1 User interface components 1 2 3 4 FIGURE 1 Main window 1. Menu bar. Lists commands you can perform on the Management application. The available commands vary depending on which tab (SAN or Dashboard) you select. For a list of available commands, refer to Appendix A, “Application menus”. 2. Toolbar. Provides buttons that enable quick access to dialog boxes and functions. The available buttons vary depending on which tab (SAN or Dashboard) you select.
Management server and client 1 Management server and client The Management application has two parts: the Server and the Client. The Server is installed on one machine and stores device-related information; it does not have a user interface. To view information through a user interface, you must log in to the Server through a Client. The Server and Clients may reside on the same machine, or on separate machines. If you are running Professional, the server and the client must be on the same machine.
1 Management server and client 7. Click OK on the Login Banner dialog box. The Management application displays. NOTE When you launch the Management application or navigate to a new view, the SAN tab displays with a gray screen over the Product List and Topology Map while data is loading. Launching a remote client To launch a remote client, complete the following steps. 1. Open a web browser and enter the IP address of the Management application server in the Address bar.
Management server and client 1 Clearing previous versions of the remote client The remote client link in the Start menu does not automatically upgrade when you upgrade the Management application. You must clear the previous version from the Java cache. To clear the Java cache, complete the following steps. 1. Select Start > Settings > Control Panel > Java. The Java Control Panel dialog box displays. 2. Click View on the General tab. The Java Cache Viewer dialog box displays. 3.
1 Management server and client 4. Complete the following steps on the FTP/SCP/SFTP Server screen. a. Choose one of the following options: • Select Built-in FTP/SCP/SFTP Server to configure an internal FTP/SCP/SFTP server and select one of the following options: - Select Built-in FTP Server to configure an internal FTP server The internal FTP server uses a default account and port 21. You can configure your own account from the Options dialog box.
Management server and client a. Select an address from the Server IP Configuration list. b. Select an address from the Switch - Server IP Configuration Preferred Address list. 1 NOTE If the “hostname” contains invalid characters, the host name does not display in the list. Valid characters include alphanumeric and dash (-) characters. The IP address is selected by default. If the an IPv6 address is selected, server start up will fail.
1 Management server and client d. Enter a port number in the Starting Port Number field (default is 24600). NOTE For Professional software, the server requires 15 consecutive free ports beginning with the starting port number. NOTE For Trial and Licensed software, the server requires 18 consecutive free ports beginning with the starting port number. e. Enter a port number in the Syslog Port Number field (default is 514).
Management server and client 1 11. Enter your user name and password. The defaults are Administrator and password, respectively. NOTE Do not enter Domain\User_Name in the User ID field for LDAP server authentication. 12. Click Login. 13. Click OK on the Login Banner. NOTE When you launch the Management application or navigate to a new view, the SAN tab displays with a gray screen over the Product List and Topology Map while data is loading.
1 Management server and client Disconnecting users To disconnect a user, complete the following steps. 1. Select Server > Active Sessions. The Active Sessions dialog box displays. 2. Select the user you want to disconnect and click Disconnect. 3. Click Yes on the confirmation message. 4. The user you disconnected receives the following message: The Client has been disconnected by User_Name from IP_Address at Disconnected_Date_and_Time. 5. Click Close.
Management server and client TABLE 2 1 Server Properties Field/Component Description Java VM Vendor The Java Virtual Machine vendor. Java VM Version The Java Virtual Machine version running on the server. Server Name The server’s name. OS Architecture The operating system architecture on the server. OS Name The name of the operating system running on the server. OS Version The operating system version running on the server. Region The server’s geographical region.
1 Management server and client FIGURE 6 Port Status dialog box 2. Review the port status details: • Name — The Port name. Options include CIM Indication for Event Handling, CIM Indication for HCM Proxy, FTP, SCP/SFTP, SNMP Trap, Syslog, Web Server (HTTP), and Web Server (HTTPS). • Port # — The required port number. • Status — The status of the port. The status options are as follows: Success — The port is listening or bound to the server. Failed — The port fails to listen or bind to the server.
Management server and client 1 • Communication Path — The “source” to “destination” vaules. Client and Server refer to the Management application client and server unless stated otherwise. Product refers to the Fabric OS, Network OS, or IronWare devices. • Open in Firewall — Whether the port needs to be open in the firewall.
1 Management server and client TABLE 3 Port usage and firewall requirements (Continued) Port Number Ports Transport Description Communication Path Open in Firewall 3892 LDAP Authentication Server Port UDP TCP LDAP server port for authentication if you use LDAP as an external authentication Server–LDAP Server Yes 4431,2 HTTPS server TCP HTTPS (HTTP over SSL) server port if you use secure client server communication Client-Server Yes 4432 HTTPS (HTTP over SSL) server port if you use secu
Management server and client TABLE 3 Port Number Port usage and firewall requirements (Continued) Ports Transport Description Communication Path Open in Firewall Server-Managed Host Yes 63432 sFlow UDP Receives sFlow data from products if you are monitoring with sFlow Product-Server Yes 246001,2 JNP (Java Naming Protocol) port TCP Use for service location. Uses SSL for privacy. Client–Server Yes 246011,2 EJB (Enterprise Java Bean) connection port TCP Client requests to server.
1 Accessibility features for the Management application TABLE 3 Port usage and firewall requirements (Continued) Port Number Ports Transport Description Communication Path Open in Firewall 34568 HCM Agent discovery port TCP Used for HBA management via JSON Server - Managed Host Yes 555561 Launch in Context (LIC) client hand shaking port TCP Client port used to check if a Management application client opened using LIC is running on the same host Client No NOTE: If this port is in use, th
Accessibility features for the Management application TABLE 4 1 Keyboard shortcuts Menu Item or Function Keyboard Shortcut Internet Explorer SHIFT + F2 Master Log F5 FireFox SHIFT + F1 Paste CTRL + V Product List F9 Properties Alt-Enter Select All CTRL + A Show Ports F4 SSH Shift-F5 View Utilization CTRL + U Zoom In CTRL + NumPad+ Zoom Out CTRL + NumPad- Look and feel customization You can configure the Management application to mimic your system settings as well as define the
1 Accessibility features for the Management application 2. Select Look and Feel in the Category list. 3. Choose from one of the following options: • Select Default to configure the look and feel back to the Management application defaults. • Select System to configure the Management application to have the look and feel of your system. This changes the look and feel for the components that use ‘Java Metal Look and Feel’.
PostgreSQL database 1 PostgreSQL database You can connect to the database using one of the following options: • pgAdmin III • ODBC client • Command line interface Connecting to the database using pgAdmin III To access the PostgreSQL database, complete the following steps. 1. Choose one of the following options: • On Windows systems, launch the dbadmin.bat script in the Install_Home\bin\ directory. • On UNIX systems, launch the dbadmin script in the Install_Home\bin\ directory. 2.
1 PostgreSQL database Connecting to the database using the ODBC client (Windows systems) The Open Database Connectivity (ODBC) driver enables you to configure the data source name (DSN) for the database. To install the ODBC driver and create a new data source, complete the following steps. 1. Double-click edb_psqlodbc.exe located on the DVD (DVD_Drive/Management_Application/odbc/Windows). 2.
PostgreSQL database 1 20. Click Save. 21. Click OK on the ODBC Data Source Administrator dialog box. 22. To export data, select Data > Import External Data > New Database Query and complete the steps in the Data Connection Wizard. Connecting to the database using the ODBC client (Linux systems) NOTE The ODBC driver is not supported on 64-bit Linux systems. You must have the Open Database Connectivity (ODBC) driver to allow remote clients to export data and generate reports.
1 PostgreSQL database Adding the Datasourse on Linux systems Before you edit the INI files, make sure the PostgreSQL database is up and running. NOTE For RedHat and Oracle Enterprise systems, the odbc.ini and odbcinst.ini files are located in /etc. For SUSE systems, the odbc.ini and odbcinst.ini files are located in /etc/unixODBC. 1. Open the odbc.ini file in an editor and enter the datasource information as follows: [TestDB] Description = PostgreSQL 8.4 Driver = /opt/PostgreSQL/psqlODBC/lib/psqlodbcw.
PostgreSQL database 1 5. On the Set up user authentication screen, complete the following steps. a. Enter the database user name in the User name field. b. Select the Password required check box. c. Click Test Connection to test the connection. The Authentication Password dialog box displays. d. Enter the database password in the Password field and click OK. e. Click OK on the Connection Test dialog box.
1 Supported open source software products If the new password and confirm password do not match, the following message displays: New password and confirm password do not match. Please try again. Press any key to continue. 3. Launch the Server Management Console. 4. Click the Services tab. 5. Click Stop to stop all services. 6. Click Close to close the Server Management Console. 7. Launch the Server Management Console. 8. Click Start to start all services.
Supported open source software products TABLE 7 1 Open source software third-party software products Open Source Software License Type ApacheCommonsNet 2.0 Apache License v2.0 ApacheCommonsPool 1.5.4 Apache License v2.0 ApacheCommonsValidator 1.3.1 Apache License v2.0 Apache Extras Companion for Apache log4j 1.1 Apache License v2.0 ApacheFTPServer 1.0.3 Apache License v2.0 Apache Log4j 1.2.16 Apache License v2.0 ASM 3.2 Custom License Axis 1.4 Apache License v2.
1 Supported open source software products TABLE 7 26 Open source software third-party software products Open Source Software License Type JCalendar 1.3.3 LGPL v2.1 JCommon 1.0.16 LGPL v2.1 JDOM 1.1.1 Apache Style JFreeChart 1.0.13 LGPL v2.1 JGoodiesForms 1.2.1 BSD JGoodiesLooks 2.2.2 BSD JGraph 5.13.0.1 BSD Style JIDE 2.10.1 JIDE Software License Jmesa 2.4.5 Apache JSON-RPCJava 1.0.1 Apache License v2.0 KajabityTools 0.1 Apache License v2.0 L2Fprod.comCommonComponents 7.
SAN feature-to-firmware requirements 1 SAN feature-to-firmware requirements Use the following table to determine whether the Management application SAN features are only available with a specific version of the Fabric OS firmware as well as if there are specific licensing requirements. TABLE 8 SAN feature to firmware requirements Feature Fabric OS Access Gateway (AG) AG connected to Fabric OS devices requires firmware 5.2 or later. Call Home (Trial and Licensed version Only) Requires Fabric OS 5.
1 TABLE 8 SAN feature-to-firmware requirements SAN feature to firmware requirements Feature Fabric OS Port Fencing (Trial and Licensed version Only) Requires Fabric OS 6.2 or later. Requires Fabric OS 6.3 or later for State Change and C3 Discard Frames violation types. Security Management Requires Fabric OS 5.2 and later for SCC Policy. Requires Fabric OS 5.2 and later for DCC Policy. Requires Fabric OS 5.3 and later for IP Filter Policy. Requires Fabric OS 6.
Chapter 2 Licenses In this chapter • Licenses overview . . . . . . . . . . . . . . . . . . . . . . . . . . . . . . . . . . . . . . . . . . . . . . • Managed count . . . . . . . . . . . . . . . . . . . . . . . . . . . . . . . . . . . . . . . . . . . . . . . . • Entering the license key . . . . . . . . . . . . . . . . . . . . . . . . . . . . . . . . . . . . . . . . . • Upgrading the Management application . . . . . . . . . . . . . . . . . . . . . . . . . . . . • License downgrade . . . . . . . . . . . . .
2 Entering the license key Managed SAN port count calculation NOTE If you exceed the maximum port count for your version, software functionality is impacted and you must reduce the port count using the Discover Fabrics dialog box or contact your vendor to purchase an additional license for your version. The managed SAN port count is calculated using the following rules: • • • • • Only switches discovered from the SAN tab are counted. • • • • Access Gateway ports are counted.
Upgrading the Management application 2 • License Key — License keys consist of an asterisk (*) followed by unique string of alphanumeric characters. License keys verify ownership of the Management application software as well as determine the maximum port count allowed or any additional features that you receive as part of the license. • Serial # — The serial number of the server associated with the license key. This field is not editable; it is populated after you set the license key on the server.
2 Upgrading the Management application TABLE 10 IP upgrade paths Current software release To software release IP Professional IP Base Trial or Licensed version IP Base Trial IP Base Licensed version SAN + IP Enterprise Licensed version IP Base Licensed version (lower count) IP Base Licensed version (higher count) SAN + IP Enterprise Licensed version TABLE 11 SAN + IP upgrade paths Current software release To software release SAN + IP Professional SAN Professional Plus + IP Trial or Enterpri
License downgrade 2 License downgrade You can downgrade from a higher Trial configuration to a licensed version with a lower configuration. NOTE You cannot downgrade to Professional Edition. NOTE Downgrading to a Trial version is not supported. NOTE You cannot downgrade during migration (Configuration Wizard). Downgrading the edition The following table list the available downgrade paths.
2 34 License downgrade Brocade Network Advisor SAN User Manual 53-1002696-01
Chapter 3 Patches In this chapter • Installing a patch . . . . . . . . . . . . . . . . . . . . . . . . . . . . . . . . . . . . . . . . . . . . . . . 35 • Uninstalling a patch. . . . . . . . . . . . . . . . . . . . . . . . . . . . . . . . . . . . . . . . . . . . . 36 Installing a patch The patch installer enables you to update the Management application between releases. Each patch installer includes the previous patches within a specific release. For example, patch F (11.X.
3 Uninstalling a patch • Extracts patch files to the Install_Home folder. • Creates a back up (zip) of the original files to be updated and copies the zip file to the Install_Home\patch-backup directory (for example, Install_Home\patch-backup\na_11-3-0a.zip). The first time you apply a patch, the back up patch zip file uses the following naming convention: _-- .zip (for example, Install_Home\patch-backup\na_11-3-0a.zip).
Uninstalling a patch 3 6. Copy the artifact from the extracted folder to the source folder in the Install_Home/patch-backup directory. 7. Repeat step 5 and 6 for all artifacts listed in the restore.xml folder. 8. Go to the Install_Home/conf directory. 9. Open the version.properties file in a text editor. 10. Change the patch version (patch.version) value to the reverted patch (for example, if you are reverting from patch F to patch C then patch.version = c).
3 38 Uninstalling a patch Brocade Network Advisor SAN User Manual 53-1002696-01
Chapter 4 Discovery In this chapter • SAN discovery overview. . . . . . . . . . . . . . . . . . . . . . . . . . . . . . . . . . . . . . . . . . • Viewing the fabric discovery state . . . . . . . . . . . . . . . . . . . . . . . . . . . . . . . . . • Troubleshooting fabric discovery . . . . . . . . . . . . . . . . . . . . . . . . . . . . . . . . . . • SAN Fabric monitoring. . . . . . . . . . . . . . . . . . . . . . . . . . . . . . . . . . . . . . . . . . . • SAN Seed switch . . . . . . . . . . . . . . . .
4 SAN discovery overview NOTE Professional Plus edition can discover up to 2,560 ports. NOTE Professional Plus edition can discover, but not manage the Backbone chassis.Use the device’s Element Manager, which can be launched from the Connectivity Map, to manage the device. This device cannot be used as a Seed switch. FCS policy and seed switches The Management application requires that the seed switch is the primary Fabric Configuration Server (FCS) switch at the time of discovery.
SAN discovery overview TABLE 13 4 Backbone Chassis discovery Device Professional Professional Plus Enterprise 16 Gbps 8-slot Backbone Chassis as member switch Yes for discovery; however, it cannot be managed. Yes for discovery; however, it cannot be managed. Yes 16 Gbps 4-slot Backbone Chassis as seed switch Yes Yes Yes 16 Gbps 4-slot Backbone Chassis as member switch Yes Yes Yes Discovering fabrics NOTE Fabric OS devices must be running Fabric OS 5.0 or later.
4 SAN discovery overview FIGURE 8 Add Fabric Discovery dialog box (IP Address tab) 3. Enter a name for the fabric in the Fabric Name field. 4. Enter an IP address (IPv4 or IPv6) for a device in the IP Address field. To configure the preferred IP format for the Management application server to connect with Fabric OS devices, refer to “Configuring the preferred IP format” on page 123. If the product has both an IPv4 and IPv6 address, the Management server uses the preferred address.
SAN discovery overview 4 For Admin Domain (AD) discovery, Fabric OS switch must have Physical AD visibility. For Virtual Fabric discovery device requirements, refer to “Virtual Fabrics requirements” on page 512. To discover a Virtual Fabric device, you must have the following permissions: • Switch user account with Chassis Admin role permission on the physical chassis. • Switch and SNMPv3 user account with access rights to all logical switches (all Fabric IDs (1 - 128).
4 SAN discovery overview c. Enter the number of times to retry the process in the Retries field. d. Select the SNMP version from the SNMP Version list. • If you selected v1, continue with step e. • If you select v3, the SNMP tab displays the v3 required parameters. Go to step i. To discover a Fabric OS device (not virtual fabric-capable), you must provide the existing SNMPv3 username present in the switch.
SAN discovery overview 4 Editing the password for multiple devices You can only edit password for Fabric OS devices in the same fabric. To edit the password for multiple devices within the same fabric, complete the following steps. 1. Select Discover > Fabrics. The Discover Fabrics dialog box displays. 2. Select multiple devices within the same fabric from the Discovered Fabrics table. 3. Click Edit. The Fabric_Name Edit Switches dialog box displays. FIGURE 10 Edit Switches dialog box 4.
4 SAN discovery overview Configuring SNMP credentials 1. Select Discover > Fabrics. The Discover Fabrics dialog box displays. 2. Select an IP address from the Discovered Fabrics table. 3. Click Edit. The Add Fabric Discovery dialog box displays. 4. To revert to the default SNMPv3 settings, click the Automatic option. Go to step 19. 5. To manually configure SNMP, select the Manual option. Go to step 6. 6. Click the SNMP tab. FIGURE 11 7.
SAN discovery overview 4 16. Enter the authorization password in the Auth Password field. • If you selected Configure for 256-Port_Director_Name, go to step 19. • If you did not select Configure for 256-Port_Director_Name, continue with step 17. 17. Select the privacy protocol in the Priv Protocol field. 18. Enter the privacy password in the Priv Password field. 19. Click OK on the Add Fabric Discovery dialog box. If the seed switch is not partitioned, continue with step 20.
4 SAN discovery overview Removing a fabric from active discovery If you decide you no longer want the Management application to discover and monitor a specific fabric, you can delete it from active discovery. Deleting a fabric also deletes the fabric data on the server (both system collected and user-defined data) except for user-assigned names for the device port, device node, and device enclosure information. To delete a fabric from active discovery, complete the following steps. 1.
Viewing the fabric discovery state 4 Viewing the fabric discovery state The Management application enables you to view device status through the Discover Setup dialog box. To view the discovery status of a device, complete the following steps. 1. Select Discover > Fabrics. The Discover Fabrics dialog box displays. 2. Right-click a fabric and select Expand All to show all devices in the fabric. The Name field displays the discovery status icons in front of the device name.
4 Troubleshooting fabric discovery Managed count exceeded troubleshooting The following section states possible issues and the recommended solution when you exceed your managed count limits. Problem Resolution If you exceed your managed count limit, the Management application displays a “licensed exceeded” message on the topology.
Troubleshooting fabric discovery Problem 4 Resolution Remove a device from active discovery To remove a fabric from active discovery, complete the following steps. 1 Select Discover > Fabrics. The managed count exceeded message displays. Managed counts that have been exceeded display with a light red background. Managed counts that are within the grace count limit display with a pale yellow background. 2 Click OK on the message. The Discover Fabrics dialog box displays.
4 SAN Fabric monitoring Problem Resolution At the time of discovery, SNMP v3 is not configured. At the time of discovery, SNMP v3 is not configured for all other switches in the fabric. After discovery, a device is upgraded to Fabric OS 6.2 or later and is Virtual Fabric-enabled; however, SNMP v3 is not configured Configure the SNMP v3 information for the Virtual Fabric-enabled device. At the time of discovery or fabric refresh, the SNMP v3 user account does not have the Chassis Admin role.
SAN Fabric monitoring 4 For Professional and Professional Plus, the default monitoring interval is 120 seconds (minimum interval is 120 seconds).
4 SAN Fabric monitoring Stop monitoring of discovered switches NOTE You cannot stop monitoring the seed switch. When you stop monitoring a switch, the Management application performs the following actions: • Stops all data collection for the switch. • Unregisters as SNMP trap recipient from the switch. For Virtual Fabric switches, only unregister as SNMP trap recipient when all Virtual Fabric switches of that chassis are unmonitored. • Unregisters as SYSLOG recipient from the switch.
SAN Fabric monitoring 4 2. Select one or more switches in the same fabric that you want to stop monitoring from the Discovered Fabrics table. NOTE You cannot select switches in different fabrics. 3. Click Unmonitor. The Unmonitor Status dialog box displays with the following details: • • • • • • • IP Address — The IP address of the switch. WWN — The WWN of the switch. Name — The name of the switch. FID — The FID of the switch. Fabric Name — The name of the associated fabric.
4 SAN Seed switch Resume monitoring of discovered switches NOTE Monitoring is not supported on Hosts. NOTE You can only monitor a switch that is reachable and has valid credentials. To monitor a switch, complete the following steps. 1. Select Discovery > Fabrics. The Discover Fabrics dialog box displays. 2. Select one or more switches that you want to monitor from the Discovered Fabrics table. 3. Click Monitor. The Monitor Status dialog box displays with the status. 4.
SAN Seed switch 4 This operation preserves historical and configuration data, such as performance monitoring and user-customized data for the selected fabric. ATTENTION If the seed switch firmware is downgraded from Fabric OS 5.2.X to an earlier version, then all RBAC-related data is discarded from the Management application.
4 SAN Seed switch • Identifies which switches are Virtual Fabric-enabled switches (Fabric OS only). If there are Virtual Fabric-enabled switches, the Management application only uses these switches as recommended seed switches. If there are no Virtual Fabric-enabled switches, continue with the next check. • Identifies which switches are Virtual Fabric-capable devices (Fabric OS only).
Host discovery 4 Host discovery The Management application enables you to discover individual hosts, import a group of Host from a comma separated values (CSV) file, or import all hosts from discovered fabrics or VM managers. NOTE Host discovery requires HCM Agent 2.0 or later. NOTE SMI and WMI discovery are not supported. Discovering Hosts by Network address or host name To discover a Host by Network address or host name, complete the following steps. 1. Select Discover > Host Adapters.
4 Host discovery FIGURE 13 Add Host Adapters dialog box 3. (Optional) Enter a discovery request name (such as, Manual 06/12/2009) in the Discovery Request Name field. 4. Select Network Address from the list. 5. Enter the IP address (IPv4 or IPv6 formats) or host name in the Network Address field. 6. Click Add. The IP address or host name of the Host displays in the Host List. 7.
Host discovery 4 13. Click OK on the Add Host Adapters dialog box. If an error occurs, a message displays. Click OK to close the error message and fix the problem. A Host Group displays in Discovered Hosts table with pending status. To update the status from pending you must close and reopen the Discover Host Adapters dialog box. 14. Click Close on the Discover Host Adapters dialog box. Importing Hosts from a CSV file To discover Hosts by importing a CSV file, complete the following steps. 1.
4 Host discovery The CSV file must meet the following requirements: • Comma separated IP address or host names • No commas within the values • No escaping supported For example, XX.XX.XXX.XXX, XX.XX.X.XXX, computername.company.com 6. Click Open. The CSV file is imported to the Add Host Adapters dialog box. During import, duplicate values are automatically dropped. When import is complete, the imported values display in the Host List. If the file cannot be imported, an error displays. 7.
Host discovery FIGURE 15 4 Add Host Adapters dialog box 3. Enter a discovery request name (such as, MyFabric) in the Discovery Request Name field. 4. Select Hosts in Fabrics from the list. 5. Select All fabrics or an individual fabric from the list. 6. Click Add. All hosts which are part of a managed fabric and have a registered host name display in the list. If no host with a registered host name exists, an error message displays. Click OK to close the error message. 7.
4 Host discovery 12. Click OK on the Add Host Adapters dialog box. If an error occurs, a message displays. Click OK to close the error message and fix the problem. A Host Group displays in Discovered Hosts table with pending status. To update the status from pending you must close and reopen the Discover Host Adapters dialog box. 13. Click Close on the Discover Host Adapters dialog box. Importing Hosts from a VM manager To discover Hosts from a discovered VM manager, complete the following steps. 1.
Host discovery 4 • To configure CIM server credentials, select the CIM server (ESXi only) option. Continue with step 8. If you do not need to configure Host credentials, skip to step 12. 8. Configure discovery authentication by choosing one of the following options: • To configure discovery with authentication, select the HTTPS from the Protocol list. • To configure discovery without authentication, select the HTTP from the Protocol list. 9. Enter the port number in the Port field.
4 Host discovery 4. Configure discovery authentication by choosing one of the following options: • To configure discovery with authentication, select the HTTPS from the Protocol list. • To configure discovery without authentication, select the HTTP from the Protocol list. 5. Enter the port number in the Port field. HCM agent default is 34568. CIM server HTTPS default is 5989. CIM server HTTP default is 5988. 6. Enter your username in the User ID field. HCM agent default is admin.
Host discovery 4 5. Click Close on the Discover Host Adapters dialog box. Deleting a host adapter from discovery To delete a host permanently from discovery, complete the following steps. 1. Select Discover > Host Adapters. The Discover Host Adapters dialog box displays. 2. Select the host you want to delete permanently from discovery in the Previously Discovered Addresses table. 3. Click Delete. 4. Click OK on the confirmation message. 5. Click Close on the Discover Host Adapters dialog box.
4 VM Manager discovery • Brocade HBA Discovery Failed: HCM Agent connection failed • HCM Agent collection failed Troubleshooting host discovery If you encounter discovery problems, complete the following checklist to ensure that discovery was set up correctly. For more complete information about troubleshooting adapters, refer to the Brocade Adapters Troubleshooting Guide. 1. Verify IP connectivity by issuing a ping command to the host. a. Open the command prompt. b.
VM Manager discovery FIGURE 18 4 Discover VM Managers dialog box 2. Click Add. The Add VM Manager dialog box displays. FIGURE 19 Add VM Manager dialog box 3. Enter the IP address or host name in the Network Address field. 4. Enter the VM manager port number in the Port field. 5. Enter the VM manager username in the User ID field. 6. Enter the VM manager password Password field. 7.
4 VM Manager discovery 8. Select the Forward event to vCenter check box to enable event forwarding from the Management application to vCenter. Clear to disable event forwarding. 9. Click OK on the Add VM Manager dialog box. If an error occurs, a message displays. Click OK to close the error message and fix the problem. A VM manager displays in Discovered VM Managers table with pending status. To update the status from pending you must close and reopen the Discover VM Managers dialog box. 10.
VM Manager discovery 4 Excluding a host from VM manager discovery To exclude host from VM manager discovery complete the following steps. 1. Select Discover > VM Managers. The Discover VM Managers dialog box displays. 2. Select the Host you want to exclude in the Discovered VM Managers list and click Exclude. 3. Click Close on the Discover VM Managers dialog box. Including a host in VM manager discovery To include host in VM manager discovery complete the following steps. 1.
4 VM Manager discovery 4. Click OK on the confirmation message. The rediscovered VM manager displays in the Discovered VM Managers table. 5. Click Close on the Discover VM Managers dialog box. Deleting a VM manager from discovery To delete a host permanently from discovery, complete the following steps. 1. Select Discover > VM Managers. The Discover VM Managers dialog box displays. 2. Select the VM manager you want to delete permanently from discovery in the Previously Discovered Addresses table. 3.
VM Manager discovery 4 Troubleshooting VM manager discovery If you encounter discovery problems, complete the following checklist to ensure that discovery was set up correctly. 1. Verify IP connectivity by issuing a ping command to the switch. a. Open the command prompt. b. From the Server, type ping Device_IP_Address. 2. Enter the IP address of the device in a browser to verify the SNMP settings. For example, http://10.1.1.11.
4 74 VM Manager discovery Brocade Network Advisor SAN User Manual 53-1002696-01
Chapter Application Configuration 5 In this chapter • Server Data backup. . . . . . . . . . . . . . . . . . . . . . . . . . . . . . . . . . . . . . . . . . . . . 77 • Server Data restore . . . . . . . . . . . . . . . . . . . . . . . . . . . . . . . . . . . . . . . . . . . . . 83 • SAN display settings . . . . . . . . . . . . . . . . . . . . . . . . . . . . . . . . . . . . . . . . . . . . 84 • SAN End node display . . . . . . . . . . . . . . . . . . . . . . . . . . . . . . . . . . . . . . . . . . .
5 Configurable preferences • SAN End Node Display — Use to display (or turn off display of) end nodes on the Connectivity map for newly discovered fabrics. Disabling end node display limits the Connectivity map to switch members only. For more information, refer to “SAN End node display” on page 86. • SAN Ethernet Loss Events — Use to enable events for a loss of ethernet connection to SAN switches. For more information, refer to “SAN Ethernet loss events” on page 87.
Server Data backup 5 Server Data backup The Management application helps you to protect your data by backing it up automatically. Backup is a service process that periodically copies and stores application files to an output directory. The output directory is relative to the server and must use a network share format to support backup to the network. The data can then be restored, as necessary. NOTE Backing up data takes some time.
5 Server Data backup Back up directory structure overview The Management server backs up data to two alternate folders. For example, if the backup directory location is D:\Backup, the backup service alternates between two backup directories, D:\Backup\Backup and D:\Backup\BackupAlt. The current backup is always D:\Backup and contains a complete backup of the system. The older backup is always D:\BackupAlt. If a backup cycle fails, the cause is usually a full CD-RW.
Server Data backup 5 • Select the Include Technical Support directory check box, if necessary. Only available if the Include FTP Root directory check box is clear. • Select the Include Upload Failure Data Capture directory check box, if necessary. Only available if the Include FTP Root directory check box is clear. 5. Enter the time (using a 24-hour clock) you want the backup process to begin in the Next Backup Start Time Hours and Minutes fields. 6.
5 Server Data backup 9. Back up data to a CD by completing the following steps. NOTE This is not recommended on a permanent basis. CDs have a limited life, and may only last a month. An error message occurs if your Management application can no longer back up to the disc. a. Verify that the CD backup directory is correct (default directory is D:\Backup). It is assumed that drive D is a CD-RW drive. You can change the directory or use the Browse button to select another directory. b.
Server Data backup 5 4. Click Apply or OK. Viewing the backup status The Management application enables you to view the backup status at a glance by providing a backup status icon on the Status Bar. The following table illustrates and describes the icons that indicate the current status of the backup function. TABLE 18 Backup status Icon Description Backup in Progress—displays the following tooltip: “Backup started at hh:mm:ss, in progress... XX directories are backed up.
5 Server Data backup Starting immediate backup NOTE You must have backup privileges to use the Backup Now function. For more information about privileges, refer to “User Privileges” on page 1097. To start the backup process immediately, complete one of the following procedures: Using the Backup Icon, right-click the Backup icon and select Backup Now. The backup process begins immediately. OR 1. Select Server > Options. The Options dialog box displays. 2. Select Server Backup in the Category list. 3.
Server Data restore 5 Server Data restore NOTE You cannot restore data from a previous version of the Management application. NOTE You cannot restore data from a higher or lower configuration (Trial or Licensed version) of the Management application. NOTE You cannot restore data from a different package of the Management application. NOTE You cannot restore data from a 64-bit server to a 32-bit server. The Management application helps you to protect your data by backing it up automatically.
5 SAN display settings 5. Browse to the backup location. Browse to the location specified in the Output Directory field on the Options dialog box Backup pane. 6. Click Restore. Upon completion, a message displays the status of the restore operation. Click OK to close the message and the Server Management Console. For the restored data to take effect, re-launch the Configuration Wizard using the instructions in “Launching the Configuration Wizard” on page 5.
SAN display settings FIGURE 22 5 Options dialog box (SAN Display pane) 3. Click Set Up FICON Display. Any table that contains end device descriptions move the following nine columns to the beginning of the table: Attached Port #, FC Address, Serial #, Tag, Device Type, Model, Vendor, Port Type, and WWN. 4. Click Apply or OK to save your work. Resetting your display You can reset your system to display the default display settings.
5 SAN End node display 1. Select Server > Options. The Options dialog box displays. 2. Select SAN Display in the Category list. 3. Click Reset Display. 4. Click Yes on the reset confirmation message. The display and view settings are immediately reset to the default display settings (as detailed in the Default display Settings table (Table 19)). 5. Click Apply or OK to save your work. SAN End node display The connectivity map can be configured to display or not display end nodes.
SAN Ethernet loss events 5 SAN Ethernet loss events An Ethernet event occurs when the Ethernet link between the Management Server and the managed SAN device is lost. You can configure the application to enable events when the Ethernet connection is lost. Enabling SAN Ethernet loss events The Options dialog box enables you to configure the Management application to generate an Ethernet event after a device is offline for a specific period of time.
5 Event storage settings Event storage settings You can configure the maximum number of historical events save to the repository, how long the events will be retained, as well as whether to store historical events to a file before purging them from the repository. Configuring event storage To configure event storage, complete the following steps. 1. Select Server > Options. The Options dialog box displays. 2. Select Event Storage in the Category list (Figure 25).
Flyover settings 5 Storing historical events purged from repository To store historical events purged from the repository, complete the following steps. 1. Select Server > Options. The Options dialog box displays. 2. Select Event Storage in the Category list. 3. Select the Yes option. 4. Click OK. Purged events from the master log table are stored in the Install_Home\data\archive\events directory using the format event_MMDDYYY.zip (for example, event_04052011.zip.
5 Flyover settings FIGURE 26 Options dialog box (Flyovers pane, Product tab) a. Select the protocol type from the Type list, if necessary. b. Select each property you want to display in the product flyover from the Available Properties table.
Flyover settings 7. 5 Add connection properties you want to display on flyover by selecting the Connection tab (Figure 27) and completing the following steps. FIGURE 27 a. Options dialog box (Flyovers pane, Connection tab) Select the protocol type from the Type list, if necessary. Depending on which protocol you select, some properties may not be available for all protocols. b. Select each property you want to display in the connection flyover from the Available Properties table.
5 SAN name settings FCoE • • • Name Node WWN MAC • • • Port# Port Type FCoE Index # c. Click the right arrow to move the selected properties to the Selected Properties table. d. Use the Move Up and Move Down buttons to reorder the properties in the Selected Properties table. The properties displayed in the Selected Properties table appear in the flyover display. 8.
SAN name settings 5 Setting names to be unique You can edit duplicate names so that each device has a unique name. Note that the Duplicated Names dialog box only displays when you set names to be unique and there are duplicate names in the system. To edit duplicate names, complete the following steps. 1. Select Server > Options. The Options dialog box displays. 2. Select SAN Names in the Category list. The SAN Names pane displays (Figure 28). FIGURE 28 Options dialog box (SAN Names pane) 3.
5 SAN name settings 2. Select SAN Names in the Category list. 3. Select Set names to be non-unique to allow duplicate names on your system. 4. Click OK on the Options dialog box. Fixing duplicate names To fix duplicated names, complete the following steps. 1. Select Configure > Names. The Configure Names dialog box displays. 2. Click Fix Duplicates.
SAN name settings 5 Operational Status — The operational status of the device. There are four possible values: Up — Operation is normal. Down — The port is down or the route to the remote destination is disabled. Disabled — The connection has been manually disabled. Backup Active — The backup TCP port is active due to a failover. Port # — The port number. Type — The type of device. 3. Select one of the following options.
5 SAN name settings • Scope list — Select a search value (Name or WWN) from the list. • Search text box — Enter the name or WWN of the device for which you are searching. • Search button — Click to search on the value in the Search field. For more information, refer to “Searching for a device by name” on page 99. • Display table — This table displays the following information: Description–A description of the device. Name–The name of the device. Enter a name for the device.
SAN name settings 5 4. Double-click in the Name column for the selected device or port and enter a name for the device or port. If you set names to be unique on the Options dialog box and the name you entered already exists, the entry is not accepted. To search for the device already using the name, refer to “Searching for a device by name” on page 99 or “Searching for a device by WWN” on page 100 in the Configure Names dialog box or “Searching for a device” on page 258 in the connectivity map.
5 SAN name settings 5. Click OK on the Configure Names dialog box. Removing a name from a device 1. Select Configure > Names. The Configure Names dialog box displays. 2. In the Display table, select the name you want to remove. 3. Click Remove. An application message displays asking if you are sure you want clear the selected name. 4. Click Yes. 5. Click OK to close the Configure Names dialog box. 6. Click OK on the confirmation message.
SAN name settings 5 5. Click OK to close the Configure Names dialog box. Importing Names If the name length exceeds the limitations detailed in the following table, you must edit the name (in the CSV file) before import. Names that exceed these limits will not be imported. If you migrated from a previous version, the .properties file is located in the Install_Home\migration\data folder. TABLE 20 Device Character limit Fabric OS switch 6.
5 SAN name settings 4. Enter the name you want to search for in the Search field. You can search on partial names. NOTE To search for a device, the device must be discovered and display in the topology. 5. Click Search. All devices with the specified name (or partial name) are highlighted in the Display table. You may need to scroll to see all highlighted names. If the search finds no devices, a ‘no item found’ message displays. 6. Click OK to close the Configure Names dialog box.
Miscellaneous security settings 5 Miscellaneous security settings You can configure the Server Name, login banner, modify whether or not to allow clients to save passwords, and modify whether or not to enforce the MD5 checksum during import. When the login banner is enabled, each time a client connects to the server, the login banner displays with a legal notice provided by you. The client's users must acknowledge the login banner to proceed, otherwise they are logged out.
5 Miscellaneous security settings 5. Click Apply or OK to save your work. Enforcing MD5 file during import NOTE The MD5 checksum file is required when you load Fabric OS firmware into the Management application version 12.0 or later. You can configure the Management application to enforce the MD5 checksum file import during the import of the Fabric OS image into the firmware repository.
Syslog Registration settings 5 4. Enter the message you want to display every time a user logs into this server in the Banner Message field. This field contains a maximum of 2048 characters. 5. Click Apply or OK to save your work. Disabling the login banner To disable the login banner display, complete the following steps. 1. Select Server > Options. The Options dialog box displays. 2. Select Security Misc in the Category list. 3. Clear the Display login banner upon client login check box.
5 SNMP Trap Registration settings Configuring the Syslog listing port number 1. Select Server > Options. The Options dialog box displays. 2. Select Syslog Registration in the Category pane. The Syslog Registration pane displays (Figure 32). 3. Enter the Syslog listening port number of the Server in the Syslog Listening Port (Server) field, if necessary. The default Syslog listening port number is 514 and is automatically populated. 4. Click Apply or OK to save your work.
SNMP Trap forwarding credential settings 5 3. Enter the SNMP listening port number of the Server in the SNMP Listening Port (Server) field, if necessary. The default SNMP listening port number is 162 and is automatically populated. 4. Click Apply or OK to save your work. SNMP Trap forwarding credential settings You can configure SNMP credentials for the traps forwarded by the server. Configuring SNMP v1 and v2c credentials To configure a SNMP v1 or v2c credentials, complete the following steps. 1.
5 Software Configuration Configuring SNMP v3 credentials To configure a SNMP v1 or v2c credentials, complete the following steps. 1. Select Server > Options. The Options dialog box displays. 2. Select Trap Forwarding Credentials in the Category pane. The Trap Forwarding Credentials pane displays (Figure 34). 3. Enter the SNMP v3 name (case sensitive, 1 to 16 characters) to identify the credentials in the User Name field. Allows all printable ASCII characters. 4.
Software Configuration 5 Certificates Certificate management allows you to enable certificate validation between the Management application server and products when HTTPS is enabled and between server and client when SSL is enabled on server. For more information about product communication, refer to “Product communication settings” on page 122. Certificate management also allows you to manage the Management application server truststore as well as the Management application client truststore.
5 Software Configuration The Certificates pane contains the following fields and components: • Enable certificate validation check box — Select to enable certificate validation. Clear to disable certificate validation • Keystore Certificates drop-down list — Select one of the following options: View — Click to view the keystore certificate details. For more information, refer to “Viewing a truststore certificate” on page 108. Export — Click to export a keystore certificate.
Software Configuration FIGURE 36 5 Details - Certificate Name dialog box The Details - Certificate Name dialog box contains the following fields: • Left-side text box — Name of the Issuer. • Right-side table — Displays the following certificate details: Version — Version of the certificate. Serial Number — Serial number of the certificate. Signature Algorithm — Signature algorithm used to sign the certificate. The signature algorithm is derived from the algorithm of the underlying private key.
5 Software Configuration 5. Enter a unique alias for the certificate in the Alias Name field. 6. Click OK. 7. Click Apply or OK to save your work. Deleting a truststore certificate 1. Select Server > Options. The Options dialog box displays. 2. Select Certificates to in the Category list. The Certificates pane displays. 3. Select the truststore you want to delete in the Truststore Certificates table. 4. Click Delete. 5. Click Yes on the confirmation message.
Software Configuration 5 Viewing a keystore certificate 1. Select Server > Options. The Options dialog box displays. 2. Select Certificates to in the Category list. The Certificates pane displays. 3. Select View from the Keystore Certificate list. The Details - Certificate Name dialog box displays with the following fields: • Left-side text box — Name of the Issuer. • Right-side table — Displays the following certificate details: Version — Version of the certificate.
5 Software Configuration Replacing a keystore certificate NOTE Changes to this option take effect after an application restart. 1. Select Server > Options. The Options dialog box displays. 2. Select Certificates to in the Category list. The Certificates pane displays. 3. Select Replace from the Keystore Certificate list. The Replace Keystore Certificate dialog box displays. 4. To replace the current certificate with a new self-signed certificate, select the A new self signed certificate option. 5.
Software Configuration 5 Enabling and disabling certificate validation The Management application server only validates the certifying authority and the date in the certificate. Certificate validation requires HTTPS connections between the server and the switches. To configure product communication to HTTPS, refer to “Product communication settings” on page 122. 1. Select Server > Options. The Options dialog box displays. 2. Select Certificates to in the Category list. The Certificates pane displays. 3.
5 Software Configuration 4. Click Apply or OK to save your work. NOTE Changes to this option take effect after a client restart. 5. Click OK on the “changes take effect after client restart” message. Client/Server IP You can configure connections between the client or switches and the Management application server. Configuring the server IP address If your Operating System is IPv6-enabled (dual mode or IPv6 only), the server binds using an IPv6 address.
Software Configuration FIGURE 38 5 Options dialog box (Client/Server IP option) 3. Choose one of the following options in the Server IP Configuration list. • Select All. Go to step 4. • Select a specific IP address. Continue with step 5. • Select localhost. Continue with step 5. When Server IP Configuration is set to All, you can select any available IP address as the Return Address. If you select a specific IP address, the Return Address list shows the same IP address and you cannot change it. 4.
5 Software Configuration Configuring an explicit server IP address If you selected a specific IP address from the Server IP Configuration screen during installation and the selected IP address changes, you will not be able to connect to the server. To connect to the new IP address, you must manually update the IP address information. To change the IP address, complete the following steps. 1. Choose one of the following options: • On Windows systems, select Start > Programs > Management_Application 12.X.
Software Configuration 5 8. Verify the IP address on the Server Configuration Summary screen and click Next. 9. Click Finish on the Start Server screen. 10. Click Yes on the restart server confirmation message. 11. Enter your user name and password. The defaults are Administrator and password, respectively. NOTE Do not enter Domain\User_Name in the User ID field for LDAP server authentication. 12. Click Login. 13. Click OK on the Login Banner.
5 Software Configuration 4. Select the return IP address in the Client - Server IP Configuration Return Address list. When Server IP Configuration is set to All, you can select any available IP address as the Return Address. If you select a specific IP address, the Return Address field shows the same IP address and you cannot change it. 5. Click Apply or OK to save your work. NOTE Changes take effect after you restart the Management Server.
Software Configuration 5 4. Enter the memory allocation (MB) for the client in the Client Memory Allocation field. If you enter an invalid value, an error message displays with the minimum value allowed. Click OK and edit the value again. The current configured number of megabytes for client memory allocation displays in the Current Value field. The default minimum number of megabytes for client memory allocation displays in the Default Minimum field.
5 Software Configuration • Enterprise Medium : 1500 MB • Enterprise Large : 2048 MB Default values for SAN only Server Server Heap Size For a 32-bit Windows or Linux Server • Small : 768 MB • Medium : 950 MB • Large : 950 MB For a 64-bit Windows or Linux Server • Small : 1024 MB • Medium : 1500 MB • Large : 2048 MB NOTE There is no restriction on the maximum value for Server Heap Size in a 64-Bit Server. The correct server heap size value must be given according to the RAM present in the server. 6.
Software Configuration 5 3. Enter how often you want to check for state changes in the Check for state change every field. Valid values are from 1 through 600 seconds. You cannot enter a value lower than the default minimum value. Default minimum values are as follows: • Small (Professional): 60 seconds • Medium: 120 seconds • Large: 180 seconds 4. Enter how often you want to check for state changes in the If no state change, Poll switch every field. Valid values are from 1 through 3,600 seconds.
5 Software Configuration Viewing the network size status The Management application enables you to view the network size status at a glance by providing a status icon on the Status Bar. Double-click the icon to launch the Memory Allocation pane of the Options dialog box. NOTE If you exceed the recommended count, the network size status icon refreshes when the License is refreshed (every three hours) or after a client restart.
Software Configuration FIGURE 40 5 Options dialog box (Product Communication pane) 3. To connect using HTTP, complete the following steps. a. Select the Connect using HTTP option. b. Enter the connection port number in the Port # field. Go to step 5. The default HTTP port number is 80. NOTE To manage FIPS-enabled Fabric OS fabrics, you must configure Product Communication using the Connect using HTTPS (HTTP over SSL) only option. 4.
5 Software Configuration FTP/SCP/SFTP server settings NOTE For FIPS-enabled Fabric OS switches, you must configure the FTP/SCP/SFTP server communication to an external SCP server to download firmware and allow technical support. File Transfer Protocol (FTP) is a network protocol used to transfer data from one computer to another over a TCP computer network. During installation, a built-in FTP server and its services are installed.
Software Configuration 5 Configuring an internal FTP server To configure the internal FTP server settings, complete the following steps. 1. Select Server > Options. The Options dialog box displays. 2. Select FTP/SCP/SFTP in the Category list. The FTP/SCP/SFTP pane displays (Figure 41). FIGURE 41 Options dialog box (FTP/SCP/SFTP pane) 3. Select the Use built-in FTP/SCP/SFTP Server option to use the default built-in FTP server. All active fields are mandatory. The default user name is admin.
5 Software Configuration Configuring an internal SCP or SFTP server NOTE SCP is supported on Fabric OS devices running 5.3 and later. NOTE SFTP is supported on Fabric OS devices running 7.0 and later. To configure the internal SCP or SFTP server settings, complete the following steps. 1. Select Server > Options. The Options dialog box displays. 2. Select FTP/SCP/SFTP in the Category list. The FTP/SCP/SFTP pane displays (Figure 41). FIGURE 42 Options dialog box (FTP/SCP/SFTP pane) 3.
Software Configuration 5 Configuring an external FTP, SCP, or SFTP server NOTE For FIPS-enabled Fabric OS switches, you must configure the FTP/SCP/SFTP server communication to an external SCP or SFTP server to download firmware and allow technical support. NOTE SCP is supported on Fabric OS devices running 5.3 and later. NOTE SFTP is supported on Fabric OS devices running 7.0 and later. To configure external FTP, SCP, or SFTP server settings, complete the following steps. 1. Select Server > Options.
5 Software Configuration 5. To configure an external SCP server, complete the following steps. a. Select the SCP Server check box to configure the external SCP server. All fields are mandatory. b. Enter the IP address for the remote host in the SCP Host IP field. c. Enter a user name in the SCP Host User Name field. d. Enter the path to the remote host in the SCP Directory Path field. Use a slash (/) or period (.) to denote the root directory. Do not give an absolute path. e.
Software Configuration 5 • If you are using the external FTP server, select the Use external FTP/SCP/SFTP Server option. For step-by-step instructions about configuring the built-in server, refer to “Configuring an external FTP, SCP, or SFTP server” on page 127. 4. Click Test. An “FTP, SCP, or SFTP Server running successfully” or an error message displays.
5 Software Configuration 5. Enter a port number in the Starting Port # field. The default is 24600. For Professional, the server requires 15 consecutive free ports beginning with the starting port number. For Trial and Licensed versions, the server requires 18 consecutive free ports beginning with the starting port number. 6. Click Apply or OK to save your work. NOTE Changes to this option take effect after application restart. 7. Click OK on the “changes take effect after application restart” message.
Software Configuration 5 5. Click Apply or OK to save your work. NOTE Changes to the server log levels reset to the default (INFO) after a server restart. NOTE Changes to the Log client support data log level is applicable for this client only. client. log file properties • Client logs are collected separately for each server. After successful login, a log file is created and prefixed with the network address provided in the Login dialog box. For example, 172.26.1.1.client.log or localhost.client.
5 FIPS Support FIPS Support To manage FIPS-enabled Fabric OS fabrics and switches, make sure you complete the following configuration requirements: • Configure Product Communication to HTTPS (refer to “Configuring SAN communication” on page 122) to allow communication between the server and the Fabric OS switches. • Configure an external SCP server (refer to “Configuring an external FTP, SCP, or SFTP server” on page 127) to allow firmware download, product technical support, and supportSave.
Fabric tracking 5 • Device Ports—This table shows a brief summary of the device ports including status (whether the device port will be added ( ) or removed ( ) from the fabric), device type, port, port WWN, node WWN, and attached port number.
5 Fabric tracking • Fabric Name—Displays the name of the selected fabric. • Switches—This table shows a brief summary of the switches including status (whether the device port will be added ( ) or removed ( ) from the fabric), name, IP address, WWN, and domain ID. This table includes unmonitored switches which becomes segmented from the fabric.
Fabric tracking 5 Accepting changes for a switch, access gateway, or phantom domain 1. Accept the changes to a switch, access gateway, or phantom domain by choosing one of the following options: • Select the switch, access gateway, or phantom domain on the Product List or Connectivity Map and select Monitor > Accept Changes. • Right-click the switch, access gateway, or phantom domain on the Product List or Connectivity Map and select Accept Change. The Accept Changes Summary dialog box displays.
5 136 Fabric tracking Brocade Network Advisor SAN User Manual 53-1002696-01
Chapter 6 User Account Management In this chapter • Users overview. . . . . . . . . . . . . . . . . . . . . . . . . . . . . . . . . . . . . . . . . . . . . . . . • User accounts . . . . . . . . . . . . . . . . . . . . . . . . . . . . . . . . . . . . . . . . . . . . . . . . • Roles. . . . . . . . . . . . . . . . . . . . . . . . . . . . . . . . . . . . . . . . . . . . . . . . . . . . . . . . • Areas of responsibility . . . . . . . . . . . . . . . . . . . . . . . . . . . . . . . . . . . . . . . . . .
6 Users overview Viewing configured users To view configured users, complete the following steps. 1. Select Server > Users. The Users dialog box displays. 2. Click the Users tab, if necessary. FIGURE 46 Users dialog box - Users tab The Users dialog box contains the following fields and components: • Authentication-Primary — The primary authentication server type configured through the Server Management Console.
Users overview 6 • Users table — The configured users. User ID — The unique name used to identity a user. Full Name — The user’s full name. Roles — List of Roles the user belongs to separated by comma. Area Of Responsibility — List of AORs the user belongs to separated by comma. E-mail Notification — Whether e-mail notification is enabled for user. Account Enabled — Whether the user account status is enabled. Policy Violations — Whether there is a current policy violation for the user.
6 Users overview Default system roles for SAN only environments include: - SAN System Administrator Network Administrator Security Administrator Zone Administrator Operator Security Officer Host Administrator Description — A description of the role. Add button — Click to add a new role (refer to “Creating a new role” on page 147). Edit button — Click to edit the selected role (refer to “Editing a role” on page 148).
User accounts 6 User accounts NOTE You must have User Management Read and Write privileges to add new accounts, set passwords for accounts, and apply roles to the accounts. For a list of privileges, refer to “User Privileges” on page 1097. Management application user accounts contain the identification of the Management application user, as well as privileges, roles, and AORs assigned to the user. Privileges provide access to the features in Management application.
6 User accounts 4. Enter a password for the user in the Password and Confirm Password fields. Passwords displays as dots (.). For password policy details, refer to “Viewing your password policy” on page 163. 5. Select the Account Status - Enable check box to enable the account of the user. Account Status is enabled by default. 6. (Optional) Enter the full name of the user in the Full Name field. 7. (Optional) Enter a description for the user in the Description field. 8.
User accounts 6 Editing a user account To make changes to an existing user account, complete the following steps. 1. Select Server > Users. The Users dialog box displays. 2. Select the user account you want to edit and click Edit under the Users table. The Edit User dialog box displays. 3. Complete step 3 through step 13 in “Creating a new user account” on page 141. 4. Click OK to save the user account and close the Edit User dialog box.
6 User accounts Copying and pasting user preferences Enables you to copy user preference settings, such as window and dialog box sizes, table column and sort order, as well as other customizations, and all the user-defined views (including fabrics and hosts) from the selected user account to one or more other user accounts. If the fabric and hosts from the original user account are not included in the other user's AOR, then the copied fabrics and hosts do not display in the other user's views.
User accounts 6 4. Click OK to save the user account and close the Edit User dialog box. If you make changes to the user’s role or AOR while the user is logged in, a confirmation message displays. When you click OK on the confirmation message, the user is logged out and must log back in to see the changes. 5. Click Close to close the Users dialog box. Removing roles and areas of responsibility from a user account To remove roles and AORs from an existing user account, complete the following steps. 1.
6 User accounts Enabling a user account To re-activate a user account, complete the following steps. 1. Select Server > Users. The Users dialog box displays. 2. Select the disabled user account you want to enable in the Users table and click Enable. 3. Click Yes on the confirmation message. 4. Click Close to close the Users dialog box. Deleting a user account NOTE You cannot delete the default "Administrator" user account.
Roles 6 Roles NOTE You must have User Management Read and Write privileges to view, add, modify, or delete roles. A role is a group of Management application tasks or privileges that can be assigned to several users who have similar functions. When you create a role, it immediately becomes available in the Users dialog box. Creating a new role To create a new role, complete the following steps. 1. Select Server > Users. The Users dialog box displays. 2. Click Add under the Roles table.
6 Roles 6. Click OK to save the new role and close the Add Role dialog box. The new role displays in the Roles list of the Users dialog box. To add users to this role, follow the instructions in “Assigning roles and areas of responsibility to a user account” on page 144. 7. Click Close to close the Users dialog box Editing a role To make changes to an existing role, complete the following steps. 1. Select Server > Users. The Users dialog box displays. 2.
Roles 6 Deleting a role To delete a role, complete the following steps. 1. Select Server > Users. The Users dialog box displays. 2. Select the role you want to delete in the Roles table and click Delete. 3. Click Yes on the confirmation message. 4. Click Close to close the Users dialog box. Adding privileges to a role Each option under the Management application main menu corresponds to a privilege.
6 Areas of responsibility Removing privileges from a role You remove privileges from the Edit or Duplicate Users dialog boxes. To remove privileges from role, complete the following steps. 1. Select Server > Users. The Users dialog box displays. 2. Select the role you want to edit in the Roles table and click Edit or Duplicate under the Roles table. The Edit Roles or Duplicate Roles dialog box displays. 3.
Areas of responsibility 6 Creating an AOR When creating an AOR, you assign devices or groups to that AOR. After you save the AOR, it can be assigned to one or more user account. Users of those accounts can then view the devices or groups in their assigned AOR. Users can deploy configurations and payloads only to devices in assigned AORs. When you create an AOR, it immediately becomes available in the Users dialog box. To create an AOR, complete the following steps. 1. Select Server > Users.
6 Areas of responsibility Editing an AOR NOTE You cannot edit system AORs. To make changes to an existing AOR, complete the following steps. 1. Select Server > Users. The Users dialog box displays. 2. Select the AOR you want to edit in the AOR table and click Edit. The Edit AOR dialog box displays. 3. Complete step 3 through step 5 in “Creating an AOR” on page 151. 4. Click OK to save the AOR and close the Edit AOR dialog box.
Areas of responsibility 6 Deleting an AOR NOTE You cannot delete system AORs. To delete an AOR, complete the following steps. 1. Select Server > Users. The Users dialog box displays. 2. Select the AOR you want to delete in the AOR table and click Delete. 3. Click Yes on the confirmation message. 4. Click Close to close the Users dialog box. Assigning products to an AOR You can assign fabricsand hosts to an AOR from the Add, Edit, or Duplicate AOR dialog box.
6 Password policies 3. In the Selected Products table, select the products or groups you want to remove and click the left arrow button. Select multiple products or groups by holding down the CTRL key and clicking more than one item. 4. Click OK to save your work. 5. Click Close to close the Users dialog box. Password policies NOTE You must have User Management Read and Write privileges to configure password policy. Passwords are an important aspect of computer security.
Password policies b. 6 Enter the minimum password length in the Minimum Length field. Only enabled when the Empty Password - Allow check box is clear. Valid values are 4 through 127. The default is 8. c. Enter the minimum number of uppercase characters required in the Upper Case Characters field. Only enabled when the Empty Password - Allow check box is clear. Valid values are 0 through 127. The default is 0. d.
6 Password policies 7. Configure the password login policy by completing the following steps. a. Select Concurrent Login or Single Login from the Login Mode list. Single Login allows only one user to login at a time. If you selected Single Login, continue with step b. Concurrent Login allows multiple users to login at the same time. If you selected Concurrent Login, go to step 8. b. Select Reject New Sessions or Logout Existing Sessions from the Action list. 8.
LDAP authorization on the Management server 6 LDAP authorization on the Management server NOTE You must have User Management Read and Write privileges to map roles and AORs to Active Directory (AD) groups. NOTE You must configure an LDAP server as the primary authentication server and set LDAP Authorization as the authorization preference (refer to “Configuring LDAP server authentication” on page 297).
6 LDAP authorization on the Management server Removing roles and AORs from an AD group To remove roles and AORs from an AD group, complete the following steps. 1. Select Server > Users. The Users dialog box displays. 2. Click the LDAP Authorization tab. 3. Select the roles and AORs you want to remove in the Active Directory Groups table. Select multiple roles and AORs by holding down the CTRL key and clicking more than one role and AOR. 4. Click the left arrow button.
LDAP authorization on the Management server 6 Deleting an AD group Deleting an AD group deletes the roles and AORs assigned to the group and removes the group from the Active Directory Groups table. To delete an AD group, complete the following steps. 1. Select one or more AD groups that you want to delete from the Active Directory Groups table. 2. Click Delete. 3. Click Yes on the confirmation message. 4. Click OK on the deletion successful message. 5. Click OK to save your work.
6 LDAP authorization on the Management server Defining user accounts on the external LDAP server If you configure the external LDAP server as the primary authentication server in the server management console, you must define roles and AORs in the external LDAP server to match the Management application roles and AORs. Configuring roles and AORs on the external LDAP server Open the Management console on the Active Directory installed server and complete the following steps. 1. Select Start > Run. 2.
User profiles 6 Configuring authorization details on the external LDAP server Open the ADSI Edit dialog box on the Active Directory installed server. 1. Select Start > Run. 2. Type adsiedit.msc and press Enter. 3. Right-click CN=User_Name in the CN=Users directory and select Properties. Where User_Name is the name of the user you created in “Creating an AD user account” on page 159. 4. Select NmAors in the Attributes list and click Edit. 5.
6 User profiles • Full Name — Displays the name if entered while adding a user; otherwise, this field is blank. • Password — Displays your password as dots (.). If the password policy is configured for an empty password, this field is blank. To change your password, refer to “Changing your password” on page 163. • Confirm Password — Displays your password as dots (.). If the password policy is configured for an empty password, this field is blank.
User profiles 7. 6 Click Filter to set up basic event filters. For step-by-step instructions about setting up basic event filters, refer to “Setting up basic event filtering” on page 975. 8. Change your e-mail, text message, or page address in the E-mail Address field. Enter more than one e-mail address, separating each with a semi-colon. To send a text message or page via e-mail, use the following format number@carrier.com, where number is your phone number and carrier.com is the SMS server.
6 User profiles • Minimum Length—The minimum length allowed for the password. • Upper Case Characters—The minimum number of uppercase characters required in the password. • Lower Case Characters—The minimum number of lowercase characters required in the password. • Number of Digits—The minimum number of digits required in the password. • Punctuation Required—The minimum number of punctuation characters required in the password.
User profiles 6 4. Enter your e-mail, text message, or page address in the E-mail Address field. Enter more than one e-mail address, separating each with a semi-colon. To send a text message or page via e-mail, use the following format number@carrier.com, where number is your phone number and carrier.com is the SMS server. For example, 3035551212@txt.att.net (text message) or 3035551212@page.att.net (page). NOTE Check with your carrier for the exact e-mail address. 5.
6 166 User profiles Brocade Network Advisor SAN User Manual 53-1002696-01
Chapter 7 Call Home In this chapter • About Call Home . . . . . . . . . . . . . . . . . . . . . . . . . . . . . . . . . . . . . . . . . . . . . . • Viewing Call Home configurations . . . . . . . . . . . . . . . . . . . . . . . . . . . . . . . . • Showing a Call Home center. . . . . . . . . . . . . . . . . . . . . . . . . . . . . . . . . . . . . • Hiding a Call Home center . . . . . . . . . . . . . . . . . . . . . . . . . . . . . . . . . . . . . . • Editing a Call Home center . . . . . . . . . . . . . . .
7 About Call Home About Call Home NOTE Call Home is supported on Windows systems for all modem and e-mail Call Home centers and is supported on UNIX for the e-mail Call Home centers. Call Home notification allows you to configure the Management application server to automatically send an e-mail alert or dial in to a support center to report system problems on specified devices (Fabric OS switches, routers, and directors).
Viewing Call Home configurations 7 Call Home allows you to perform the following tasks: • • • • • Assign devices to and remove devices from the Call Home centers. Define filters from the list of events generated by Fabric OS devices. Edit and remove filters available in the Call Home Event Filters table. Apply filters to and remove filters from the devices individually or in groups. Edit individual Call Home center parameters to dial a specified phone number or e-mail a specific recipient.
7 Viewing Call Home configurations • Products List — Displays all discovered products. The list allows for multiple selections and manual sorting of columns. This list displays the following information: Product Icon — The status of the products’ manageability. Name — The name of the product. IP Address — The IP address (IPv4 or IPv6 format) of the product. Node WWN — The node world wide name of the product. Fabric Name — The name of the fabric. Vendor — The vendor ID of the product.
Viewing Call Home configurations 7 • Call Home Centers list — The Call Home centers, products assigned to the Call Home centers, and event filters assigned to the Call Home centers and products. This list displays the following information: Centers — A tree with Call Home centers as the parent node, assigned products as subnodes, and event filters as the child node to the assigned products.
7 Showing a Call Home center Showing a Call Home center To show a Call Home center, complete the following steps. 1. Select Monitor > Event Notification > Call Home. The Call Home dialog box displays. 2. Click Show/Hide Centers (beneath the Call Home Centers list). The Centers dialog box displays with a predefined list of Call Home centers (Figure 51). FIGURE 51 Centers dialog box 3. Select the check boxes of the Call Home centers you want to display. Clear the check box to hide the Call Home center.
Editing a Call Home center 7 Editing a Call Home center To edit a Call Home center, select from the following procedures: • Editing the IBM Call Home center . . . . . . . . . . . . . . . . . . . . . . . . . . . . . . . . • Editing an e-mail Call Home center . . . . . . . . . . . . . . . . . . . . . . . . . . . . . . . • Editing the EMC Call Home center . . . . . . . . . . . . . . . . . . . . . . . . . . . . . . . . • Editing the HP LAN Call Home center. . . . . . . . . . . . . . . . . . . . . . . . . . .
7 Editing a Call Home center 8. Enter how often you want to retry the heartbeat interval in the Retry Interval field. The default is 10 seconds. 9. Enter the maximum number of retries in the Maximum Retries field. The default is 3. 10. Enter the primary phone number or extension of the Call Home center in the Call Home Center - Primary Connection field. 11. Enter the backup phone number or extension of the Call Home center in the Call Home Center - Backup Connection field. 12.
Editing a Call Home center FIGURE 53 7 Configure Call Home Center dialog box (Brocade, IBM, NetApp, or Oracle E-mail option) 4. Make sure the Call Home center type you selected displays in the Call Home Centers list. If the Call Home center type is incorrect, select the correct type from the list. 5. Select the Enable check box to enable this Call Home center. 6. Enter your contact name in the Customer Details - Name field. 7. Enter your company name in the Customer Details - Company field. 8.
7 Editing a Call Home center 16. Enter an e-mail address in the E-mail Notification Settings - Send To Address field. For Brocade E-mail Call Home centers, enter callhomeemail@brocade.com. 17. Click Send Test to test the mail server. The selected Call Home center must be enabled to test the mail server. A faked event is generated and sent to the selected Call Home center. You must contact the Call Home center to verify that the event was received and in the correct format.
Editing a Call Home center - Source — Details about the product. Includes the following data: - Event Time Event Severity Event Reason Code FRU Code/Event Type Event Description Event Data — Information about the triggered event.
7 Editing a Call Home center Editing the EMC Call Home center To edit an EMC Call Home center, complete the following steps. 1. Select Monitor > Event Notification > Call Home. The Call Home dialog box displays. 2. Select the EMC Call Home center you want to edit in the Call Home Centers list. 3. Click Edit Centers (beneath the Call Home Centers list). The Configure Call Home Center dialog box displays (Figure 54). FIGURE 54 Configure Call Home Center dialog box (EMC option) 4.
Editing a Call Home center 7 13. Click OK. The Call Home dialog box displays with the Call Home center you edited highlighted in the Call Home Centers list. 14. Click OK to close the Call Home dialog box. Editing the HP LAN Call Home center To edit an HP LAN Call Home center, complete the following steps. 1. Select Monitor > Event Notification > Call Home. The Call Home dialog box displays. 2. Select the HP LAN Call Home center you want to edit in the Call Home Centers list. 3.
7 Enabling a Call Home center 8. Click Send Test to test the address. The selected Call Home center must be enabled to test the IP address. A faked event is generated and sent to the selected Call Home center. You must contact the Call Home center to verify that the event was received and in the correct format. NOTE The HP LAN Call Home alert displays the directory separation characters with a double backslash (\\) instead of a single backslash (\). 9. Click OK to close the “Test Event Sent” message.
Testing the Call Home center connection 7 Testing the Call Home center connection Once you add and enable a Call Home center, you should verify that Call Home is functional. To verify Call Home center functionality, complete the following steps. 1. Select Monitor > Event Notification > Call Home. 2. Click Edit Centers (beneath the Call Home Centers list). The Configure Call Home Center dialog box displays. 3. Select the Call Home center you want to check in the Call Home Centers list. 4.
7 Viewing Call Home status Viewing Call Home status You can view Call Home status from the main Management application window or from the Call Home Notification dialog box. The Management application enables you to view the Call Home status at a glance by providing a Call Home status icon on the status bar. Table 23 illustrates and describes the icons that indicate the current status of the Call Home function.
Assigning a device to the Call Home center 7 Assigning a device to the Call Home center Discovered devices (switches, routers, and directors) are not assigned to a corresponding Call Home center automatically. You must manually assign each device to a Call Home center before you use Call Home. To assign a device or multiple devices to a Call Home center, complete the following steps. 1. Select Monitor > Event Notification > Call Home. The Call Home dialog box displays. 2.
7 Defining an event filter 3. Click the left arrow button. A confirmation message displays. 4. Click OK. All devices assigned to the selected Call Home center display in the Products List. Any assigned filters are also removed. 5. Click OK to close the Call Home dialog box. Defining an event filter To define an event filter, complete the following steps. 1. Select Monitor > Event Notification > Call Home. The Call Home dialog box displays. 2. Click Add beneath the Call Home Event Filter list.
Assigning an event filter to a Call Home center 7 Assigning an event filter to a Call Home center Event filters allow Call Home center users to log in to a Management server and assign specific event filters to the devices. This limits the number of unnecessary or “acknowledge” events and improves the performance and effectiveness of the Call Home center. You can only select one event filter at a time; however, you can assign the same event filter to multiple devices or Call Home centers.
7 Overwriting an assigned event filter Overwriting an assigned event filter A device can only have one event filter at a time; therefore, when a new filter is applied to a device that already has a filter, you must confirm the new filter assignment. To overwrite an event filter, complete the following steps. 1. Select Monitor > Event Notification > Call Home. The Call Home dialog box displays. 2. Select the event filter you want to apply in the Call Home Event Filters list.
Removing an event filter from a device 7 Removing an event filter from a device To remove an event filter from a device, complete the following steps. 1. Select Monitor > Event Notification > Call Home. The Call Home dialog box displays. 2. Choose one of the following options in the Call Home Centers list: • Right-click a device to which the event filter is assigned and select Remove Filter. • Select an event filter assigned to a device and click the left arrow button.
7 188 Searching for an assigned event filter Brocade Network Advisor SAN User Manual 53-1002696-01
Chapter 8 Dashboard Management In this chapter • Dashboard overview . . . . . . . . . . . . . . . . . . . . . . . . . . . . . . . . . . . . . . . . . . . • Dashboard widgets . . . . . . . . . . . . . . . . . . . . . . . . . . . . . . . . . . . . . . . . . . . . • Performance Dashboard monitors . . . . . . . . . . . . . . . . . . . . . . . . . . . . . . . . • User-defined performance monitors . . . . . . . . . . . . . . . . . . . . . . . . . . . . . .
8 Dashboard overview FIGURE 56 Dashboard tab 1. Menu bar — Lists commands you can perform on the dashboard. For a list of Dashboard tab menu commands, refer to “Dashboard main menus” on page 1061. The dashboard also provides a shortcut menu to reset the dashboard back to the defaults. Reset the dashboard back to the default settings by right-clicking in the white space and selected Reset to Default. 2. Toolbar — Provides buttons that enable quick access to dialog boxes and functions.
Dashboard overview 8 Dashboard toolbar The toolbar (Figure 57) is located beneath the menu bar and provides icons and buttons to perform various functions. FIGURE 57 Toolbar Depending on which dashboard you are using the toolbar contains the following buttons: 1. Dashboard list — Select one of the following to choose the dashboard you want to view. • Main Dashboard — Select to display the Dashboard tab. • Dashboard 1 — Select to display the Performance Dashboard. 2.
8 Dashboard overview 3. Click the Performance tab (Figure 58). The preconfigured performance monitor widgets display. You can create up to 100 performance monitors; however, you can only display up to 30 performance monitors. For more information about performance monitor widgets, refer to “Performance Dashboard monitors” on page 204.
Dashboard overview 8 General functions The Management application also provides the following general functions which are applicable to all widgets and monitors: • Preference persistence — Any customization you make to the Dashboard tab or Performance Dashboard are persisted in that dashboard.
8 Dashboard widgets 4. Click Save. The file is saved to the location you selected. Printing the dashboard display You can print the current dashboard display (all widgets and monitors) or a selected widget or monitor. 1. Select one of the following options from the Print list: • Dashboard — Prints the entire dashboard. • Name — Prints the selected widget (where Name is the name of the widget or monitor on the dashboard). The Page Setup dialog box displays. 2. Change the page setup options, as needed. 3.
Dashboard widgets 8 Bottlenecked Ports widget The Bottlenecked Ports widget (Figure 59) displays the bottlenecked port violations for the specified fabric and time range in a table. FIGURE 59 Bottlenecked Ports widget The Bottlenecked Ports widget includes the following data: • Severity icon/violation count/widget title — The color of the worst severity and the total number of ports in violation displays before the widget title.
8 Dashboard widgets Customizing the Bottlenecked Ports widget You can customize the widget to display data for a specific fabric and duration. • Display data by selecting the fabric you want to monitor from the Show list. Select All Fabrics to include all managed and monitored fabrics in your AOR. The default is All Fabrics. If the fabric you select is deleted from discovery, the widget refreshes and returns to the default (All Fabrics).
Dashboard widgets 8 • Range list — Use to customize this widget to display a specific time range. Options include: This Hour, Last Hour, Today, Yesterday, Last 7 Days, and Last 30 Days. • Show Syslog check box — Select to include Syslog information (default) on the Event Summary.
8 Dashboard widgets • Include Syslog information (default) on the Event Summary pane by selecting the Show Syslog check box. To exclude Syslog information, clear the Show Syslog check box. Accessing additional data from the Events widget Double-click a bar in the Events widget to navigate to an event custom report (HTML) that displays the events corresponding to the event type selected. For information about report details, refer to “Fault Management” on page 973.
Dashboard widgets 8 Customizing the Host Adapter Inventory widget You can customize the Host Adapter Inventory widget to display product inventory for a specific grouping. The group type and number of products in the group displays to the left of the associated bar; for example, 2.3.0.005 [3], where 2.3.0.005 is the driver number and [3] is the number of products running that driver level.
8 Dashboard widgets SAN Inventory widget The SAN Inventory widget (Figure 63) displays the SAN products inventory as stacked bar graphs. FIGURE 63 SAN Inventory widget The SAN Inventory widget includes the following data: • Severity icon/product count/widget title — The color of the worst severity followed by the number of products with that severity displays before to the widget title. • Group By list — Use to customize this widget to display a specific group of products.
Dashboard widgets 8 • Change the grouping by selecting one of the following from the Group By list: - Firmware — The product inventory by firmware release. - Model — The product inventory by model. - Location — The product inventory by physical location. - Contact — The product inventory by contact name. • Zoom in on an area of the widget by dragging the mouse (upper left corner to lower right corner) to select one or more bars.
8 Dashboard widgets • Pie chart — The device status as a percentage of the total number of devices. The pie chart displays the percentage in various colors on each slice. Tooltips showing the number of devices in that state are shown when you pause on the slice. When there is one status category with less than one percent of the total number of devices, the status widget displays the number of devices in each category on each slice.
Dashboard widgets 8 Status widget The Status widget (Figure 65) displays the number of products managed and the number of events within the selected event time range. FIGURE 65 Status widget The Status widget displays the following items for each product license: • • • • Fibre Channel Fabrics — The number of managed fabrics. SAN Switches — The number of managed SAN switches. Hosts — The number of managed hosts. Events — The number of events within the last hour.
8 Performance Dashboard monitors Customizing the VM Alarms widget You can customize the VM Alarms widget to display data for a specific fabric and duration. • Display data by fabric by selecting the fabric you want to monitor from the Show list. Select All Fabrics to include all managed and monitored fabrics in your AOR. The default is All Fabrics. If the fabric you select is deleted from discovery, the widget refreshes and returns to the default (All Fabrics).
Performance Dashboard monitors 8 • Top Port Encode Error Out — Table view of the encode error out measure (All SAN FC port collector) • • • • Top Port Errors — Table view of the errors measure (port error count collector) Top Port Link Failures — Table view of the top port link failues (All SAN FC port collector) Top Port Link Resets — Table view of the top port link resets (All SAN FC port collector) Top Port Sync Losses — Table view of the top port synchronization failures (All SAN FC port collector)
8 Performance Dashboard monitors Top Port C3 Discards monitor The Top Port C3 Discards monitor (Figure 66) displays the top ports with Class 3 frames discarded in a table. FIGURE 66 Top Port C3 Discards monitor The Top Port C3 Discards monitor includes the following data: • • • • • • • • • • Severity icon/monitor title— The worst severity of the data shown next to the monitor title. Port — The port affected by this monitor. C3 Discards/sec — The top ports with Class 3 frames discarded in seconds.
Performance Dashboard monitors 8 Top Port C3 Discards RX TO monitor The Top Port C3 Discards RX TO monitor (Figure 67) displays the top ports with receive Class 3 frames received at this port and discarded at the transmission port due to timeout in a table. FIGURE 67 Top Port C3 Discards RX TO monitor The Top Port C3 Discards RX TO monitor includes the following data: • Severity icon/monitor title— The worst severity of the data shown next to the monitor title.
8 Performance Dashboard monitors • Double-click a row to navigate to the SAN Historical Graphs/Tables dialog box. For more information, refer to “Performance Data” on page 895. Top Port CRC Errors monitor The Top Port CRC Errors monitor (Figure 68) displays the top ports with frames that contain cyclic redundancy check (CRC) errors in a table.
Performance Dashboard monitors 8 • Double-click a row to navigate to the SAN Historical Graphs/Tables dialog box. For more information, refer to “Performance Data” on page 895. Top Port Encode Error Out monitor The Top Port Encode Error Out monitor (Figure 69) displays the top ports with encoding errors outside of frames in a table.
8 Performance Dashboard monitors • Double-click a row to navigate to the SAN Historical Graphs/Tables dialog box. For more information, refer to “Performance Data” on page 895. Top Port Errors monitor The Top Port Errors monitor (Figure 70) displays the top ports with receive and transmit errors in a table.
Performance Dashboard monitors 8 • Double-click a row to navigate to the Historical Graphs/Tables dialog box. For more information, refer to “Performance Data” on page 895. Top Port Link Failures monitor The Top Port Link Failures monitor (Figure 71) displays the top ports with link failures in a table.
8 Performance Dashboard monitors • Double-click a row to navigate to the SAN Historical Graphs/Tables dialog box. For more information, refer to “Performance Data” on page 895. Top Port Link Resets monitor The Top Port Link Resets monitor (Figure 72) displays the top ports with link resets in a table.
Performance Dashboard monitors 8 • Double-click a row to navigate to the SAN Historical Graphs/Tables dialog box. For more information, refer to “Performance Data” on page 895. Top Port Sync Losses monitor The Top Port Sync Losses monitor (Figure 72) displays the top ports with synchronization failures in a table.
8 Performance Dashboard monitors • Double-click a row to navigate to the SAN Historical Graphs/Tables dialog box. For more information, refer to “Performance Data” on page 895. Top Port Traffic monitor The Top Port Traffic monitor (Figure 74) displays the top ports with receive and transmit traffic in a table.
Performance Dashboard monitors 8 • Double-click a row to navigate to the Historical Graphs/Tables dialog box. For more information, refer to “Performance Data” on page 895. Top Port Utilization Percentage monitor The Top Port Utilization monitor (Figure 75) displays the top port utilization percentages in a table.
8 Performance Dashboard monitors Top Product CPU Utilization monitor The Top Product CPU Utilization monitor (Figure 76) displays the top product CPU utilization percentages in a table. FIGURE 76 Top Product CPU Utilization monitor The Top Product CPU Utilization monitor includes the following data: • • • • • • • • • • • • • • • • • Severity icon/monitor title — The worst severity of the data shown next to the monitor title. Product — The product affected by this monitor.
Performance Dashboard monitors 8 Accessing additional data from the Top Product CPU Utilization monitor • Right-click a row in the monitor to access the shortcut menu available for the associated device. For more information about shortcut menus, refer to “Application menus” on page 1061. • Double-click a row to navigate to the IP Historical Graphs/Tables dialog box. For more information, refer to “Performance Data” on page 895.
8 Performance Dashboard monitors • Location — The location of the product. • Contact — A contact name for the product. • Refreshed — The refresh time and selected time range for the monitor. To customize the monitor to display data by a selected time frame as well as customize the display options, refer to “Editing a preconfigured performance monitor” on page 220.
Performance Dashboard monitors • • • • • • • • • 8 Status — The product status (for example, Reachable). Tag — The product tag. Serial # — The serial number of the product. Model — The product model. Port Count — The number of ports on the product. Firmware — The firmware level running on the product. Location — The location of the product. Contact — A contact name for the product. Refreshed — The refresh time and selected time range for the monitor.
8 Performance Dashboard monitors • • • • • • • • • • • • • • Temperature — The top temperatures. Max — The maximum value of the measure in the specified time range. Fabric — The fabric to which the device belongs. Product Type — The type of product (for example, switch). State — The product state (for example, Offline). Status — The product status (for example, Reachable). Tag — The product tag. Serial # — The serial number of the product. Model — The product model.
Performance Dashboard monitors 8 • Last 12 Hours — Displays data for the previous 12 hours beginning when you launch the dashboard. • Last 24 Hours — Displays data for the previous 24 hours beginning when you launch the dashboard. 3. (Top or Bottom performance monitors only) Select the number of products to include in a selected measure by entering a number in the For Top N, Bottom N Monitors, N= field. Valid values are from 1 through 25. The default is 10. 4.
8 User-defined performance monitors User-defined performance monitors The Performance Dashboard makes it easy for you to customize performance monitors specific to your needs. You can define up to 100 performance monitors; however, you can only display up to 30 performance monitors at a time. Top or bottom product performance monitors The top or bottom product performance monitors (Figure 80) display the top or bottom number of products (for example, top 10 products) for the selected measure in a table.
User-defined performance monitors • • • • • 8 Port Count — The number of ports on the product. Firmware — The firmware level running on the product. Location — The location of the product. Contact — A contact name for the product. Refreshed — The refresh time and selected time range for the monitor. To configure a product performance monitor, refer to “Configuring a user-defined product performance monitor” on page 227.
8 User-defined performance monitors • Measure_Type — The percentage bar of the selected measure. Depending on the selected measure, more than one Measure_Type may display. By default, ports display sorted by the Measure_Type value (Top ports sort from highest to lowest and bottom ports sort lowest to highest). Click a column head to sort the columns by that value. • • • • • • • Product — The product affected by this monitor. Type — The type of port (for example, U-Port).
User-defined performance monitors 8 The distribution performance monitor includes the following data: • Monitor title — The user-defined monitor title. • Number of Products/Ports (y-axis) — The y-axis always displays a numbered range (zero to the maximum number of objects) for the products or ports affected by the selected measure. • Measure_Type (x-axis) — The x-axis display depends on the Measure_Type you selected for this monitor.
8 User-defined performance monitors Accessing additional data from the Distribution monitors • Place the cursor on a bar in the graph to display the number of products included in the count for the selected bar. For example, the tooltip “(Data Item 3, 22.6-33.8) = 6” means that there are six products within the third percentage range (displays the temperatures within the percentage range) for the selected measure (product temperature).
User-defined performance monitors 8 Configuring a user-defined product performance monitor 1. Select Monitor > Performance > Dashboard. The Performance Dashboard displays in a new window. 2. Click the Customize Dashboard icon. The Customize Dashboard dialog box displays. 3. Click the Performance tab. 4. Click Add. The Add Performance Dashboard Monitor dialog box displays. 5. Enter a unique title for the monitor. The title can be up to 256 characters in length. 6.
8 User-defined performance monitors • Last 12 Hours — Displays data for the previous 12 hours beginning when you launch the dashboard. • Last 24 Hours — Displays data for the previous 24 hours beginning when you launch the dashboard. 9. (Top N and Bottom N monitors only) Select the number products to include in a selected measure by entering a number in the For Top N, Bottom N Monitors, N= field. Valid values are from 1 through 25. The default is 10. 10.
User-defined performance monitors 8 13. (Time series monitors only) Remove targets from the monitor by selecting one or more targets in the Targets list and clicking Remove. 14. Click OK on the Add Performance Dashboard Monitor dialog box. The Customize Dashboard dialog box displays with the new monitor in the Performance Monitors list. 15. Click OK on the Customize Dashboard dialog box. The Performance Dashboard dialog box displays with the new monitors at the bottom of the dashboard.
8 User-defined performance monitors 9. Click the SAN tab. 10. Select SAN targets from the Available SAN Sources list. 11. Click the right arrow button to move the targets to the Selected Sources list. 12. Select FCIP targets from the Available list. 13. Click the right arrow button to move the targets to the Selected Sources list. 14. Click OK on the Performance Dashboard Monitor Targets dialog box. The targets display in the Targets list of the Add Performance Dashboard Monitor dialog box. 15.
User-defined performance monitors 8 6. Select the port measure for the monitor in the Measure area: Common • Port Utilization Percentage • Traffic • CRC Errors FC • Link Resets • Signal Losses • Sync Losses • Link Failures • Sequence Errors • Invalid Transmissions • C3 Discards • C3 Discards TX TO • C3 Discards RX TO • C3 Discards Unreachable • C3 Discards Other • Encode Error Out • SFP Power • SFP Voltage • SFP Current • SFP Temperature 7.
8 User-defined performance monitors 9. (Top N, Bottom N, and Distribution monitors only) Configure the monitor to show only values greater than or less than a specified value by completing the following steps. a. Select the Show values check box. b. Select greater than or less than from the list. c. Enter a value in the field. 10. (Time series monitors only) Add targets for the monitor by clicking Add and completing the steps in “Adding targets to a user-defined performance monitor” on page 229. 11.
User-defined performance monitors 8 • Measure_Type — This column depends on which measure you select for the monitor. Memory Utilization Percentage — The memory utilization percentage for the product. CPU Utilization Percentage — The CPU utilization percentage for the product. Temperature — The temperature in Celsius for the product. Fan Speed — The fan speed in RPM for the product. Response Time — The response time in seconds for the product.
8 User-defined performance monitors - Signal Losses — The number of signal failures. - C3 Discards RX TO — The number of received class 3 frames discarded due to timeout. - C3 Discards Unreachable — The number of class 3 frames discarded due to unreachable destination. - C3 Discards Other — The number of class 3 frames discarded due to other reasons. - Encode Error Out — The number of encode errors outside of the frame. 234 Sequence Errors — The number of sequence errors.
User-defined performance monitors • • • • • • 8 MAC Errors — The number of MAC errors. Back Packets Received — The number of bad packets received. Tx Errors — The number of transmit errors. Product — The product affected by this monitor. Type — The type of port (for example, U-Port). Identifier — The port identifier. Port Number— The port number. State — The port state (for example, Enabled). Status — The port status (for example, Up). 3. Click Close.
8 236 User-defined performance monitors Brocade Network Advisor SAN User Manual 53-1002696-01
Chapter 9 View Management In this chapter • SAN tab overview. . . . . . . . . . . . . . . . . . . . . . . . . . . . . . . . . . . . . . . . . . . . . . • Icon legend. . . . . . . . . . . . . . . . . . . . . . . . . . . . . . . . . . . . . . . . . . . . . . . . . . . • Customizing the main window . . . . . . . . . . . . . . . . . . . . . . . . . . . . . . . . . . . • SAN Product List customization . . . . . . . . . . . . . . . . . . . . . . . . . . . . . . . . . . • Search . . . . . . . . . . . . . . . .
9 SAN tab overview 4 6 1 2 3 5 7 8 9 11 10 12 13 FIGURE 84 Main window - SAN tab 1. Menu bar — Lists commands you can perform on the SAN tab. Some menu items display as disabled unless you select the correct object from the product list or topology map. For a list of the many functions available on each menu, refer to “SAN main menus” on page 1062. 2. SAN main toolbar — Provides buttons that enable quick access to dialog boxes and functions.
SAN tab overview 9 9. Connectivity Map — Displays the topology, including discovered and monitored devices and connections. For more information, refer to “Connectivity Map” on page 243. 10. Master Log — Displays all events that have occurred on the Management application. For more information, refer to “Master Log” on page 245. 11. Utilization Legend — (Trial and Licensed version only) Indicates the percentage ranges represented by the colored, dashed lines on the Connectivity Map.
9 SAN tab overview View All list The View All list is located at the top left side of the window and enables you to create, copy, or edit a view, select to how to view the Product list (All Levels, Products and Ports, Products Only, or Ports Only) and to select which view you want to display in the main window. Does not display until you discover a fabric. To discover a fabric, refer to “Discovering fabrics” on page 41. 1 2 3 4 5 6 1. Create View — Select to create a new view. 2.
SAN tab overview 9 Port Display buttons The Port Display buttons are located at the top right of the Product List and enable you to configure how ports display. You have the option of viewing connected (or occupied) product ports, unoccupied product ports, or attached ports. Not enabled until you discover a fabric or host. NOTE Occupied/connected ports are those that originate from a device, such as a switch. Attached ports are ports of the target devices that are connected to the originating device.
9 SAN tab overview Product List The Product List, located on the SAN tab, displays an inventory of all discovered devices and ports. The Product List is a quick way to look up product and port information, including serial numbers and IP addresses. To display the Product List, select View > Show Panels > Product List or press F9. You can edit information in the Product List by double-clicking in a field marked with a green triangle. You can sort the Product List by clicking a column heading.
SAN tab overview • • • • • 9 Symbolic Name — Displays the symbolic name for the port. TAG — Displays the tag number of the product. Vendor — Displays the name of the product’s vendor. WWN — Displays the world wide name of the product or port. Zone Alias — Displays the zone alias of the product or port. Product List functions • Customize — Customize the Product list. For more information, refer to “SAN Product List customization” on page 257. • Sort — Click a column head to sort the list.
9 SAN tab overview Connectivity Map functions • Two-way selection — When you select an icon on the Topology Map, that device is highlighted in the Product List and vice versa. • • • • Device double-click — Double-click a device to launch Web Tools for the selected device. Zoom In/Zoom Out — Click the appropriate button to zoom in or out on the Topology Map. Tool tips — Mouse over a device or connection to view information. Right-click menus — Right-click a device to view the menu.
SAN tab overview 9 Master Log The Master Log, which displays in the lower left area of the main window, lists the events and alerts that have occurred on the SAN. If you do not see the Master Log, select View > Show Panels > All Panels or press F5. You can sort the Master Log by clicking a column heading. By default, the Master Log is sorted by the Last Event Server Time column. To filter information in the Master Log, refer to “Filtering events in the Master Log” on page 1037.
9 SAN tab overview Minimap The Minimap, which displays in the lower right corner of the main window, is useful for getting a bird’s-eye view of the topology, or to quickly jump to a specific place on the topology. To jump to a specific location on the topology, click that area on the Minimap. A close-up view of the selected location displays on the topology. Use the Minimap to view the entire topology and to navigate more detailed map views. This feature is especially useful if you have a large topology.
SAN tab overview 9 Status bar The status bar displays at the bottom of the main window. The status bar provides a variety of information about the SAN and the application. The icons on the status bar change to reflect different information, such as the current status of products, fabrics, and backup. FIGURE 91 Status Bar The icons on your status bar will vary based on the licensed features on your system. 1. Connection Status — Displays the Server-Client connection status.
9 Icon legend 10. Call-Home Status — (Trial and Licensed version only) Displays a call home status icon when one or more product are discovered, which allows you to determine the current call home status. Click to launch the Call Home Notification dialog box. For more information about Call Home status and icons, refer to “Viewing Call Home status” on page 182. 11. Server Name — Displays the name of the Server to which you are connected. Click to launch the Server Properties dialog box.
Icon legend 9 Host product icons The following table lists the manageable Host product icons that display on the topology. Fabric OS manageable devices display with blue icons. Unmanageable devices display with gray icons. Some of the icons shown only display when certain features are licensed.
9 Icon legend Host group icons The following table lists the manageable Host product group icons that display on the topology. TABLE 33 Icon Description Icon Description Host Group SAN port icons The following table lists the port icons that display in the Product List.
Icon legend 9 TABLE 35 Icon Status Down/Failed Routed In Routed Out Unknown/Link Down Unreachable Event icons The following table lists the event icons that display on the topology and Master Log. For more information about events, refer to “Fault Management” on page 973.
9 Customizing the main window Customizing the main window You can customize the main window to display only the data you need by displaying different levels of detail on the Connectivity Map (topology) or Product List. Zooming in and out of the Connectivity Map You can zoom in or out of the Connectivity Map to see products and ports. Zooming in To zoom in on the Connectivity Map, use one of the following methods: • Click the zoom-in icon ( ) on the Connectivity Map toolbar.
Customizing the main window 9 Showing levels of detail on the Connectivity Map You can configure different levels of detail on the Connectivity Map, making device management easier. Viewing fabrics To view only fabrics, without seeing groups, products, or ports, select View > Show> Fabrics Only. Viewing groups To view only groups and fabrics, without seeing products, or ports, select View > Show> Groups Only. Viewing products To view products, groups, and fabrics, select View > Show> All Products.
9 Customizing the main window • • • • Export information from the table Search for information Expand the table to view all information Collapse the table Displaying columns To only display specific columns, complete the following steps. 1. Right-click anywhere in the table and select Customize or Table > Customize. The Customize Columns dialog box displays. FIGURE 93 Customize Columns dialog box 2. Choose from the following options: • Select the check box to display a column.
Customizing the main window 9 Changing the order of columns To change the order in which columns display, choose from one of the following options. Rearrange columns in a table by dragging and dropping the column to a new location. OR 1. Right-click anywhere in the table and select Customize or Table > Customize. The Customize Columns dialog box displays. 2. Select the name of the column you want to move and use the Move Up button and Move Down button to move it to a new location. 3. Click OK.
9 Customizing the main window Exporting table information You can export the entire table or a specific row to a text file. 1. Choose from one of the following options: • Right-click anywhere in the table and select Table > Export Table. • Select the table row that you want to export and select Table > Export Row. The Save table to a tab delimited file dialog box displays. 2. Browse to the location where you want to save the file. 3. Enter the file name in the File Name field. 4. Click Save.
SAN Product List customization 9 SAN Product List customization You can customize the Product List on the SAN tab to display only the data you need by adding, editing, and deleting property labels. You can also edit property fields to change information. Adding a property label You can add a new column to the Product List. To add a new field, complete the following steps. 1. Right-click any column heading on the Product List and select Add Column. The Add Property dialog box displays. 2.
9 Search Search You can search for a objects by text or regular expression. • Text—Enter a text string in the search text box. This search is case sensitive. For example, if you are searching for a device in the Product List, you can enter the first five characters in a device name. All products in the Product List that contain the search text display highlighted. • Regular Expression—Enter a Unicode regular expression in the search text box. (For hints, refer to “Regular Expressions” on page 1133.
Search 9 2. Choose one of the following options: • Select Text from the search list and enter a text string in the search text box. This search is case sensitive. • Select Regular Expression from the search list and enter a Unicode regular expression in the search text box. This search is case insensitive 3. Press Enter or click the search icon. The search results display highlighted.
9 SAN view management overview 2. Enter your search criteria in the search field. • Text—Enter a text string in the search text box. This search is case sensitive. For example, you can enter the first five characters in a device name. All products in the Product List that contain the search text display highlighted. • Regular Expression—Enter a Unicode regular expression in the search text box. (For hints, refer to “Regular Expressions” on page 1133.
SAN view management overview 9 1. Select View > Manage View > Create View. The Create View dialog box displays. FIGURE 95 Create View dialog box - Fabrics tab 2. Enter a name (128-character maximum) in the Name field and a description (126-character maximum) in the Description field for the view. NOTE You cannot use the name “View” or “View All” in the Name field. NOTE You cannot use an existing name in the Name field. 3. Click the Fabrics tab. 4.
9 SAN view management overview 6. In the Available Hosts table, select the hosts you want to include in the view and click the right arrow button to move your selections to the Selected Fabrics and Hosts table. The Available Hosts table displays the name, IP address, network address of the available hosts and the fabric in which the host is located. If this table is blank, it may be because all hosts have been selected and are displayed in the Selected Fabrics and Hosts table.
SAN view management overview FIGURE 98 9 Edit View dialog box - Hosts tab 5. In the Available Hosts table, select the fabrics you want to include in the view and use the right arrow button to move your selections to the Selected Fabrics and Hosts table. The Available Hosts table displays the name, IP address, network address of the available hosts and the fabric in which the host is located.
9 SAN view management overview Copying a view To copy a customized view, use the following procedure. 1. Use one of the following methods to open the Copy View dialog box: • Select View > Manage View > Copy View > View_Name. • Select Copy View from the View All list. The View All list does not display until you discover a fabric or host. The Copy View dialog box displays the name of the view you are copying. FIGURE 99 Copy View dialog box 2.
SAN topology layout 7. 9 Click OK to save your changes and close the Copy View dialog box. NOTE When you open a new view, the SAN tab displays with a gray screen over the Product List and Topology Map while data is loading. 8. Verify that the copied view displays on the main window of the Management application.
9 SAN topology layout • Port Display. Select to configure how ports display. - Occupied Product Ports. Select to display the ports of the devices in the fabrics (present in the Connectivity Map) that are connected to other devices. - UnOccupied Product Ports. Select to display the ports of the devices (shown in the Connectivity Map) that are not connected to any other device. - Attached Ports. Select to display the attached ports of the target devices. Switch to Switch Connections.
SAN topology layout 9 • Square. Select to display the device icons in a square configuration. Default for Host and Storage groups. • Vertical. Select to display the device icons vertically. • Horizontal. Select to display the device icons horizontally. • Most Connected at Center. Select to display the node that has the most connections at the center of the topology. • Directional. Select to display the internal nodes in a position where they mirror the external groups to which they are connected. 3.
9 SAN topology layout FIGURE 101 Choose a background color dialog box 3. Select a color from the swatches tab and click OK. • To specify a color based on hue, saturation, and value, click the HSV tab. Specify the hue (0 to 359 degrees), saturation (0 to 100%), value (0 to 100%), and transparency (0 to 100%). • To specify a color based on hue, saturation, and lightness, click the HSL tab. Specify the hue (0 to 360 degrees), saturation (0 to 100%), lightness (0 to 100%), and transparency (0 to 100%).
SAN topology layout 9 Changing the product label To change the product label, complete the following steps. 1. Select a product in the Connectivity Map or Product List. 2. Select View > Product Label, and select one of the following options: • • • • • Name (Product). Displays the product name as the product label. WWN. Displays the world wide name as the product label. IP Address. Displays the IP address as the product label. Domain ID. Displays the domain ID as the product label. Zone Alias.
9 Grouping on the topology 2. Repeat step 1 to select more than one port display option. Grouping on the topology To simplify management, devices display in groups. Groups are shown with background shading and are labeled appropriately. You can expand and collapse groups to easily view a large topology. Collapsing groups To collapse a single group on the topology, choose one of the following options: • Click the icon at the top right-hand corner of the group on the topology ( ).
Grouping on the topology 9 Configuring custom connections NOTE Active zones must be available on the fabric. To create a display of the connected end devices participating in a single zone or group of zones, complete the following steps. 1. Select a fabric on the topology and select View > Connected End Devices > Custom. The Connected End Devices - Custom display for Fabric dialog box displays with a list of devices participating in a single zone or a group of zones in the Zones in Fabric list. 2.
9 272 Grouping on the topology Brocade Network Advisor SAN User Manual 53-1002696-01
Chapter 10 Third-party tools In this chapter • About third-party tools . . . . . . . . . . . . . . . . . . . . . . . . . . . . . . . . . . . . . . . . . . • Starting third-party tools from the application . . . . . . . . . . . . . . . . . . . . . . • Launching a Telnet session . . . . . . . . . . . . . . . . . . . . . . . . . . . . . . . . . . . . . • Launching an Element Manager . . . . . . . . . . . . . . . . . . . . . . . . . . . . . . . . . • Launching Web Tools. . . . . . . . . . . . . . . . . . . .
10 Starting third-party tools from the application Starting third-party tools from the application You can open third-party tools from the Tools menu or a device’s shortcut menu. Remember that you cannot open a tool that is not installed on your computer. You must install the tool on your computer and add the tool to the Tools menu or the device’s shortcut menu. NOTE Installing tools is only available with the Trial and Licensed version versions. To open an application, complete the following steps. 1.
Launching an Element Manager 10 Launching an Element Manager Element Managers are used to manage Fibre Channel switches and directors. You can open a device’s Element Manager directly from the application. To launch a device’s Element Manager, complete the following steps. On the Connectivity Map, double-click the device you want to manage. The Element Manager displays. OR On the Connectivity Map, right-click the device you want to manage and select Element Manager > Hardware.
10 Launching FCR configuration OR 1. Select a Fabric OS device. 2. Select Configure > Element Manager > Hardware. Web Tools displays. OR 1. Select a Fabric OS device. 2. Click the Element Manager icon on the toolbar. Web Tools displays. NOTE When you close the Management application client, any Web Tools instance launched from the clients closes as well.
Launching Name Server 10 1. Select a Fabric OS device. 2. Select Configure > Element Manager > Router Admin. The FC Routing module displays. NOTE When you close the Management application client, any Web Tools instance launched from the clients closes as well. Launching Name Server Use Name Server to view entries in the Simple Name Server database. You can open the Name Server module directly from the Management application.
10 Launching HCM Agent Launching HCM Agent Use Fabric OS HCM Agent to enable and manage Fabric OS HBAs. You can open HCM Agent directly from the application. For more information about HCM Agent, refer to the HCM Agent Administrator’s Guide. For more information about Fabric OS HBAs, refer to the documentation for the specific device. To launch a Fabric OS HBA’s Element Manager, complete the following steps.
Adding a tool 10 OR 1. Select a Fabric OS device. 2. Select Monitor > Fabric Watch > Configure. Fabric Watch displays. Adding a tool You can specify third-party tools so they appear on the Setup Tools dialog box. From there, you can add them to the Tools menu and then open the tools directly from the Management application. To add a tool, complete the following steps. 1. Select Tools > Setup. The Setup Tools dialog box displays. 2. Click the Tools Menu tab. 3. Click Define.
10 Entering the server IP address of a tool Entering the server IP address of a tool If the third-party tool is a web-based application, you must enter the IP address of the applications server as a parameter to be able to open the application. To enter the server IP address, complete the following steps. 1. Select Tools > Setup. The Setup Tools dialog box displays. 2. Click the Tools Menu tab.
Adding an option to the Tools menu 10 FIGURE 103 Setup Tools dialog box (Tools menu tab) 3. Type a label for the option as you want it to appear on the Tools menu in the Menu Text field. 4. Select the application from the Tool list, or click Define if you want to specify a new tool. To specify a new tool, refer to “Adding a tool” on page 279. 5. (Optional) Enter parameters, such as a URL, in the Parameters field. 6. (Optional) Select a keyboard shortcut in the Keystroke list.
10 Changing an option on the Tools menu Changing an option on the Tools menu You can edit parameters for third-party tools that display on the Tools menu. To edit a option to the tools menu, complete the following steps. 1. Select Tools > Setup. The Setup Tools dialog box displays. 2. Click the Tools Menu tab. The Tool Menu Items table displays all configured tools, including the tool name as it displays on the Tools menu, parameters, and keystroke shortcuts. 3.
Adding an option to a device’s shortcut menu 10 Adding an option to a device’s shortcut menu You can add an option to a device’s shortcut menu. To add an option to the device’s shortcut menu, complete the following steps. 1. Select Tools > Setup. The Setup Tools dialog box displays. 2. Click the Product Menu tab. The Product Popup Menu Items table displays all configured shortcut menu options. 3. Type or select the text in the Menu Text list as you want it to appear on the menu. 4.
10 Changing an option on a device’s shortcut menu Changing an option on a device’s shortcut menu You can change the parameters for a tool that displays on a device’s shortcut menu. To edit an option to the device’s shortcut menu, complete the following steps. 1. Select Tools > Setup. The Setup Tools dialog box displays. 2. Click the Product Menu tab. The Product Popup Menu Items table displays all configured shortcut menu options. 3.
Removing an option from a device’s shortcut menu 10 Removing an option from a device’s shortcut menu You can remove a tool that displays on a device’s shortcut menu. To remove an option to the device’s shortcut menu, complete the following steps. 1. Select Tools > Setup. The Setup Tools dialog box displays. 2. Click the Product Menu tab. The Product Popup Menu Items table displays all configured menu options. 3. Select the menu item you want to remove in the Product Popup Menu Items table. 4.
10 Microsoft System Center Operations Manager (SCOM) plug-in SCOM plug-in requirements • Make sure you import the Management application management pack (Management_Application_Name.FabricView.xml) to the SCOM Server prior to registering the SCOM Plug-in. The management pack is located in the following directory on the DVD scom/OEM_Name. • Make sure the Management application server host is managed by the SCOM Server in agent managed mode.
Microsoft System Center Operations Manager (SCOM) plug-in 10 3. Edit the domain name in the Domain field. 4. Enter your user ID and password. 5. Click OK. 6. Click Close. Removing a SCOM server To configure the SCOM plug-in, complete the following steps. 1. Select Tools > Plug-in for SCOM. The Plug-in for SCOM dialog box displays. 2. Select the SCOM server you want to delete in the SCOM Servers table. 3. Click Remove. 4. Click OK on the confirmation message. 5. Click Close.
10 288 Microsoft System Center Operations Manager (SCOM) plug-in Brocade Network Advisor SAN User Manual 53-1002696-01
Chapter 11 Server Management Console In this chapter • Server Management Console overview . . . . . . . . . . . . . . . . . . . . . . . . . . . . • Services tab . . . . . . . . . . . . . . . . . . . . . . . . . . . . . . . . . . . . . . . . . . . . . . . . . . • Ports tab. . . . . . . . . . . . . . . . . . . . . . . . . . . . . . . . . . . . . . . . . . . . . . . . . . . . . • AAA Settings tab . . . . . . . . . . . . . . . . . . . . . . . . . . . . . . . . . . . . . . . . . . . . . . • Restore tab. . . .
11 Services tab Launching the SMC on Linux NOTE The Server Management Console is a graphical user interface and should be launched from the XConsole on Linux systems. Perform the following steps to launch the Server Management Console on Linux systems. 1. On the Management application server, go to the following directory: Install_Directory/bin 2. Type the following at the command line: .
Services tab 11 3. Review the following information for each available service. • • • • Name—The name of the server; for example, FTP Server or Database Server. Process Name—The name of the process; for example, postgres.exe (Database Server). Status—The status of the service; for example, started or stopped. Start Time—The date and time the service started. The Start Time for Service Location Protocol displays as ‘Not Available’. 4. Click Close to close the Server Management Console.
11 Services tab Starting all services NOTE The Start button restarts running services in addition to starting stopped services which causes client-server disconnect. To start all services, complete the following steps. 1. Launch the Server Management Console. 2. Click the Services tab. 3. Click Start to start all services. NOTE If the server is configured to use an external FTP server, the Server Management Console does not attempt to start the built-in FTP service. 4.
Ports tab 11 6. Select the database user name for which you want to change the password in the User Name field. Options include dcmadmin and dcmuser. Changing the dcmadmin password requires all Management application services, except for the database server, to be stopped and then re-started. Changing the dcmuser password requires all ODBC remote client sessions to be restarted. 7. Enter your current password in the Old Password field. 8.
11 AAA Settings tab AAA Settings tab Authentication enables you to configure an authentication server and establish authentication policies. You can configure the Management application to authenticate users against the local database (Management application server), an external server (RADIUS, LDAP, or TACACS+), or a switch. Authentication is configured to the local database by default.
AAA Settings tab 11 1. Select the AAA Settings tab (Figure 105). FIGURE 105 AAA Settings tab 2. Select Radius Server from the Primary Authentication list. 3. Add or edit a Radius server by referring to “Configuring a Radius server” on page 296. 4. Rearrange the Radius servers in the table by selecting a server and click the Up or Down button to move it. 5. Delete a Radius server by selecting the server and click Delete. 6. Test the established active connection with the Radius server by clicking Test.
11 AAA Settings tab Configuring a Radius server To add or edit a Radius server, complete the following steps. 1. Choose one of the following options from the AAA Settings tab: • Click Add. • Select an existing Radius server and click Edit. The Add or Edit Radius Server dialog box displays (Figure 106). FIGURE 106 Add or Edit Radius Server 2. Enter the radius server’s IP address in the IP Address field. 3. Enter the TCP port, if necessary, used by the Radius server in the TCP Port field. Default is 1812.
AAA Settings tab 11 Configuring LDAP server authentication NOTE You cannot configure multiple Active Directory groups (domains) for the LDAP server. NOTE You cannot enter Domain\User_Name in the Management application dialog box for LDAP server authentication. If you are using an LDAP server for authentication, make the following preparations first: • Make sure that the LDAP server you want to use is on the network that the Management application manages. • Have the IP address of the server available.
11 AAA Settings tab FIGURE 107 AAA Settings tab - LDAP server If you configure the external LDAP server as the primary authentication server, make the following preparations first: • Make sure that the external LDAP server and its user accounts have been properly configured (refer to “Creating an AD user account” on page 159). For example, you must define roles and areas of responsibility (AOR) in the external server to match the Management application roles and AOR.
AAA Settings tab 7. 11 Enter your user name and password and click OK. Test attempts to contact the LDAP server by issuing a ping command and verifies the following: • Verifies connections to the LDAP Server • Verifies authentication with the LDAP Server • Verifies user privileges on the Local database 8. Set secondary authentication by selecting one of the following options from the Secondary Authentication list: • Local Database • None 9.
11 AAA Settings tab Configuring an LDAP server To add or edit a LDAP server, complete the following steps. 1. Select the AAA Settings tab. 2. Select LDAP Server from the Primary Authentication list. 3. Choose one of the following options: • Click Add. • Select an existing LDAP server and click Edit. The Add or Edit LDAP Server dialog box displays (Figure 108). FIGURE 108 Add or Edit LDAP server 4. Enter the LDAP server’s hostname in the Network address field.
AAA Settings tab 11 Configuring TACACS+ server authentication If you are using a TACACS+ server for authentication, make the following preparations first: • Make sure that the server you want to use is on the network that the Management application manages. • Make sure that the external server and its user accounts have been properly configured. For example, you must define roles and areas of responsibility (AOR) in the external server to match the Management application roles and AOR.
11 AAA Settings tab 9. Set the fall back condition to secondary authentication by selecting one of the following options from the Fail Over Option list: • TACACS+ Server Not Reachable • TACACS+ Server Authentication Failed 10. Set the authorization preference by selecting one of the following options from the Authorization Preference list: • Local Database • Primary Authentication Server 11. Click Apply to save the configuration.
AAA Settings tab 11 6. Enter the number of attempts to be made to reach a server before assuming it is unreachable in the Attempts field. Default is 3 attempts. 7. Click OK to return to the AAA Settings tab. The Radius Servers and Sequence table displays the following information: • Network Address—The network address of the TACACS+ server. • TCP Port—The TCP port number of the LDAP server. • TimeOut (Sec)—The timeout value in seconds specified when sending an authentication request to the server.
11 AAA Settings tab 11. Click Close to close the Server Management Console. Configuring Windows authentication Windows authentication enables you to authenticate a user account against the Windows user accounts and the Management application server when running on Windows hosts.
Restore tab 11 3. Click Test. The Test Authentication dialog box displays. 4. Enter your user ID and password and click Test. Test verifies your user ID and password for the local database and verifies user privileges on the Management application server. 5. Click Apply to save the configuration. To display the authentication audit trail, refer to “Displaying the client authentication audit trail” on page 305. 6. Click Close to close the Server Management Console.
11 Restore tab NOTE You cannot restore data from a higher or lower configuration (Trial or Licensed version) of the Management application. NOTE You cannot restore data from a different package of the Management application. To restore the application data files, complete the following steps. 1. Click the Services tab. 2. Stop all services. 3. Click the Restore tab (Figure 111). FIGURE 111 Restore tab 4.
Technical Support Information tab 11 Technical Support Information tab The Technical Support Information tab of the SMC allows you to capture technical support information for the Management application as well as the configuration files for all switches in discovered fabrics. This information is saved in a zip file in a location that you specify. Capturing technical support information To capture technical support information, complete the following steps. 1.
11 HCM Upgrade tab NOTE For Linux systems, you cannot have blank spaces in the output path (target directory). If the output path contains blank spaces, the supportShow files are not complete. 4. Click Capture. A confirmation message displays when the capture is complete. 5. Click OK. HCM Upgrade tab The HCM Upgrade tab enables you to upgrade the Management application to include a new version of HCM. Upgrading HCM on the Management server To upgrade HCM, complete the following steps. 1.
Performance Data Aging tab 11 Performance Data Aging tab Performance data samples are collected at regular intervals. The Performance Data Aging tab enables you to define the performance data collection interval for product and port measures. NOTE Changes to the performance data aging option requires a server restart. NOTE You can only restart the server using the Server Management Console (Start > Programs > Management_Application_Name 12.X.X > Server Management Console).
11 SMI Agent Configuration Tool • Option 2—2 years data with the following samples Raw samples for the last 8 days 1 day granularity for last 2 years (730 samples) If you change from Option 2 to Option 1, you will lose existing performance data for the 5 minutes granularity for last 8 days (2304 samples) interval. 3. Click Apply. The Login dialog box displays. 4. Enter your user name and password in the appropriate fields and click OK.
SMI Agent Configuration Tool 11 2. Click Configure SMI Agent on the Server Management Console dialog box. The Log In dialog box displays. FIGURE 115 Log In dialog box 3. Enter your username and password in the appropriate fields. The defaults are Administrator and password, respectively. If you migrated from a previous release, your username and password do not change. 4.
11 SMI Agent Configuration Tool Launching the SMIA configuration tool on Unix NOTE All Management application services must be running before you can log into the SMIA Configuration Tool. To start the Management application services, click Start on the Server Management Console dialog box. Perform the following steps to launch the Server Management Console on Unix systems. 1. On the Management application server, go to the following directory: Install_Directory/bin 2.
SMI Agent Configuration Tool 11 Service Location Protocol (SLP) support The Management application SMI Agent uses Service Location Protocol (SLP) to allow applications to discover the existence, location, and configuration of WBEM services in enterprise networks. You do not need a WBEM client to use SLP discovery to find a WBEM Server; that is, SLP discovery might already know about the location and capabilities of the WBEM Server to which it wants to send its requests.
11 SMI Agent Configuration Tool This output shows the functionalities of the Management application SMI Agent: • accepts WBEM requests over HTTP using SSL on TCP port 5989 • accepts WBEM requests over HTTP without SSL on TCP port 5988 • slptool findattrs service:wbem:https://IP_Address:Port NOTE Where IP_Address:Port is the IP address and port number that display when you use the slptool findsrvs service:wbem command.
SMI Agent Configuration Tool 11 (Classinfo=0,0),(RegisteredProfilesSupported=SNIA:SMI-S,DMTF:Profile Registration,SNIA:FC HBA,DMTF:LaunchInContext,SNIA:Fan,SNIA:Fabric, SNIA:Switch,DMTF:Role Based Authorization,SNIA:Power Supply,SNIA:Sensors, SNIA:Server) SLP on UNIX systems This section describes how to verify the SLP daemon on UNIX systems. SLP file locations on UNIX systems • SLP log—Install_Home/cimom /cfg/slp.log • SLP daemon—Install_Home/cimom /cfg/slp.
11 SMI Agent Configuration Tool You can statically register an application that does not dynamically register with SLP using SLPAPIs by modifying this file. For more information about these files, read the comments contained in them, or refer to http://www.openslp.org/doc/html/UsersGuide/index.html. Verifying SLP service installation and operation on Windows systems 1. Launch the Server Management Console from the Start menu. 2. Click Start to start the SLP service. 3. Open a command window. 4.
SMI Agent Configuration Tool 11 Accessing Management application features To access Management application features such as, fabric and host discovery, role-based access control, application configuration and display options, server properties, as well as the application name, build, and copyright, complete the following steps. 1. Click the Home tab, if necessary. 2. Select from the following to access the feature or dialog box.
11 SMI Agent Configuration Tool 1. Click the Authentication tab. FIGURE 117 Authentication tab 2. Select the Enable Client Mutual Authentication check box, as needed. If the check box is checked, CIM client mutual authentication is enabled. If the check box is clear (default), client mutual authentication is disabled. 3. Select the Enable Indication Mutual Authentication check box, as needed. If the check box is checked, indication mutual authentication is enabled.
SMI Agent Configuration Tool 11 1. Click the Authentication tab. 2. Choose from one of the following options: • Select No Authentication to allow the CIM client to query the CIMOM server without providing credentials; however, note that the CIMOM server requires the Management application credentials to connect to the Management application server to retrieve the required data. To provide Management application credentials, complete the following steps. a.
11 SMI Agent Configuration Tool Configuring the SMI Agent port number To configure the SMI Agent port number, complete the following steps. 1. Click the CIMOM tab. FIGURE 118 CIMOM tab 2. Select or clear the Enable SSL check box, to enable or disable SSL for the SMI Agent. NOTE Disabling SSL will disable Indication and Client Mutual Authentication. If the check box is checked (default), SSL is enabled. If the check box is clear, SSL is disabled. 3.
SMI Agent Configuration Tool 11 Configuring the CIMOM Bind Network Address NOTE You must have SAN - SMI Operation Read and Write privileges to view or make changes on the CIMOM tab. For more information about privileges, refer to “User Privileges” on page 1097. To configure the network bind address, complete the following steps. 1. Click the CIMOM tab. 2. Select a network address from the IP Configuration Bind Network Address list to which you want to bind the CIMOM server.
11 SMI Agent Configuration Tool 3. Click Apply. NOTE Changes on this tab take effect after the next CIMOM server restart. NOTE You can only restart the server using the Server Management Console (Start > Programs > Management_Application_Name 12.X.X > Server Management Console). 4. Click Close to close the SMIA Configuration Tool dialog box. Certificate Management tab NOTE You must have SMI Operation Read and Write privileges to view or make changes on the Certificate Management tab.
SMI Agent Configuration Tool 11 2. Select the Client or Indication from the Authentication list. The appropriate certificates display in the Certificates list. 3. Enter the full path or browse to the certificate you want to import (for example, on Windows the path is C:\Certificates\cimom-indication-auth2.cer and on Linux the path is opt/Certificates/cimom-indication-auth2.cer). You can only import certificate files with the CER extension (.cer). 4.
11 SMI Agent Configuration Tool 4. Click Export Server Certificate. The Save As dialog box displays. 5. Browse to the directory where you want to export the certificate. 6. Edit the certificate name in the File Name field, if necessary. 7. Click Save. 8. Click Close to close the SMIA Configuration Tool dialog box. Deleting a certificate NOTE You must have SMI Operation Read and Write privileges to view or make changes to the Certificate Management tab.
SMI Agent Configuration Tool 11 1. Click the Summary tab. FIGURE 120 Summary tab 2. Review the summary. NOTE When the CIMOM server is stopped, the server configuration information does not display on the Summary tab. The following information is included in the summary. TABLE 37 Field/Component Description Client Mutual Authentication Displays whether or not the client mutual authentication is enabled or disabled for the Server Configuration and the Current Configuration.
11 SMI Agent Configuration Tool TABLE 37 Field/Component Description Log Level Displays the log level for the Server Configuration and the Current Configuration. Options include the following: • 10000—Off • 1000—Severe • 900—Warning • 800—Info (default) • 700—Config • 500—Fine • 400—Finer • 300—Finest • 0—All Managed Ports Displays the number of managed ports. For more information about managed port count rules, refer to “Managed count” on page 29.
Chapter 12 SAN Device Configuration In this chapter • Configuration repository management . . . . . . . . . . . . . . . . . . . . . . . . . . . . • Enhanced group management . . . . . . . . . . . . . . . . . . . . . . . . . . . . . . . . . . . • Firmware management . . . . . . . . . . . . . . . . . . . . . . . . . . . . . . . . . . . . . . . . . • Frame viewer . . . . . . . . . . . . . . . . . . . . . . . . . . . . . . . . . . . . . . . . . . . . . . . . . • Properties customization . . . . . . . . . . .
12 Configuration repository management Saving switch configurations on demand NOTE Save switch configuration is only supported on Fabric OS switches. NOTE This feature requires a Trial or Licensed version. NOTE To save switch configuration on more than one switch at a time, you must have the Enhanced Group Management license.
Configuration repository management 12 3. Click the right arrow to move the selected switches to the Selected Switches table. 4. Click OK. Configuration files from the selected switches are saved to the repository. 5. (Professional only) Browse to the location where you want to save the switch configuration. 6. (Professional only) Click Save Configuration. Configuration files from the selected switches are saved to the selected location.
12 Configuration repository management Scheduling a switch configuration back up NOTE This feature requires a Trial or Licensed version. NOTE The Enhanced Group Management (EGM) license must be activated on a switch to perform this procedure and to use the supportSave module. You can schedule a backup of one or more switch configurations. If a periodic backup is scheduled at the SAN level, that backup will apply to all switches from all fabrics discovered.
Configuration repository management 12 2. Click the Enable scheduled backup check box. 3. Set the Schedule parameters. These include the following: - The desired Frequency for backup operations (daily, weekly, monthly). The Day you want back up to run. If Frequency is Daily, the Day list is grayed out. If Frequency is Weekly, choices are days of the week (Sunday through Saturday). If Frequency is Monthly, choices are days of the month (1 through 31). - The Time (hour, minute) you want back up to run.
12 Configuration repository management Restoring a configuration from the repository If you delete a fabric or switch from discovery, the configuration remains in the repository until you delete it manually. Stored configurations are linked to the switch WWN; therefore, if the IP address or switch name is changed and then rediscovered, the Switch Configuration Repository dialog box displays the new switch name and IP address for the old configuration.
Configuration repository management 12 • Discovered — Whether the switch is discovered or not. Yes — The switch is discovered. No — The switch was deleted from discovery. Comments — Comments regarding the switch. • 2. Select the configuration you want to restore, and click Restore. The configuration is downloaded to the device. If necessary, the restoration process prompts you to disable and reboot the device before the configuration begins.
12 Configuration repository management FIGURE 125 Configuration file content 3. Click Close to close the dialog box. 4. Click Yes on the message. Searching the configuration file content NOTE This feature requires a Trial or Licensed version. To search the configuration file content, complete the following steps. 1. Right-click a device in the Product List or the Connectivity Map, and select Configuration > Configuration Repository. The Switch Configuration Repository dialog box displays. 2. Click View.
Configuration repository management 12 FIGURE 126 Configuration file content 4. Click Close to close the dialog box. 5. Click Yes on the message. Deleting a configuration NOTE This feature requires a Trial or Licensed version. 1. Right-click a device in the Product List or the Connectivity Map, and select Configuration > Configuration Repository. The Switch Configuration Repository dialog box displays. 2. Select the configuration you want to delete, and click Delete.
12 Configuration repository management 4. Click Export. The configuration is automatically named (Device_Name_Date_and_Time) and exported to the location you selected. Importing a configuration NOTE This feature requires a Trial or Licensed version. 1. Right-click a device in the Product List or the Connectivity Map, and select Configuration > Configuration Repository. The Switch Configuration Repository dialog box displays. 2. Click Import. The file chooser appropriate to your operating system displays.
Configuration repository management 12 3. Source Location, which allows you to select the location of the configuration you wish to replicate. For more information about the fields and components of this step, refer to Table 39 on page 337. 4. Source Configuration, which allows you to select the source switch to replicate. For more information about the fields and components of this step, refer to Table 40 on page 338. 5. Destination Switches, which allows you to select the destination switch.
12 Configuration repository management TABLE 40 Step 4. Source Configuration Field/Component Description Saved Switch Configuration table (Configuration Repository only) Lists the information related to the saved switch, if you selected Configuration Repository on the Source Location screen. Backup Date/Time (Configuration Repository only) The date and time the last backup occurred on the switch. Fabric Name The name of the fabric that is associated with the selected available switch.
Configuration repository management TABLE 40 12 Step 4. Source Configuration (Continued) Field/Component Description State The port state, for example, online or offline. Status The operational status of the port.; for example, unknown or marginal. Symbolic Name The symbolic name for the port. Tag The tag number of the port Vendor The hardware vendor’s name. WWN The world wide name of the source switch to be replicated. Zone Alias The zone alias.
12 Configuration repository management TABLE 41 Step 5. Destination Switches (Continued) Field/Component Description Status The operational status of the port.; for example, unknown or marginal. Symbolic Name The symbolic name for the port. Tag The tag number of the port Vendor The hardware vendor’s name. WWN The world wide name of the source switch to be replicated. Zone Alias The zone alias.
Configuration repository management 12 3. Select Source Switch, which allows you to select the source device of the security policy configuration you wish to replicate. For more information about the fields and components of this step, refer to Table 45 on page 341. 4. Select Destination Switches, which allows you to select the destination devices. Only devices that can accept the selected security policy configuration display.
12 Configuration repository management TABLE 45 Description Port Count The total number of ports. Firmware The firmware version. Location The customer site location. Contact The primary contact at the customer site. Description A description of the customer site. State The port state, for example, online or offline. Status The operational status of the port.; for example, unknown or marginal. TABLE 46 342 Step 3. Select Source Switch (Continued) Field/Component Step 4.
Enhanced group management TABLE 47 12 Step 5. Validation Field/Component Description Validation Settings table The replication settings that have been configured in previous steps; for example, the configuration type, source configuration, and destination settings. Click Finish to approve the settings. TABLE 48 Step 6.
12 Firmware management Firmware management A firmware file repository (Windows systems only) is maintained on the server in the following location: C:\Program Files\Install_Directory\data\ftproot\Firmware\Switches\7.0\n.n.n\n.n.n The firmware repository is used by the internal FTP, SCP, or SFTP server that is delivered with the Management application software, and may be used by an external FTP server if it is installed on the same platform as the Management application software.
Firmware management 12 FIGURE 127 Firmware download 3. Select one or more switches from the Available Switches table. The Available Switches table lists the switches that are available for firmware download. 4. Click the right arrow to move the switches to the Selected Switches table. If you selected any switches that do not support firmware download, a message displays. Click OK on the message. The switches that support firmware download display in the Selected Switches table.
12 Firmware management • Select the SCP Server option to download from the external SCP server. Continue with step 7. NOTE The Management application only supports WinSSHD as the third-party Windows external SCP server. Firmware upgrade and downgrade through WinSSHD is only supported on devices running Fabric OS 6.0 or later. • Select the SFTP Server option to download from the external SFTP server. Continue with step 7.
Firmware management 12 Displaying the firmware repository The firmware repository is available on the Firmware Management dialog box. The Management application supports .zip and .gz compression file types for firmware files. Initially, the firmware repository is configured to use the built-in FTP, SCP, or SFTP server. To use an external FTP server, refer to “Configuring an external FTP, SCP, or SFTP server” on page 127.
12 Firmware management • Release Notes View button — Click to view the release notes, if imported, which contain information about downloading firmware. • Supported Switch Type Information table — Shows the switch type, capable switch count, and number of installed switches. You can choose one of two switch groups: Show switch types in my resource group. Show all supported switch types. 4.
Firmware management 12 6. Enter or browse to the location of the MD5 file (.md5 file type). If the MD5 checksum file is located in the same directory as the firmware file and has the same file name (with the md5 extension), this field is auto-populated. The MD5 checksum file can be obtained from the Fabric OS product download site in the same location as the firmware file.
12 Frame viewer Frame viewer NOTE Frame viewer is only supported on Fabric OS devices running 7.1.0 or later. Frame viewer enables you to view a list of devices with discarded frames due to c3 timeout, destination unreachable, and not routable. You can also view a summary of discarded frames for each device and clear the discarded frame log on the device. Viewing discarded frames from a device 1. Select a Fabric OS device running 7.1.0 or later and select Monitor > Discarded Frames.
Frame viewer 12 3. Select a device in the top table to view detailed data about the discarded frames on that device. • Discarded Frame History for the Selected Product table — Summary of the discarded frames for the selected device. Count – Number of discarded frames logged in the frame log with the same timestamp, Tx Port, Rx Port, SID, DID, SFID, and DFID. The maximum number of duplicate frames stored for any 1 second timestamp is 20.
12 Frame viewer Viewing discarded frames from a port 1. Select a port on a Fabric OS device running 7.1.0 or later and select Monitor > Discarded Frames. The Discarded Frames dialog box displays. 2. Review the data for the discarded frames from the selected port. • Discarded Frame History for the Selected Product table — Summary of the discarded frames for the selected port.
Properties customization 12 Clearing the discarded frame log 1. Open the Discarded Frames dialog box (refer to “Viewing discarded frames from a device” on page 350 or “Viewing discarded frames from a port” on page 352). 2. Select one of the following options: • If you are in switch view, select a device in the upper table and click Clear to clear the discarded frames from the frame log. • If you are in port view, click Clear to clear the discarded frames from the frame log. 3. Click Close.
12 Properties customization Editing a property label You can edit any label that you create on the Properties dialog box. To edit any field you create, complete the following steps. 1. Right-click any product icon and select Properties. The Properties dialog box displays. 2. Select the tab on which you want to edit a property. 3. Right-click the label for the property you want to edit. 4. Select Edit. The Edit Property dialog box displays. 5. Change the label and description for the property, as needed.
Ports 12 Ports You can enable and disable ports, as well as view port details, properties, type, status, and connectivity. Viewing port connectivity The connected switch and switch port information displays for all ports. To view port connectivity, choose one of the following steps: • Right-click a Fabric and select Port Connectivity. • Right-click a product icon and select Port Connectivity. • Select a product icon and select Monitor > Port Connectivity.
12 Ports TABLE 49 356 Port connectivity properties (Continued) Field Description Blade Number The number of the blade. Blocked Whether the selected port is blocked. Buffer Limited Whether buffers are limited. Buffers Needed/Allocated The ratio of buffers needed relative to the number of buffers allocated. Calculated Status The operational status. There are four possible operation status values: Healthy, Down, Marginal, and Unmonitored.
Ports TABLE 49 12 Port connectivity properties (Continued) Field Description Fabric / Switch Name If launched from a fabric, displays the fabric name. If launched from a switch, displays the fabric name and the switch name. FC4 Type The active FC4 type; for example, SCSI. FC Address The Fibre Channel address. Each FC port has both an address identifier and a world wide name (WWN). Filter check box / link Select to filter results from the Port Connectivity View dialog box.
12 Ports TABLE 49 Port connectivity properties (Continued) Field Description Switch in Order Delivery Whether switch in-order delivery is enabled. Switch IP The switch’s IP address. Switch Port Count The number of ports on the switch. Switch Port Type The port type; for example, E-Port, F-Port, U-port, and so on. Switch Role The role of the switch; for example, subordinate. Switch Routing Policy Whether a routing policy, for example, port-based routing policy, is enabled.
Ports 12 Filtering port connectivity To filter results from the port connectivity view, complete the following steps. 1. Click the Filter link from the Port Connectivity View dialog box The Filter dialog box displays (Figure 132). FIGURE 132 Filter dialog box 2. Click a blank cell in the Field column to select the property from which to filter the results. 3. Click a blank cell in the Relation column to select an action operation.
12 Ports Resetting the filter Reset immediately clears all existing definitions. You cannot cancel the reset. To reset the Filter dialog box, complete the following steps. 1. Click the Filter link from the Port Connectivity View dialog box. The Filter dialog box displays. 2. Click Reset. All existing definitions are cleared automatically. You cannot cancel the reset. Enabling the filter To enable the filter, select the Filter check box.
Ports 12 Viewing ports To view ports on the Connectivity Map, right-click a product icon and select Show Ports. NOTE Show Ports is not applicable when the map display layout is set to Free Form (default). NOTE This feature is only available for connected products. On bridges and CNT products, only utilized Fibre Channel ports display; IP ports do not display. Port types On the Connectivity Map, right-click a switch icon and select Show Ports.
12 Ports Viewing port connection properties You can view the information about products and ports on both sides of the connection. 1. Right-click the connection between two end devices on the Connectivity Map and select Properties. OR Double-click the connection between two devices on the Connectivity Map. The Connection Properties dialog box displays.
Ports TABLE 51 12 Port connection properties (Continued) Field Description 2-Port Type The port type of the second switch. 2-WWPN The world wide port number of the second switch. 2-MAC Address The MAC address of the second switch. 2-IP Address The IP address of the second switch. 2-Trunk Whether there is a trunk on the second switch. 2-Speed (Gbps) The speed of the second switch. 2-Tunnel ID The tunnel ID of the second switch. 2-Circuit ID The circuit ID of the second switch.
12 Ports TABLE 51 Port connection properties (Continued) Field 364 Description Long Distance Setting Whether the connection is considered to be normal or longer distance. MAC Address The MAC address of the switch. Manufacturer The name of the manufacturer. Manufacturer Plant The name of the manufacturing plant. Name The name of the switch. NPIV Enabled Whether the NPIV port is enabled. Parameter The parameter of the switch.
Ports TABLE 51 12 Port connection properties (Continued) Field Description Auto VPWWN The automatically generated VPWWN. User VPWWN The user-defined VPWWN. 3. Click Close to close the dialog box. Determining inactive iSCSI devices For router-discovered iSCSI devices, you can view all of the inactive iSCSI devices in one list. To do this, use the Ports Only view and then sort the devices by FC Address. The devices that have an FC address of all zeros are inactive. 1.
12 Ports 2. Review the port optics information. • Combined Status — Displays the current status of the port. NOTE Requires a 16 Gbps capable port running Fabric OS 7.0 or later. NOTE The device must have a Fabric Watch license and threshold monitoring configured for the port. For more information, refer to the Fabric Watch Administrator’s Guide.
Port commissioning overview • • • • • • • • • • • • 12 FC Speed (MB/s) (Fabric OS 6.4 or earlier) — The FC port speed; for example, 400 Mbps. Distance — The length of the fiber optic cable. Vendor — The vendor of the SFP. Vendor OUI — The vendor’s organizational unique identifier (OUI). Vendor PN — The part number of the SFP. Vendor Rev — The revision number of the SFP. Serial # — The serial number of the SFP. Data Code — The data code.
12 Port commissioning overview Viewing existing CIMOM servers NOTE Port commissioning is only supported on Fabric OS devices running Fabric OS 7.1 or later. Before you can decommission or recommission an F-Port, you must register the CIMOM servers within the fabric affected by the action. 1. Select Configure > Port Commissioning > Setup. The Port Commissioning Setup dialog box displays (Figure 135). FIGURE 135 Port Commissioning Setup dialog box The Port Commissioning Setup dialog box has two main areas.
Port commissioning overview • • • • • 12 Description — User-defined description of the system. CIMOM Port — The CIMOM port number of the system. Namespace — The namespace of the CIM_FCPort. User ID — The user identifier for the system. Status — The system connectivity status. Updates when you test the reachability of the CIMOM server and when you contact the CIMOM server to respond to the F-Port decommission or recommission request.
12 Port commissioning overview 5. Enter the namespace of the CIM_FCPort in the Namespace field. The default namespace is root/cimv2. 6. (Optional) Enter a user identifier for the CIMOM server in the Credentials User ID field. The credentials user identifier cannot be over 128 characters. 7. (Optional) Enter a password in the Password field. The password cannot be over 512 characters. 8. Click the right arrow button to add the new CIMOM server and credentials to the Systems List.
Port commissioning overview 12 Importing CIMOM servers and credentials You can import one or more CIMOM servers (system and credentials) using a CSV formatted file. You can import a maximum of 2,000 CIMOM servers. 1. Select Configure > Port Commissioning > Setup. The Port Commissioning Setup dialog box displays (Figure 135). 2. Click Import to import CIMOM server information from a file.
12 Port commissioning overview Changing CIMOM server credentials You can edit the CIMOM server credentials for one or more CIMOM servers at the same time. 1. Select Configure > Port Commissioning > Setup. The Port Commissioning Setup dialog box displays (Figure 135). 2. Select one or more CIMOM servers from the System List table and click Change Credentials. The Edit Credentials dialog box displays. If you selected one CIMOM server, the credentials for the selected server display in the dialog box.
Port commissioning overview 12 Deleting CIMOM server credentials 1. Select Configure > Port Commissioning > Setup. The Port Commissioning Setup dialog box displays (Figure 135). 2. Select one or more CIMOM server from the System List table and click the left arrow button. The details for the last selected CIMOM server row displays in the Add/Edit System and Credentials area. 3.
12 Port commissioning overview Recommissioning an F-Port NOTE You must configure at least one CIMOM server (refer to “Registering a CIMOM server” on page 369) before you can recommission an F-Port. Select the F-Port, then select Configure > Port Commissioning > Recommission > Port. While recommissioning is in progress, an up arrow icon displays next to the port icon in the Product List.
Port commissioning overview 12 Decommissioning all ports on a switch or blade NOTE (Virtual Fabrics only) All ports on the blade must be managed by the Management application. NOTE Fabric tracking must be enabled (refer to “Enabling fabric tracking” on page 132) to maintain the decommissioned port details (such as port type, device port wwn, and so on). Do not accept changes in the Management application client. 1.
12 Port commissioning overview Recommissioning all ports on a switch or blade NOTE All ports on the switch or blade must be managed by the Management application. Select the switch or logical switch for which you want to recommission all ports, then select Configure > Port Commissioning > Recommission > All F-Ports on the Switch/Blade. NOTE You can only recommission ports from the logical switch, not the physical chassis.
Administrative Domain-enabled fabric support 12 Administrative Domain-enabled fabric support The Management application provides limited support for AD-enabled fabrics. An Administrative Domain (Admin Domain or AD) is a logical grouping of fabric elements that defines which switches, ports, and devices you can view and modify. An Admin Domain is a filtered administrative view of the fabric. NOTE If you do not implement Admin Domains, the feature has no impact on users and you can ignore this section.
12 Administrative Domain-enabled fabric support • If you try to enable Virtual Fabrics on an AD-enabled switch, that operation fails with the following message: “Failed to enable Virtual Fabric feature for Chassis (Remove All ADs before attempting to enable VF).” • Performs performance management (including Advance Performance Monitoring and Top Talkers) data collection and reports in a physical fabric context.
Administrative Domain-enabled fabric support TABLE 52 12 Feature support for AD-enabled fabrics (Continued) Feature AD context ADO AD255 Not supported All AD User interface impact Performance Management > Configure Thresholds End-to-End Monitors Clear Counters X Filters AD-enabled fabric from the Fabrics list. Port Auto Disable X Filters AD-enabled fabric from the dialog box. Port Connectivity X Disables menu for a switch in an AD-enabled fabric.
12 Port Auto Disable Port Auto Disable The Port Auto Disable dialog box allows you to enable and disable the port auto disable flag on individual FC_ports or on all ports on a selected device, as well as unblock currently blocked ports.
Port Auto Disable 12 FIGURE 136 Port Auto Disable dialog box 2. Select one of the following from the Show list to determine what ports to display: • • • • All Ports (default) Disabled PAD Ports Enabled PAD Ports Blocked Ports 3. Review the port status and other information: • Products/Ports tree — Displays devices and associated ports. Also, displays a Warning icon for blocked FC ports (displayed with the port icon).
12 Port Auto Disable • • • • • • • • • Port Type — Displays the port type. Port Number — Displays the port number. Port WWN — Displays the port world wide name. Port Name — Displays the port name. User Port # — Displays the user port number. PID — Displays the port identifier. Connected Port # — Displays the connected port number. Connected Port WWN — Displays the connected port world wide name. Connected Port Name — Displays the connected port name. 4. Click OK on the Port Auto Disable dialog box.
Port Auto Disable 7. 12 Click OK on the Configure Port Auto Disable dialog box. 8. Click OK on the Port Auto Disable dialog box. Enabling port auto disable on individual ports NOTE The device must be running Fabric OS 6.3 or later. To enable port auto disable on individual ports, complete the following steps. 1. Select Configure > Port Auto Disable. The Port Auto Disable dialog box displays. 2. Select the fabric on which you want to enable port auto disable (PAD) from the Fabric list. 3.
12 Port Auto Disable 4. Select the device on which you want to enable PAD on all ports. 5. Click Configure. The Configure Port Auto Disable dialog box displays. 6. Select one or more of the following event types: • • • • • Port Auto Disable Loss Of Sync — Requires devices running Fabric OS 7.0 or later. Loss Of Signal — Requires devices running Fabric OS 7.0 or later. OLS (Offline Primitive Sequence) — Requires devices running Fabric OS 7.0 or later.
Port Auto Disable 7. 12 Click OK on the Configure Port Auto Disable dialog box. 8. Click OK on the Port Auto Disable dialog box. Disabling port auto disable on all ports on a device NOTE The device must be running Fabric OS 6.3 or later. To disable port auto disable on all ports on a device, complete the following steps. 1. Select Configure > Port Auto Disable. The Port Auto Disable dialog box displays. 2. Select the fabric on which you want to disable port auto disable (PAD) from the Fabric list. 3.
12 386 Port Auto Disable Brocade Network Advisor SAN User Manual 53-1002696-01
Chapter 13 Host Port Mapping In this chapter • Host port mapping overview . . . . . . . . . . . . . . . . . . . . . . . . . . . . . . . . . . . . . • Creating a new Host . . . . . . . . . . . . . . . . . . . . . . . . . . . . . . . . . . . . . . . . . . . • Renaming an HBA Host. . . . . . . . . . . . . . . . . . . . . . . . . . . . . . . . . . . . . . . . . • Deleting an HBA Host . . . . . . . . . . . . . . . . . . . . . . . . . . . . . . . . . . . . . . . . . . • Viewing Host properties . . . . . . . .
13 Creating a new Host Creating a new Host To create a new Host, complete the following steps. 1. Right-click an HBA icon in the Fabric topology and select Host Port Mapping. The Host Port Mapping dialog box displays. FIGURE 137 Host Port Mapping dialog box The Host Port Mapping dialog box includes the following details: • HBAs table — All unassigned HBAs. Lists the following information for all available HBAs. You can sort the table by clicking once on any of the column titles.
Renaming an HBA Host 13 Renaming an HBA Host To rename a Host, complete the following steps. 1. Right-click an HBA icon in the Fabric topology and select Host Port Mapping. The Host Port Mapping dialog box displays. 2. Click the Host you want to rename in the Hosts table, wait a moment, and then click it again. The Host displays in edit mode. 3. Type a new name for the Host. The name of the Host appears in the Hosts table in alphabetical order with the new name.
13 Associating an HBA with a Host Associating an HBA with a Host ATTENTION Discovered information overwrites your user settings. To associate an HBA with a Host, complete the following steps. 1. Right-click an HBA icon in the Fabric topology and select Host Port Mapping. The Host Port Mapping dialog box displays. 2. Select the Host to which you want to assign HBAs in the Hosts table or click New Host to create a new Host. 3. Select the HBA from the HBAs table on the left and click the right arrow.
Importing HBA-to-Host mapping 13 4. Click Open on the Import dialog box. The file imports, reads, and applies all changes line-by-line and performs the following: • Checks for correct file structure and well-formed WWNs, and counts number of errors. If more than 5 errors occur, import fails and a ‘maximum error count exceeded’ message displays. Edit the Host port mapping file and try again. • Checks for duplicate HBAs. If duplicates exist, a message displays with the duplicate mappings detailed.
13 Removing an HBA from a Host Removing an HBA from a Host To remove an HBA from a Host, complete the following steps. 1. Right-click an HBA icon in the Fabric topology and select Host Port Mapping. The Host Port Mapping dialog box displays. 2. Select the HBA from the Hosts table on the right and click the left arrow. The HBA you selected is removed from the Hosts table and the HBA is no longer associated with the Host.
Exporting Host port mapping 13 4. Browse to the location where you want to save the export file. Depending on your operating system, the default export location are as follows: • Desktop\My documents (Windows) • \root (Linux) 5. Enter a name for the files and click Save. 6. Click OK to close the Host Port Mapping dialog box.
13 394 Exporting Host port mapping Brocade Network Advisor SAN User Manual 53-1002696-01
Chapter 14 Storage Port Mapping In this chapter • Storage port mapping overview . . . . . . . . . . . . . . . . . . . . . . . . . . . . . . . . . . • Creating a storage array . . . . . . . . . . . . . . . . . . . . . . . . . . . . . . . . . . . . . . . . • Adding storage ports to a storage array. . . . . . . . . . . . . . . . . . . . . . . . . . . . • Unassigning a storage port from a storage array . . . . . . . . . . . . . . . . . . . . • Reassigning mapped storage ports . . . . . . . . . . . . . . . .
14 Creating a storage array Creating a storage array To create a storage array, complete the following steps. 1. Select a storage port icon in the topology view, then select Discover > Storage Port Mapping. The Storage Port Mapping dialog box displays with the following information. • Storage Ports table — Lists the following information for all available storage ports. You can sort the table by clicking once on any of the column titles. Fabric Name—The fabric name.
Unassigning a storage port from a storage array 14 4. Click the right arrow. The storage port is added to the Storage Array. 5. Click OK to save your work and close the Storage Port Mapping dialog box. If the storage device is part of more than one fabric, a message displays: The selected Storage_Name/Storage_WWN is part of more than one fabric. The port nodes associated with the other fabrics will automatically be moved to the storage array. Click OK to close the message.
14 Editing storage array properties 6. Click the right arrow button. The storage port moves from the Storage Ports table to the selected storage array. 7. Click OK to save your work and close the Storage Port Mapping dialog box. Editing storage array properties To edit storage array properties, complete the following steps. 1. Select a storage port icon in the topology view, then select Discover > Storage Port Mapping. The Storage Port Mapping dialog box displays. 2.
Viewing storage array properties 14 4. Review the properties. 5. Click OK on the Properties dialog box. 6. Click OK on the Storage Port Mapping dialog box. Viewing storage array properties To view storage array properties, complete the following steps. 1. Select a storage port icon in the topology view, then select Discover > Storage Port Mapping. The Storage Port Mapping dialog box displays. 2. Select a storage array from the Storage Array list. 3. Click Properties. The Properties dialog box displays.
14 Importing storage port mapping 4. Click Open on the Import dialog box. The file imports, reads, and applies all changes line-by-line and performs the following: • Checks for correct file structure (first entry must be the storage node name (WWN) and second entry must be the storage array name), well formed WWNs, and counts number of errors If more than 5 errors occur, import automatically cancels. Edit the storage port mapping file and try again.
Exporting storage port mapping 14 Exporting storage port mapping The Storage Port Mapping dialog box enables you to export a storage port array. The export file uses the CSV format. The first row contains the headers (Storage Node Name (WWNN), Storage Array Name) for the file. Example Storage Node Name (WWNN), Storage Array Name 20000004CFBD7100,New Storage Array 20000004CFBD896E,New Storage Array 20000037E19CED,New Storage Array To export a storage port array, complete the following steps. 1.
14 402 Exporting storage port mapping Brocade Network Advisor SAN User Manual 53-1002696-01
Chapter 15 Host Management In this chapter • Host management. . . . . . . . . . . . . . . . . . . . . . . . . . . . . . . . . . . . . . . . . . . . . • Brocade adapters . . . . . . . . . . . . . . . . . . . . . . . . . . . . . . . . . . . . . . . . . . . . . • HCM software . . . . . . . . . . . . . . . . . . . . . . . . . . . . . . . . . . . . . . . . . . . . . . . . • Host adapter discovery . . . . . . . . . . . . . . . . . . . . . . . . . . . . . . . . . . . . . . . . . • VM Manager. . . . . . . . . .
15 Brocade adapters The Management application, in conjunction with HCM, provides end-to-end management capability. For information about configuring, monitoring, and managing individual adapters using the HCM GUI or the Brocade Command Utility (BCU), refer to the Adapters Administrator’s Guide.
Brocade adapters 15 Converged Network Adapters Table 56 describes available Brocade Converged Network Adapters (CNAs) for PCIe x 8 host bus interfaces, hereafter referred to as Brocade CNAs. These adapters provide reliable, high-performance host connectivity for mission-critical SAN environments.
15 HCM software AnyIOTM technology Although the Brocade 1860 Fabric Adapter can be shipped in a variety of small form-factor pluggable (SFP) transceiver configurations, you can change port function to the following modes using Brocade AnyIOTM technology, provided the correct SFP transceiver is installed for the port: • HBA or Fibre Channel mode—This mode utilizes the Brocade Fibre Channel storage driver. An 8 or 16 Gbps Fibre Channel SFP transceiver can be installed for the port.
HCM software 15 HCM features Common HBA and CNA management software features include the following: • Discovery using the agent software running on the servers attached to the SAN, which enables you to contact the devices in your SAN. • Configuration management, which enables you to configure local and remote systems.
15 Host adapter discovery Host adapter discovery The Management application enables you to discover individual hosts, import a group of hosts from a CSV file, or import host names from discovered fabrics. The maximum number of host discovery requests that can be accepted is 1000. Host discovery requires HCM Agent 2.0 or later. ESXi host adapter discovery requires the Brocade HBA CIM provider to be installed on the ESXi host.
HCM and Management application support on ESXi systems 7. 15 Click OK. The VMM discovery process begins. When complete, the vCenter server and all ESX and ESXi hosts managed by that vCenter display in the Host product tree. Editing a VM Manager The fields in the Edit VM Manager dialog box are identical to the fields in the Add VM Manager dialog box except for the Network Address field, which you cannot edit. 1. Click Edit on the Discover VM Managers dialog box. The Edit VM Manager dialog box displays.
15 HCM and Management application support on ESXi systems ESXi CIM listener ports The Management application server uses two CIM indication listener ports to listen for CIM indications. • HCM Proxy Service CIM Indication Listener Port—This port is used to listen for CIM indications from ESXi hosts managed through HCM instances launched by the Management application. You can learn the value of these ports through the Port Status dialog box.
Connectivity map 15 3. Select CIM server (ESXi only) as the Contact option. 4. (Optional) Select HTTP or HTTPS from the Protocol list. HTTPS is the default. 5. Click OK. Connectivity map The Connectivity Map, which displays in the upper right area of the main window, is a grouped map that shows physical and logical connectivity of Fabric OS components, including discovered and monitored devices and connections. These components display as icons in the Connectivity Map.
15 Adapter software If you create a new host and associate HBAs to it, and then you try to discover a host with the same HBAs using Host discovery, the HBAs discovered using host discovery must match the HBAs associated to the host exactly; otherwise, host discovery will fail. Instructions for mapping a host to HBAs are detailed in Chapter 13, “Host Port Mapping”.
Adapter software 15 • Name—The name of the host. The first three digits indicate the host’s operating system; for example, WIN or LIN. • Operating System—The host operating system; for example, Microsoft Windows or Red Hat Linux. • Driver Version—The host’s current driver version. • Architecture—The host’s architecture; for example, 32-bit or 64-bit. 3. Select one or more hosts from the Selected Hosts list.
15 Adapter software FIGURE 141 Driver Repository dialog box 2. Click Import on the Driver Repository dialog box. The Import Driver Repository dialog box displays. 3. Locate the driver file using one of the following methods: • Search for the file you want from the Look In list. • Enter the name of the image file you want to import in the File Name field. 4. Click Open. After the import completes, you see a message that the driver imported successfully. 5. Click OK.
Adapter software 15 Importing a boot image into the repository Boot images are required for adapters that are shipped without a boot image or when it is necessary to overwrite images on adapters that contain older or corrupted boot image versions. 1. From the Management application menu bar, select Configure > Host > Adapter Software. 2. Click the Boot Image tab. The Boot Image Management dialog box, shown in Figure 142, displays.
15 Adapter software 3. From the Boot Image Management dialog box, click the Repository button. The Boot Image Repository dialog box, shown in Figure 143, displays. FIGURE 143 Boot Image Repository dialog box 4. Click Import on the Boot Image Repository dialog box. 5. The Import Boot Image dialog box displays. 6. Locate the boot image file using one of the following methods: • Search for the file you want from the Look In list. Boot image files version 2.0.0.0 and 2.1.0.0 are .
Adapter software 15 Downloading a boot image to a selected host To download boot images to a selected host, perform the following tasks. 1. Select one or more hosts from the Available Hosts list on the Boot Image Management dialog box, and click the right arrow button to move the selected hosts to the Selected Hosts list. You can select up to 50 hosts. The first 20 hosts execute the download concurrently.
15 Bulk port configuration Bulk port configuration Use the Adapter Host Port Configuration dialog box to create and assign port-level configurations to either a single or multiple adapter ports at a time. You can save up to 50 port-level configurations. The Management application supports the following default port configurations, which you can select and assign to one port or multiple ports. You cannot edit the default configurations, but you can delete them. • • • • Default Port—The port property.
Bulk port configuration 15 Adding a port configuration The Add Port Configuration dialog box allows you to create a maximum of 50 customized port configurations which you can then select and assign to ports. 1. Click Add on the Configure Host Adapter Ports dialog box. The Add Port Configuration dialog box, shown in Figure 145, displays. FIGURE 145 Add Port Configuration dialog box 2. Enter a name for the port configuration in the Configuration Name field.
15 Bulk port configuration - Target Rate Limiting—Enable the Target Rate Limiting feature to minimize congestion at the adapter port. Limiting the data rate to slower targets ensures that there is no buffer-to-buffer credit back-pressure between the switch due to a slow-draining target. NOTE NOTE: Target Rate Limiting and QoS cannot be enabled at the same time.
Bulk port configuration 15 • Enter the minimum allowable output bandwidth in the Min Bandwidth (Mbps) box. The minimum bandwidth is 0 Mbps. A zero value of minimum bandwidth (the default) implies that no bandwidth is guaranteed for that vNIC. • BB Credit Recovery—Enables you to enable or disable buffer-to-buffer (BB) credits, which are a flow control mechanism that represent the availability of resources at the receiving port.
15 Adapter port WWN virtualization Adapter port WWN virtualization Adapter port world wide name (WWN) virtualization enables the adapter port to use a switch-assigned WWN rather than the physical port WWN for communication, allowing you to preprovision the server with the following configuration tasks: • Create the zones with the Fabric Assigned WWN (FAWWN) before the servers and devices are connected to the switches, before they are exposed to the SAN network.
Adapter port WWN virtualization 15 Enabling the FAWWN feature on a switch or AG ports 1. Select Configure > Fabric Assigned WWN. or Right-click the switch and select Fabric Assigned WWN. The Configure Fabric Assigned WWNs dialog box displays. 2. Select a switch port from the Fabric Assigned WWN - Configuration list. 3. Click the Enable button. The selected switch’s port status is enabled. 4. Click OK. The Fabric Assigned WWN Confirmation and Status dialog box displays. 5.
15 Adapter port WWN virtualization Manually assigning a FAWWN to a switch or AG port 1. Select Configure > Fabric Assigned WWN. or Right-click the switch and select Fabric Assigned WWN. The Configure Fabric Assigned WWNs dialog box displays. 2. Select a switch port or AG port from the Fabric Assigned WWN - Configuration list. 3. Click the Auto button. If the switch port does not have an Auto FAWWN map type and the FAWWN feature is not yet enabled on the port, a To Be Generated message displays. 4.
Adapter port WWN virtualization 15 FAWWNs on attached AG ports The Configure Fabric Assigned Assigned WWNs dialog box, shown in Figure 147, enables you to configure the Fabric Assigned WWN feature on a selected attached Access Gateway (AG) port. 1. Select Configure > Fabric Assigned WWN. or Right-click the switch and select Fabric Assigned WWN. The Configure Fabric Assigned WWNs dialog box displays. 2. Click the Attached AG Ports tab.
15 Adapter port WWN virtualization 5. Enter a valid world wide name (WWN), with or without colons, for the Access Gateway node. Optionally, you can select an existing AG Node WWN from the list. The AG Node WWN box includes all discovered AG Node WWNs that are connected to the selected switch. 6. Enter a port or a port range using numbers or a hyphen (-). For example, you can enter a range as 1-6 or you can separate values with a comma; for example: 1, 2, 5, 7-10, 20. 7.
Role-based access control 15 Role-based access control The Management application enables you to create resource groups and assign users to the selected role within that group. This enables you to assign users to a role within the resource group. The Management application provides one preconfigured resource group (All Fabrics). When you create a resource group, all available roles are automatically assigned to the resource group.
15 Host performance management Host performance management Real-time performance enables you to collect data from managed HBA and CNA ports. You can use real-time performance to configure the following options: • Select the polling rate from 20 seconds up to 1 minute. • Select up to 32 ports total from a maximum of 10 devices for graphing performance. • Choose to display the same Y-axis range for both the Tx MBps and Rx MBps measure types for easier comparison of graphs.
Host security authentication TABLE 58 15 Counters (Continued) FC port measures HBA port measures CNA port measures Transmitted FCoE pause frames Received FCS error frames Transmitted FCS error frames Received alignment error frames Received length error frames Received code error frames Instructions for generating real-time performance data are detailed in “Generating a real-time performance graph” on page 903.
15 Host security authentication FIGURE 148 Fibre Channel Security Protocol Configuration dialog box 3. Configure the following parameters on the Fibre Channel Security Protocol Configuration dialog box: a. Select the Enable Authentication check box to enable the authentication policy. If authentication is enabled, the port attempts to negotiate with the switch. If the switch does not participate in the authentication process, the port skips the authentication process. b.
supportSave on adapters 15 supportSave on adapters Host management features support capturing support information for managed Brocade adapters, which are discovered in the Management application. You can trigger supportSave for multiple adapters at the same time. supportSave cannot be used to collect support information for ESXi hosts managed by a CIM Server. Refer to the Brocade Adapters Administrator’s Guide for information about supportSave on ESXi hosts.
15 Host fault management Filtering event notifications The Management application provides notification of many different types of SAN events. If a user wants to receive notification of certain events, you can filter the events specifically for that user. NOTE The e-mail filter in the Management application is overridden by the firmware e-mail filter.
Backup support 15 Backup support The Management application helps you to protect your data by backing it up automatically. The data can then be restored, as necessary. Configuring backup to a hard drive NOTE Configuring backup to a hard drive requires a hard drive. The drive should not be the same physical drive on which your operating system or the Management application is installed. To configure the backup function to a hard drive, complete the following steps. 1. Select Server > Options.
15 Backup support Enabling backup Backup is enabled by default. However, if it has been disabled, complete the following steps to enable the function. 1. Select Server > Options. The Options dialog box displays. 2. Select Server Backup in the Category list. 3. Select the Enable Backup check box. 4. Click Apply or OK. Disabling backup Backup is enabled by default. If you want to stop the backup process, you must disable backup. To disable the backup function, complete the following steps. 1.
Chapter 16 Fibre Channel over Ethernet In this chapter • FCoE overview . . . . . . . . . . . . . . . . . . . . . . . . . . . . . . . . . . . . . . . . . . . . . . . . • Enhanced Ethernet features. . . . . . . . . . . . . . . . . . . . . . . . . . . . . . . . . . . . . • FCoE protocols supported. . . . . . . . . . . . . . . . . . . . . . . . . . . . . . . . . . . . . . . • FCoE licensing . . . . . . . . . . . . . . . . . . . . . . . . . . . . . . . . . . . . . . . . . . . . . . . .
16 Enhanced Ethernet features DCBX exchange protocol Data Center Bridging Exchange (DCBX) protocol allows enhanced Ethernet devices to convey and configure their DCB capabilities and ensures a consistent configuration across the network. DCBX protocol is used between DCB devices, such as a converged network adapter (CNA) and an FCoE switch, to exchange configuration with directly connected peers. NOTE When DCBX protocol is used, any other LLDP implementation must be disabled on the host systems.
FCoE protocols supported 16 Ethernet jumbo frames The basic assumption underlying FCoE is that TCP/IP is not required in a local data center network and the necessary functions can be provided with Enhanced Ethernet. The purpose of an “enhanced” Ethernet is to provide reliable, lossless transport for the encapsulated Fibre Channel traffic. Enhanced Ethernet provides support for jumbo Ethernet frames and in-order frame delivery.
16 FCoE licensing FCoE licensing The FCoE license enables Fibre Channel over Ethernet (FCoE) functionality on the following supported DCB switches: • • • • Brocade 10 GbE 24-port 8 GbE 8 FC port switch Brocade VDX 6710, 6720, and 6730 switches Brocade VDX 8770-series switches Brocade VDX 2730 10 GbE connection blade for the Fujitsu PRIMERGY BX900 and BX400 Blade Servers Without the FCoE license, the DCB switches are pure Layer 2 Ethernet switches and do not allow FCoE bridging capabilities.
Save running configurations 16 3. Highlight the selected switch and click OK to start the configuration. The running configuration is saved to the selected switch, effective on the next system startup. If you restore the DCB switch using the Restore Switch Configuration dialog box, you are prompted to select one of two restoration methods: • As the running configuration and reboot Rebooting a switch connected to a fabric will stop all traffic to and from the switch.
16 DCB configuration management DCB configuration management Depending on the platform, the DCB switch has one of the configurations shown in Table 59.
Switch policies 16 Switch policies You can configure and enable a number of DCB policies on a switch, port, or link aggregation group (LAG). The following switch policy configurations apply to all ports in a LAG: • DCB map and Traffic Class map • Link Layer Discovery Protocol (LLDP) The switch policies are described in the following sections.
16 DCB Configuration DCB Configuration To launch the DCB Configuration dialog box, select Configure > DCB from the menu bar. The DCB Configuration dialog box displays, showing the status of all DCB-related hardware and functions. NOTE The Protocol Down Reason column, shown in Figure 150, displays the values only for the external ports of embedded platforms but not for the internal ports.
DCB Configuration 16 Creating a DCB map to carry the LAN and SAN traffic To create a DCB map to carry the LAN and SAN traffic, complete the following steps. NOTE This procedure is applicable for Fabric OS versions earlier than Fabric OS 7.0. For Fabric OS versions 7.0 and later, you can only edit the the default DCB map. 1. Select Configure > DCB. The DCB Configuration dialog box displays. 2. Select the switch to edit from the Products/Ports list and click Edit. The Edit Switch dialog box displays. 3.
16 DCB Configuration • CoS - Click the CoS cell to launch the Edit CoS dialog box, where you can select and assign one or more priorities (PG ID 15.0 through 15.7). All of the eight CoS values (0-7) must be used in a DCB map. Duplicate CoS values in two or more priority groups are not allowed. You can only edit CoS fields that are displayed with a green tick mark. % Bandwidth (optional) - While in the Edit CoS dialog box, enter a bandwidth value for PG IDs 15.0 to 15.7.
DCB Configuration 16 FIGURE 152 Edit Switch dialog box - LLDP-DCBX tab 4. Select the Global Configuration LLDP profile in the LLDP Profiles list. 5. Click the left arrow button to edit. 6. Select the FCoE Application and FCoE Logical Link check boxes in the Advertise list to advertise them on the network. 7. Click OK after changing the attributes of the current deployment. The Deployment Status dialog box displays. 8. Click Start on the Deployment Status dialog box to save the changes to the switch. 9.
16 DCB Configuration 8. Select the DCB map you created in “Creating a DCB map to carry the LAN and SAN traffic” on page 443 from the Available DCB Maps list. 9. Click the LLDP-DCBX tab and select the Enable LLDP-DCBX on Te Port Number check box. 10. Select Assign the Global Configuration. 11. Click OK. The Deploy to Ports dialog box displays. 12. Click OK after changing the attributes of the current deployment. The Deployment Status dialog box launches. 13.
DCB Configuration 16 Creating VLAN classifiers and activating on the DCB interface NOTE You can complete this procedure using the Management application for Fabric OS versions 7.0 and later. For Fabric OS versions earlier than Fabric OS 7.0, you must use the CLI. To create and activate the VLAN classifiers on the DCB interface, complete the following steps. 1. Log in to the switch and enter global configuration mode. switch:>cmsh switch#configure terminal 2.
16 DCB Configuration 2. Select the DCB switch or one or more DCB ports from the Products/Ports list to add to a link aggregation group (LAG). 3. Click Add LAG or Edit LAG. The Add LAG or Edit LAG dialog box displays, as shown in Figure 153. FIGURE 153 Add LAG dialog box 4. Configure the following LAG parameters: NOTE Ports with 802.1x authentication or ports that are enabled in L2 mode or L3 mode are not supported in a LAG. • LAG ID - Enter the LAG identifier, using a value from 1 through 63.
DCB Configuration 16 5. Select at least one available DCB port from the Available Members list and click the right arrow button to move it to the LAG Members list. The DCB ports are now part of the link aggregation group. 6. Continue to configure the following LAG parameters. These parameters are always enabled. • Type - Sets the limit on the size of the LAG. The type values include Standard, where the LAG is limited to 16 ports, and Brocade LAG, where the LAG is limited to 4 ports.
16 DCB Configuration FIGURE 154 Edit Switch dialog box 4. Configure the policies for the Edit Switch dialog box tabs, which are described in the following sections: • • • • • “QoS configuration” on page 455 “FCoE provisioning” on page 461 “VLAN classifier configuration” on page 463 “LLDP-DCBX configuration” on page 467 “802.1x authentication” on page 470 5. When you have finished configuring the policies, apply the settings to the switch.
DCB Configuration 16 Editing a DCB port 1. Select Configure > DCB. The DCB Configuration dialog box displays, showing the status of all DCB-related hardware and functions. 2. Select a DCB port from the Products/Ports list. 3. Click Edit. The Edit Port dialog box displays, as shown in Figure 155. FIGURE 155 Edit Port dialog box 4. Modify the following DCB port parameters as required: • Interface Mode - Select None or L2. For external ports, the L3 interface mode displays in addition to None or L2.
16 DCB Configuration 5. When you have finished configuring the policies, apply the settings to the DCB port. NOTE Clicking Cancel when there are pending changes launches a pop-up dialog box. 6. Click OK when you have finished modifying the DCB port parameters. The Deploy to Ports dialog box displays. 7. Click OK after changing the attributes of the current deployment. The Deployment Status dialog box launches. 8.
DCB Configuration 16 4. Configure the following LAG parameters, as required: NOTE Ports with 802.1x authentication or ports that are enabled in L2 mode or L3 mode are not supported in a LAG. • LAG ID - The LAG identifier, which is not an editable field. • Status - Click the Enable check box to enable the LAG. You must enable the LAG to use the DCB functionality. • Interface Mode - Select None or L2. For external ports, the L3 interface mode displays, in addition to None or L2.
16 DCB Configuration 8. Click Start on the Deployment Status dialog box to save the changes to the selected LAG or LAGs. NOTE If the primary or secondary IP address already exists on another interface, an error message displays in the Status area. 9. Click Close to close the Deployment Status dialog box. Enabling a DCB port or LAG If you select multiple switches or multiple ports and LAGs from two or more switches, both the Enable button and the Disable button are disabled. 1. Select Configure > DCB.
QoS configuration 16 QoS configuration QoS configuration involves configuring packet classification, mapping the priority and traffic class, controlling congestion, and scheduling. The configuration of these QoS entities consist of DCB Map and Traffic Class Map configuration. In a Data Center Bridging (DCB) configuration, Enhanced Transmission Selection (ETS) and priority-based flow control (PFC) are configured by utilizing a priority table, a priority group table, and a priority traffic table.
16 QoS configuration NOTE The 10 Gbps DCB/FC switch module can have only one DCB map. 1. Select Configure > DCB. The DCB Configuration dialog box displays, showing the status of all DCB-related hardware and functions. 2. Select a switch, and click Edit. 3. Click the QoS tab on the Edit Switch dialog box. The QoS dialog box displays, as shown in Figure 157. FIGURE 157 QoS, Create DCB Map dialog box 4. Select DCB from the Map Type list. 5.
QoS configuration 16 % Bandwidth (optional) - While in the Edit CoS dialog box, enter a bandwidth value for priority group (PG) IDs 15.0 through 15.7. You must map each CoS to at least one of the PG IDs. Note the following points: • You cannot define a bandwidth percentage for strict priorities (PG ID 15.0 - 15.7). The total bandwidth percentage for PG ID 15.0 through 15.7 must equal 0. • If you set a CoS value to one or more of the PG IDs 0-7, you must also enter a non-zero bandwidth percentage.
16 QoS configuration Deleting a DCB map You cannot delete the DCB map of a 10 Gbps DCB/FC switch module. To delete the DCB map of an 8 Gbps DCB switch, complete the following steps. 1. Select Configure > DCB. The DCB Configuration dialog box displays, showing the status of all DCB-related hardware and functions. 2. Select a switch, and click Edit. 3. Click the QoS tab on the Edit Switch dialog box. The QoS dialog box displays. 4. Select one or more DCB maps. 5. Click the left arrow button.
QoS configuration 16 4. Click the Assign a map to check box to assign the selected port to a DCB map. If you do not enable this check box, all QoS edit features are disabled. 5. Select DCB Map in the Map Type list. 6. Select a DCB map in the Available DCB Maps list. If no DCB maps were created on the switch, the Available DCB Maps list is empty. Otherwise, the following DCB map details display: • PG - ID—Lists the priority group ID (15.0 through 15.
16 QoS configuration 3. Click the QoS tab on the Edit Switch dialog box. The QoS dialog box displays. 4. Select a Traffic Class map from the Traffic Class Maps list and click the left arrow button to load its values to the left pane. The fields are now editable. If the name of the Traffic Class map already exists, an overwrite warning message displays. Click Yes to overwrite the existing Traffic Class map. 5. Keep the same Traffic Class map name and modify the values, as required. 6.
FCoE provisioning 16 3. Click the QoS tab on the Edit Port or Edit LAG dialog box. The QoS dialog box displays. 4. Click the Assign a map check box. 5. Select Traffic Class in the Map Type list. 6. Select a Traffic Class map in the Traffic Class Map list. 7. When you have finished the configuration, click OK to launch the Deploy to Ports/LAGs dialog box. Refer to “Switch, port, and LAG deployment” on page 473 for more information.
16 FCoE provisioning 3. Click the FCoE tab on the Edit Switch dialog box. The Edit Switch dialog box, FCoE tab displays the following FCoE map parameters: NOTE The FCoE tab does not display for the Brocade 8000 switch or the FCOE10-24 port blade. • Name—The name of the FCoE map that will be available for assignment to ports on this switch. This is a read-only field. • VLAN ID—Enter an FCoE VLAN identifier to associate with the FCoE map. The values range from 2 through 3583, and 1002 is the default.
VLAN classifier configuration 16 4. If enabled, click the Enable FCoE check box to disable the port’s membership on the FCoE map. 5. When you have finished the configuration, click OK to launch the Deploy to Ports dialog box. 6. Click OK after changing the attributes of the current deployment. The Deployment Status dialog box launches. 7. Click Start on the Deployment Status dialog box to save the changes to the selected devices.
16 VLAN classifier configuration FIGURE 158 Edit Switch dialog box, VLAN Classifiers tab 4. Click the Add button under the Available Rules list. The Add Rules dialog box displays, as shown in Figure 159. FIGURE 159 Add Rules dialog box The Rule ID field is pre-populated with the next available rule ID number. 5. Keep the rule ID number as it is, or change the number using a value from 1 through 256. 6. Select a rule type. Valid rule types are MAC (MAC address-based rule) and Proto (802.
VLAN classifier configuration 16 9. Click OK to add the rule to the Available Rules list on the VLAN Classifiers tab of the Edit Switch dialog box and close the Add Rules dialog box. NOTE Clicking Apply also adds the rule to the Available Rules list on the VLAN Classifiers tab of the Edit Switch dialog box, and in addition, the Add Rules dialog box remains open and clears all entries for you to define the next rule. 10.
16 VLAN classifier configuration Creating a VLAN classifier group You can assign existing rules to a selected VLAN classifier and form a VLAN classifier group. If no rules are available, you can add rules to a selected switch using the Add Rules dialog box. 1. Select Configure > DCB from the menu bar. The DCB Configuration dialog box displays, showing the status of all DCB-related hardware and functions. 2. Select a switch and click Edit. 3. Click the VLAN Classifiers tab on the Edit Switch dialog box.
LLDP-DCBX configuration 16 LLDP-DCBX configuration Link Layer Discovery Protocol (LLDP) provides a solution for the configuration issues caused by increasing numbers and types of network devices in a LAN environment, because, with LLDP, you can statically monitor and configure each device on a network.
16 LLDP-DCBX configuration Adding an LLDP profile NOTE When a TE port is selected to assign to an LLDP profile, a yellow banner displays with the following error message: “LLDP-DCBX is disabled on this switch. The configuration becomes functional when LLDP-DCBX is enabled on the switch.” 1. Select Configure > DCB. The DCB Configuration dialog box displays, showing the status of all DCB-related hardware and functions. 2. Select a switch, and click Edit. 3.
LLDP-DCBX configuration 16 Editing an LLDP profile 1. Select Configure > DCB. The DCB Configuration dialog box displays, showing the status of all DCB-related hardware and functions. 2. Select a switch, and click Edit. 3. Click the LLDP-DCBX tab on the Edit Switch dialog box. The LLDP-DCBX Profile dialog box displays. 4. Select an LLDP Profile in the LLDP Profile table. NOTE You can edit the profile. You cannot, however, delete or duplicate global configurations. 5.
16 802.1x authentication Assigning an LLDP profile to a port or ports in a LAG You create LLDP profiles using the Edit Switch dialog box, which you access from the DCB Configuration dialog box. Global configuration parameters, which is the default selection, are displayed in the Assigned Profile table. NOTE A yellow banner displayed on the LLDP-DCBX dialog box indicates that LLDP-DCBX is disabled on the switch. The configuration options become functional when LLDP-DCBX is enabled on the switch. 1.
802.1x authentication 16 Enabling 802.1x authentication 802.1x authentication is enabled or disabled globally on the switch using the Edit Switch dialog box. 1. Select Configure > DCB from the menu bar. The DCB Configuration dialog box displays, showing the status of all DCB-related hardware and functions. 2. Select a switch and click Edit. 3. Click the 802.1x tab on the Edit Switch dialog box. 4. Click the Enable 802.1x check box to enable 802.1x authentication, and click OK. 5. Configure the 802.
16 802.1x authentication FIGURE 161 802.1x dialog box 5. Configure the following 802.1x parameters: • Wait Period - The number of seconds the switch waits before sending an EAP request. The value range is 15 to 65535 seconds. The default value is 30. • Retry Count - The maximum number of times that the switch restarts the authentication process before setting the switch to an unauthorized state. The value range is 1 to 10. The default value is 2.
Switch, port, and LAG deployment 16 Switch, port, and LAG deployment The Deploy to Products, Deploy to Ports, and Deploy to LAGs dialog boxes provide the flexibility to commit DCB configurations either right away or at a scheduled time. These dialog boxes also allow you to commit the switch-level configuration changes to one or more target switches.
16 Switch, port, and LAG deployment FIGURE 163 Deploy to Ports dialog box FIGURE 164 Deploy to LAGs dialog box 474 Brocade Network Advisor SAN User Manual 53-1002696-01
Switch, port, and LAG deployment 16 4. Click one of the following deployment options: • • • • Deploy now Save and deploy now Save deployment only Schedule 5. Click one of the following save configuration options: • Save to running • Save to running and startup • Save to running and startup then reboot The name for the scheduled product deployment is pre-populated with a “DCB-MM-DD-YYYY-HR-MIN-SS” prefix. This is an editable field. 6. Provide a description for the product/port/LAG deployment. 7.
16 Switch, port, and LAG deployment For LAGs: • LAG attributes (Interface Mode, etc.) • QoS, DCB Map / Traffic Class Map • LLDP Profiles 9. Click to move the available targets selected for configuration deployment to the Selected Targets list. 10. Click OK. The Deployment Status dialog box launches. 11. Click Start on the Deployment Status dialog box to save the changes to the selected devices. 12. Click Close to close the Deployment Status dialog box.
DCB performance TABLE 61 16 Source to target switch Fabric OS version compatibility (Continued) Source Fabric OS version and device Target Fabric OS version supported Comments Brocade Converged 10 GbE switch module for IBM BladeCenter with Fabric OS 6.3.1_cee and 6.3.1_dcb Allows Brocade Converged 10 Gbe switch module for IBM BladeCenter with Fabric OS 6.3.1_cee, Fabric OS 6.3.1_dcb. Both source and target switches must support the FCoE map and VLAN classifiers.
16 DCB performance FIGURE 165 Real Time Performance Graphs dialog box - SAN tab For complete information about Real Time Performance Graphs, refer to “SAN real-time performance data” on page 903. Generating a real-time performance graph from the IP tab To generate a real-time performance graph for a NOS DCB switch, complete the following steps. 1. Click the IP tab. 2. Select a DCB port from the DCB Configuration dialog box, and select Real Time Graph from the Performance list.
DCB performance 16 Historical performance graph The Historical Performance Graph dialog box enables you to customize how you want the historical performance information to display. Generating a historical performance graph You can generate a historical performance graph by selecting FOS or NOS DCB devices from the SAN tab or the IP tab. 1. Select a DCB port from the DCB Configuration dialog box, and select Historical Graph from the Performance list.
16 FCoE login groups FIGURE 167 Historical Performance Report dialog box For complete information about Historical Performance Graphs, refer to “SAN Historical performance data” on page 907. FCoE login groups The FCoE Configuration dialog box allows you to manage the FCoE login configuration parameters on the DCB switches in all discovered fabrics. FCoE login configuration is created and maintained as a fabric-wide configuration.
FCoE login groups 16 FIGURE 168 FCoE Configuration dialog box 2. Perform one of the following tasks: Under Login Group: • Click Add to launch the Add Login Group dialog box, where you can select an existing switch or enter the WWN of a switch on which the FCoE login group will be created. See “Adding an FCoE login group” on page 481. • Click Edit to launch the Edit Login Group dialog box, where you can edit the login group parameters. See “Editing an FCoE login group” on page 483.
16 FCoE login groups FIGURE 169 Add Login Group dialog box 3. Select an existing switch from the Switch list, or enter the WWN of the switch that will be added to the FCoE login group. 4. Select one of the following Login Members options: • Allow all—Click to allow all login members into the Available Members list. • Allow specific—Click to allow specific login members into the Available Members list.
FCoE login groups 16 Editing an FCoE login group Complete the following steps to edit the name of a login group. You can manually add ports by entering the world wide name (WWN) or select available managed CNAs from all discovered hosts. Only directly-connected devices are supported. 1. Select Configure > FCoE from the menu bar. 2. Select a group from the Login Groups list and click Edit. The Edit Login Group dialog box displays, as shown in Figure 155.
16 FCoE login groups 7. Click Start to apply the changes, or click Close to abort the operation. On closing the FCoE Login Group Confirmation and Status dialog box, the FCoE Configuration Dialog refreshes the data and the latest information is displayed. Deleting one or more FCoE login groups 1. Select Configure > FCoE from the menu bar. or Right-click the DCB device and select FCoE. The FCoE Configuration dialog box displays. 2. Select a group from the Login Groups list and click Delete.
Virtual FCoE port configuration 16 3. The FCoE Login Group Configuration and Status dialog box displays. 4. Review the changes carefully before you accept them. 5. Click Start to apply the changes, or click Close to abort the operation. The FCoE login management feature is enabled on the selected switch. The value in the FCoE Login Management State column is Enabled after the FCoE Configuration dialog box refresh operation.
16 Virtual FCoE port configuration FIGURE 171 Virtual FCoE Ports dialog box 3. Select one or more virtual ports from the Ports list. 4. Perform one of the following tasks: • Click Enable to enable a selected virtual FCoE port from the Virtual FCoE Ports tab. • Click Disable to disable a selected virtual FCoE port from the Virtual FCoE Ports tab. • Click Connected Devices to view a list of FCoE virtual ports and to what they are directly connected. 5. Click Close to close the dialog box.
Virtual FCoE port configuration 16 4. Click Start to apply the changes, or click Close to abort the operation. On closing the DCB Confirmation and Status dialog box, the FCoE Configuration Dialog refreshes the data and the latest information about the FCoE ports are displayed.
16 488 Virtual FCoE port configuration Brocade Network Advisor SAN User Manual 53-1002696-01
Chapter Security Management 17 In this chapter • Layer 2 access control list management . . . . . . . . . . . . . . . . . . . . . . . . . . . 489 • Security configuration deployment. . . . . . . . . . . . . . . . . . . . . . . . . . . . . . . . 498 Layer 2 access control list management A Layer 2 access control list (ACL) enables you to filter traffic based on the information in the IP packet header using the MAC address and Ethernet type.
17 Layer 2 access control list management Creating a standard Layer 2 ACL configuration (Fabric OS) To create a standard Layer 2 ACL configuration, complete the following steps. 1. Select the device and select Configure > Security > Layer 2 ACL > Product. The Device_Name - Layer 2 ACL Configuration dialog box displays. 2. Select New from the Add list. The Device_Name - Layer 2 ACL Configuration dialog box displays. FIGURE 172 Device_Name - Layer 2 ACL Configuration (Standard) dialog box 3.
Layer 2 access control list management 17 11. Click OK on the Device_Name - Layer 2 ACL Configuration dialog box. The Deploy to Products - Layer 2 ACL dialog box displays. To save the configuration, refer to “Saving a security configuration deployment” on page 500 Editing a standard Layer 2 ACL configuration (Fabric OS) To create a standard Layer 2 ACL configuration on a Fabric OS device, complete the following steps. 1. Select the device and select Configure > Security > Layer 2 ACL > Product.
17 Layer 2 access control list management 4. To edit an existing ACL rule, complete the following steps. a. Select the rule you want to edit in the ACL Entries list and click the left arrow button. b. Complete step 5 through step 9 in “Creating a standard Layer 2 ACL configuration (Fabric OS)” on page 490. The updated ACL entry displays in the ACL Entries list. To edit additional ACL entries, repeat step 4. 5.
Layer 2 access control list management 17 5. Enter a sequence number for the ACL in the Sequence field. 6. Select Permit or Deny from the Action list. 7. In the Source list, select one of the following options: • Any • Host • MAC Selecting MAC or Host enables the Source field. Enter the source address on which the configuration filters traffic in the Source field. 8.
17 Layer 2 access control list management Editing an extended Layer 2 ACL configuration (Fabric OS) To edit an extended Layer 2 ACL configuration on a Fabric OS device, complete the following steps. 1. Select the device and select Configure > Security > Layer 2 ACL > Product. The Device_Name - Layer 2 ACL Configuration dialog box displays. 2. Select the ACL you want to edit in the ACLs list and click Edit. The Configuration_Name Edit Extended Layer 2 ACL Configuration dialog box displays. 3.
Layer 2 access control list management 17 5. To add a new ACL rule, complete step 4 through step 12 in “Creating an extended Layer 2 ACL configuration (Fabric OS)” on page 492. The new ACL entry displays in the ACL Entries list. To add additional ACL entries, repeat step 5. 6. To delete an existing ACL rule, select the rule you want to edit in the ACL Entries list and click the left arrow button. 7. Click OK on the Duplicate - Layer 2 ACL Configuration dialog box.
17 Layer 2 access control list management 4. Select the Assign ACL option and choose one of the following options from the first Assign ACL list: • Select ACLs on this Product to assign ACLs deployed on the product to the port. The second list is populated with the ACLs deployed on the switch or associated with a save deployment object. • Select ACLs bound to this port to assign ACLs bound to the interface to the port. The second list is populated with the ACLs bound to the interface.
Layer 2 access control list management 17 4. Click OK on the Layer 2 ACL Saved Configurations dialog box. The new ACL displays in the ACLs list. 5. Click OK on the Device_Name - Layer 2 ACL Configuration dialog box. The Deploy to Products - Layer 2 ACL dialog box displays.
17 Security configuration deployment Security configuration deployment Figure 175 shows the standard interface used to deploy security configurations. FIGURE 175 Deploy to Product/Ports dialog box Before you can deploy a security configuration, you must create the security configuration. For step-by-step instructions, refer to the following sections: Security Management enables you to configure, persist, and manage a security configuration as a “deployment configuration object”.
Security configuration deployment 17 Deploying a security configuration on demand To deploy a security configuration immediately, complete the following steps. FIGURE 176 Deploy to Product/Ports dialog box 1. Choose one of the following options: • Deploy now — Select to deploy the configuration immediately on the product or port without saving the deployment definition.
17 Security configuration deployment Saving a security configuration deployment To save a security configuration deployment, complete the following steps. FIGURE 177 Deploy to Product/Ports dialog box 1. Select the Save deployment only option to save the deployment definition for future deployment. 2. Select one of the following save configuration options: • Save to running — Select to update the running configuration; however, the deployment is not saved to the product’s flash memory.
Security configuration deployment 17 Scheduling a security configuration deployment To schedule a security configuration deployment, complete the following steps. FIGURE 178 Deploy to Product/Ports dialog box 1. Select Configure > Security > Layer 2 ACL > Product. The Device_Name - Layer 2 ACL Configuration dialog box displays. 2. Choose one of the following options: • Select New from the Add list. The Add - Layer 2 ACL Configuration dialog box displays. • Select an ACL in the list and click Edit.
17 Security configuration deployment 10. Choose one of the following options to configure the frequency at which deployment runs for the schedule: • To configure deployment to run only once, refer to “Configuring a one-time deployment schedule” on page 502. • To configure hourly deployment, refer to “Configuring an hourly deployment schedule” on page 502. • To configure daily deployment, refer to “Configuring a daily deployment schedule” on page 503.
Security configuration deployment 17 Configuring a daily deployment schedule To configure a daily deployment schedule, complete the following steps. Select Daily from the Frequency list. Select the time of day you want deployment to run from the Time (hh:mm) lists. Where the hour value is from 1 through 12, the minute value is from 00 through 59, and the day or night value is AM or PM.
17 504 Security configuration deployment Brocade Network Advisor SAN User Manual 53-1002696-01
Chapter 18 FC-FC Routing Service Management In this chapter • Devices that support Fibre Channel routing . . . . . . . . . . . . . . . . . . . . . . . . • Fibre Channel routing overview . . . . . . . . . . . . . . . . . . . . . . . . . . . . . . . . . . • Guidelines for setting up Fibre Channel routing . . . . . . . . . . . . . . . . . . . . . • Connecting edge fabrics to a backbone fabric . . . . . . . . . . . . . . . . . . . . . . • Configuring routing domain IDs . . . . . . . . . . . . . . . . . . . .
18 Fibre Channel routing overview • Any of the following blades on a Backbone chassis: - 4 Gbps Router, Extension Blade - FC 8 GB 16-port Blade - FC 8 GB 32-port Blade - FC 8 GB 32-port Enhanced Blade (16 Gbps 4-slot or 16 Gbps 4-slot Backbone Chassis only) - FC 8 GB 48-port Blade - The shared ports area (ports 16-47) cannot be used as EX_Ports.
Guidelines for setting up Fibre Channel routing 18 Figure 179 on page 507 shows a metaSAN with a backbone fabric and three edge fabrics. The backbone consists of one 4 Gbps Router, Extension Switch connecting hosts in Edge fabrics 1 and 3 with storage in Edge fabric 2 and the backbone fabric.
18 Connecting edge fabrics to a backbone fabric Connecting edge fabrics to a backbone fabric The following procedure explains how to set up FC-FC routing on two edge fabrics connected through an FC router using E_Ports and EX_Ports. NOTE To configure an EX_Port, switches running Fabric OS 7.0.0 or earlier must have an FCR license. Switches running Fabric OS 7.0.1 or later configured in Brocade Native mode (IM0) or Brocade NOS mode (IM5) do not require an FCR license.
Connecting edge fabrics to a backbone fabric 18 FIGURE 180 Router Configuration-Connect Edge Fabric dialog box 3. Select the FC router from the Available Routers list. 4. Click the right arrow button to move the FC router you selected to the Selected Router list. 5. Select a valid fabric ID from the Fabric ID list. You can choose any unique fabric ID as long as it is consistent for all EX_Ports that connect to the same edge fabric.
18 Configuring routing domain IDs 9. Configure LSAN zones in each fabric that will share devices. For specific instructions, refer to “Configuring LSAN zoning” on page 739. Configuring routing domain IDs Logical (phantom) domains are automatically created to enable routed fabrics. Two types of logical domains are created: • A front domain is created in edge fabrics for every interfabric link (IFL). • A translate (Xlate) domain is created in routed fabrics that share devices.
Chapter Virtual Fabrics 19 In this chapter • Virtual Fabrics overview . . . . . . . . . . . . . . . . . . . . . . . . . . . . . . . . . . . . . . . . 511 • Virtual Fabrics requirements . . . . . . . . . . . . . . . . . . . . . . . . . . . . . . . . . . . . 512 • Configuring Virtual Fabrics . . . . . . . . . . . . . . . . . . . . . . . . . . . . . . . . . . . . . .
19 Virtual Fabrics requirements Terminology for Virtual Fabrics Table 62 lists definitions of Virtual Fabrics terms. TABLE 62 Virtual Fabrics terms Term Definition Physical chassis The physical switch or chassis from which you create logical switches and fabrics. Logical switch A collection of ports that act as a single Fibre Channel (FC) switch. When Virtual Fabrics is enabled on the chassis, there is always at least one logical switch: the default logical switch.
Virtual Fabrics requirements 19 • Discover a Virtual Fabrics-enabled seed physical chassis running Fabric OS 6.2.0 or later with Virtual Fabrics enabled, and at least one logical switch defined on the core switch. The physical chassis displays as a virtual switch. • Upgrade a physical chassis already in your SAN to Fabric OS 6.2.0 or later. Virtual Fabrics is disabled by default. This switch displays as a legacy switch. Once upgraded, you must enable Virtual Fabrics.
19 Configuring Virtual Fabrics TABLE 64 Blade and port types supported on logical switches for backbone chassis (Continued) Logical switch Base switch • • • • • • • • • • Extension Blade—GE_Ports and VE_Ports FC 8 GB Port Blade—E_Ports and F_Ports FC 16 GB Port Blade—E_Ports and F_Ports 8 Gbps Extension Blade - FC ports: E_Ports, F_Ports, and VE_Ports - GE ports: VE_Ports 8-slot and 4-slot Backbone Chassis— ICL ports Extension Blade—GE_Ports and VEX_Ports FC 8 GB Port Blade—E_Ports and EX_Ports FC 16
Configuring Virtual Fabrics 19 3. Set up logical switches in each physical chassis. a. Create logical switches in each physical chassis and assign ports to them. Make sure the logical switches are configured to allow XISL use. Refer to “Creating a logical switch or base switch” on page 516 for instructions. b. Disable all of the logical switches in each physical chassis. Right-click each logical switch in the Connectivity Map or Product List and select Enable/Disable > Disable. c.
19 Configuring Virtual Fabrics Creating a logical switch or base switch Before you can create a logical switch, you must enable Virtual Fabrics on at least one physical chassis in your fabric. Optionally, you can define the logical switch to be a base switch. Each chassis can have only one base switch. NOTE The 8 Gbps Extension Switch does not support base switches. 1. Select Configure > Virtual Fabric > Logical Switches. The Logical Switches dialog box displays.
Configuring Virtual Fabrics 19 The New Logical Switch dialog box displays. FIGURE 184 New Logical Switch dialog box 5. Click the Fabric tab and enter fabric-wide parameters. a. Enter a fabric identifier in the Logical Fabric ID field. This assigns the new logical switch to a logical fabric. If the logical fabric does not exist, this creates a new logical fabric as well as assigning the new logical switch. b.
19 Configuring Virtual Fabrics e. (Optional) For Backbone Chassis only, select an option in the 256 Area Limit list to use 256-area addressing mode (zero-based or port-based) or to disable this mode (default). The 256-area addressing mode can be used in FICON environments, which have strict requirements for 8-bit area FC addresses. 6. Click the Switch tab and enter switch parameters. a. Enter a name for the logical switch in the Name field. b. Select a domain ID in the Preferred Domain ID list.
Configuring Virtual Fabrics 19 Assigning ports to a logical switch A port can be assigned to only one logical switch. All ports are initially assigned to the default logical switch. When you create a logical switch, it has no ports and you must explicitly assign ports to it. When you assign a port to a logical switch, it is removed from the original logical switch and assigned to the new logical switch. 1. Select Configure > Virtual Fabric > Logical Switches. The Logical Switches dialog box displays. 2.
19 Configuring Virtual Fabrics 5. Click the left arrow button. A message displays indicating that the ports will be moved to the default logical switch. 6. Click OK on the warning message. The selected ports are removed from the logical switch and automatically reassigned to the default logical switch. The selected ports are highlighted in the Ports list. 7. (Optional) Perform the following steps to assign the ports to a logical switch other than the default logical switch. a.
Configuring Virtual Fabrics 19 NOTE Ports are disabled before moving from one logical switch to another. 6. (Optional) Select the Unbind Port Addresses while moving them check box. 7. Click Start to send these changes to the affected chassis. NOTE Most changes to logical switches will disrupt data traffic in the fabric. The status of each change is displayed in the Status column and Status area in the dialog box. 8. When the changes are complete, click Close.
19 Configuring Virtual Fabrics Leave this check box blank to allow the domain ID to be changed if a duplicate address exists. 8. Click OK on the New Logical Fabric Template dialog box. The new logical fabric template displays under the Discovered Logical Switches node in the Existing Logical Switches list (already highlighted). All of the logical fabric templates have the same name, “NewFabric”. You can differentiate among the templates by the FID number.
Configuring Virtual Fabrics 19 Moving a logical switch to a different fabric You can move a logical switch from one fabric to another by assigning a different fabric ID. 1. Select Configure > Virtual Fabric > Logical Switches. The Logical Switches dialog box displays. 2. Right-click anywhere in the Existing Logical Switches list and select Table > Expand All. 3. Select the logical switch you want to move to another logical fabric. 4. Click Edit. The Edit Properties dialog box displays. 5.
19 Configuring Virtual Fabrics 2. Right-click anywhere in the Existing Logical Switches list and select Table > Expand All. 3. Select the logical switch you want to change to a base switch. 4. Click Edit. The Edit Properties dialog box displays. 5. Clear the Base Fabric for Transport check box. This check box is applicable only to logical switches that are not base switches. 6. Select the Base Switch check box. 7. Click OK on the Edit Properties dialog box.
Chapter 20 SAN Encryption Configuration In this chapter • Encryption Center features . . . . . . . . . . . . . . . . . . . . . . . . . . . . . . . . . . . . . . • Encryption user privileges. . . . . . . . . . . . . . . . . . . . . . . . . . . . . . . . . . . . . . . • Smart card usage . . . . . . . . . . . . . . . . . . . . . . . . . . . . . . . . . . . . . . . . . . . . . • Network connections. . . . . . . . . . . . . . . . . . . . . . . . . . . . . . . . . . . . . . . . . . . • Blade processor links .
20 Encryption Center features • Redirection zones . . . . . . . . . . . . . . . . . . . . . . . . . . . . . . . . . . . . . . . . . . . . . • Disk device decommissioning . . . . . . . . . . . . . . . . . . . . . . . . . . . . . . . . . . . • Rekeying all disk LUNs manually . . . . . . . . . . . . . . . . . . . . . . . . . . . . . . . . . • Thin provision LUNs . . . . . . . . . . . . . . . . . . . . . . . . . . . . . . . . . . . . . . . . . . . . • Viewing time left for auto rekey . . . . . . . . . . . . .
Encryption user privileges 20 • “Blade processor links” on page 539 describes the steps for interconnecting encryption switches or blades in an encryption group through a dedicated LAN. This must be done before the encryption engines are enabled. Security parameters and certificates cannot be exchanged if these links are not configured and active.
20 Smart card usage TABLE 65 Encryption privileges (Continued) Privilege Read/Write Storage Encryption Security • • • • • • • • • • • • Launch the Encryption center dialog box. View switch, group, or engine properties. View Encryption Group Properties Security tab. View LUN centric view. View all rekey sessions. View encryption targets, hosts, and LUNs. Create a master key. Backup a master key. Edit smart card.
Smart card usage 20 • Establishing a trusted link with the NetApp LKM/SSKM key vault. • Decommissioning a LUN. When a quorum of authentication cards is registered for use, authentication must be provided before you are granted access. Registering authentication cards from a card reader To register an authentication card or a set of authentication cards from a card reader, have the cards physically available.
20 Smart card usage 3. Locate the Authentication Card Quorum Size and select the quorum size from the list. The quorum size is the minimum number of cards necessary to enable the card holders to perform the security sensitive operations listed above. The maximum quorum size is five cards. The actual number of authentication cards registered is always more than the quorum size, so if you set the quorum size to five, for example, you will need to register at least six cards in the subsequent steps.
Smart card usage 20 Registering authentication cards from the database Smart cards that are already in the Management program’s database can be registered as authentication cards. 1. Select Configure > Encryption from the menu task bar to display the Encryption Center dialog box (Refer to Figure 185 on page 526). 2. Select an encryption group from the Encryption Center Devices table, then select Group > Security from the menu task bar to display the Encryption Group Properties dialog box.
20 Smart card usage Deregistering an authentication card Authentication cards can be removed from the database and the switch by deregistering them. Complete the following procedure to deregister an authentication card. 1. Select Configure > Encryption from the menu task bar to display the Encryption Center dialog box (Refer to Figure 185 on page 526). 2.
Smart card usage 20 Using system cards System cards are smart cards that can be used to control activation of encryption engines. You can choose whether the use of a system card is required or not. Encryption switches and blades have a card reader that enables the use of a system card. System cards discourage theft of encryption switches or blades by requiring the use of a system card at the switch or blade to enable the encryption engine after a power off.
20 Smart card usage Enabling or disabling the system card requirement To use a system card to control activation of an encryption engine on a switch, you must enable the system card requirement. If a system card is required, it must be read by the card reader on the switch. You access the system card GUI from the Security tab. Complete the following procedure to enable or disable the system card requirement. 1.
Smart card usage 20 Deregistering system cards System cards can be removed from the database by deregistering them. Use the following procedure to deregister a system card: 1. Select Configure > Encryption from the menu task bar to display the Encryption Center dialog box. (Refer to Figure 185 on page 526.) 2. Select the switch from the Encryption Center Devices table, then select Switch > System Cards from the menu task bar. The System Cards dialog box displays. (Refer to Figure 190 on page 533.) 3.
20 Smart card usage • Usage: Usage content varies based on the card type. • For Authentication cards, the Usage column shows the number of groups for which the card is registered. • For System cards, the Usage column shows the number of encryption engines for which the card is registered. • For Recovery cards, the Usage column shows the group name and the creation date. • First Name: The first name of the person (up to 64 characters) to whom the smart card is assigned.
Smart card usage 20 FIGURE 191 Smart Card asset tracking dialog box 3. Select a smart card from the table, then do one of the following: • Click Delete to remove the smart card from the Management application database. Deleting smart cards from the Management application database keeps the Smart Cards table at a manageable size, but does not invalidate the smart card. The smart card can still be used. You must deregister a smart card to invalidate its use.
20 Smart card usage Editing smart cards Smart cards can be used for user authentication, master key storage and backup, and as a system card for authorizing use of encryption operations. 1. From the Encryption Center dialog box, select Smart Card > Edit Smart Card from the menu task bar to display the Edit Smart Card dialog box (Figure 192). FIGURE 192 Edit Smart Card dialog box 2. Insert the smart card into the card reader. 3.
Network connections 20 Network connections Before you use the encryption setup wizard for the first time, you must have the following required network connections: • The management ports on all encryption switches and 8-slot Backbone Chassis CPs that have Encryption Blades installed must have a LAN connection to the SAN management program, and must be available for discovery.
20 Encryption node initialization and certificate generation Configuring blade processor links To configure blade processor links, complete the following steps: 1. Select Configure > Encryption from the menu task bar to display the Encryption Center dialog box. (Refer to Figure 185 on page 526.) 2. Select the encryption engine from the Encryption Center Devices table, then select Engine > Blade Processor Link from the menu task bar to display the Blade Processor Link dialog box (Figure 193).
Key Management Interoperability Protocol 20 Setting encryption node initialization Encryption nodes are initialized by the Configure Switch Encryption wizard when you confirm a configuration. Encryption nodes may also be initialized from the Encryption Center dialog box. 1. Select a switch from the Encryption Center Devices table, then select Switch > Init Node from the menu task bar. 2. Select Yes after reading the warning message to initialize the node.
20 Supported encryption key manager appliances HA support should be set before you register the key vault. Three settings are supported; however, certain settings are determined by the compliant key vault type that is being used: • Transparent: The client assumes the entire HA is implemented on the key vault. Key archival and retrieval is performed without any additional hardening checks. • Opaque: The primary and secondary key vaults are both registered on the Fabric OS encryption switch.
Supported encryption key manager appliances 20 The following key vault types are supported: • RSA Data Protection Manager (DPM): If an encryption group contains mixed firmware nodes, the Encryption Group Properties Key Vault Type name is based on the firmware version of the group leader. For example, If a switch is running Fabric OS 7.1.0 or later, the Key Vault Type is displayed as “RSA Data Protection Manager (DPM).”If a switch is running a Fabric OS version prior to v7.1.
20 Steps for connecting to a DPM appliance Steps for connecting to a DPM appliance All switches that you plan to include in an encryption group must have a secure connection to the RSA Data Protection Manager (DPM). The following is a suggested order of steps needed to create a secure connection to the DPM. NOTE The Fabric OS encryption switch uses the manual enrollment of identities with client registration to connect with DPM 3.x servers.
Steps for connecting to a DPM appliance 20 4. Do one of the following: • If a CSR is present, click Export. • If a CSR is not present, select a switch from the Encryption Center Devices table, then select Switch > Init Node from the menu task bar. This generates switch security parameters and certificates, including the KAC CSR. 5. Save the file. The default location for the exported file is in the Documents folder. NOTE The CSR is exported in Privacy Enhanced Mail (.pem) format.
20 Steps for connecting to a DPM appliance In the example above, the certificate validity is active until “Dec 4 18:03:14 2010 GMT.” After the KAC certificate has expired, the registration process must be redone. NOTE In the event that the signed KAC certificate must be re-registered, you will need to log in to the key vault web interface and upload the new signed KAC certificate for the corresponding Fabric OS encryption switch Identity.
Steps for connecting to a DPM appliance 7. 20 Open another web browser window, and start the RSA management user interface. You will need the URL, and have the proper authority level, user name, and password. NOTE The Identity Group name used in the next step might not exist in a freshly installed DPM. To establish an Identity Group name, click the Identity Group tab, and create a name. The name Hardware Retail Group is used as an example in the following steps. 8. Select the Key Classes tab.
20 Steps for connecting to a DPM appliance Uploading the KAC certificate onto the DPM appliance (manual identity enrollment) NOTE The Fabric OS encryption switch will not use the Identity Auto Enrollment feature supported with DPM 3.x servers. You must complete the identity enrollment manually to configure the DPM 3.x server with the Fabric OS encryption switch as described in this section. You need to install the switch public key certificate (KAC certificate).
Steps for connecting to an LKM/SSKM appliance 20 . FIGURE 195 Encryption Group Properties with Key Vault Certificate 2. Select Load from File and browse to the location on your client PC that contains the downloaded CA certificate in .pem format. Steps for connecting to an LKM/SSKM appliance The NetApp KeySecure Lifetime Key Manager (LKM) and Storage Secure Key Manager (SSKM) reside on an FIPS 140-2 Level 3-compliant network appliance.
20 Steps for connecting to an LKM/SSKM appliance 5. If required, create an LKM/SSKM cluster for high availability. Refer to “LKM/SSKM key vault high availability deployment” on page 552.
Steps for connecting to an LKM/SSKM appliance 20 5. If you are using the Management application, the path to the file must be specified ion the Select Key Vault dialog box when creating a group leader. If the proper path is entered, the file is imported. Exporting and registering the switch KAC certificates on LKM/SSKM 1. Select Configure > Encryption from the menu task bar to display the Encryption Center dialog box (Refer to Figure 185 on page 526). 2.
20 Steps for connecting to an LKM/SSKM appliance Establishing the trusted link You must generate the trusted link establishment package (TEP) on all nodes to obtain a trusted acceptance package (TAP) before you can establish a trusted link between each node and the NetApp LKM/SSKM appliance. 1. Select Configure > Encryption from the menu task bar to display the Encryption Center dialog box. (Refer to Figure 185 on page 526.) 2.
Steps for connecting to an LKM/SSKM appliance 20 When dual LKM/SSKMs are used with the encryption switch or blade, the dual LKM/SSKMs must be clustered. There is no enforcement done at the encryption switch or blade to verify whether or not the dual LKM/SSKMs are clustered, but key creation operations will fail if you register non-clustered dual LKM/SSKMs with the encryption switch or blade.
20 Steps for connecting to an ESKM/SKM appliance LKM/SSKM key vault deregistration Deregistration of either the primary or secondary LKM/SSKM key vault from an encryption switch or blade is allowed independently. • Deregistration of Primary LKM/SSKM: You can deregister the Primary LKM/SSKM from an encryption switch or blade without deregistering the backup or secondary LKM/SSKM for maintenance or replacement purposes.
Steps for connecting to an ESKM/SKM appliance 20 6. Enable an SSL connection. Refer to “Enabling SSL on the Key Management System (KMS) Server” on page 560. 7. Configure a cluster of ESKM/SKM appliances for high availability. Refer to: • “Creating an ESKM/SKM High Availability cluster” on page 560. • “Copying the local CA certificate for a clustered ESKM/SKM appliance” on page 561 • “Adding ESKM/SKM appliances to the cluster” on page 561 8.
20 Steps for connecting to an ESKM/SKM appliance Registering the ESKM/SKM Brocade group user name and password The Brocade group user name and password you created when configuring a Brocade group on ESKM/SKM must also be registered on each encryption node. NOTE This operation can be performed only after the switch is added to the encryption group. 1. Select Configure > Encryption from the menu task bar to display the Encryption Center dialog box (Refer to Figure 185 on page 526). 2.
Steps for connecting to an ESKM/SKM appliance 20 • If you change the user name and password, the keys created by the previous user become inaccessible. The Brocade group user name and password must also be changed to the same values on ESKM/SKM to make the keys accessible.
20 Steps for connecting to an ESKM/SKM appliance FIGURE 198 Creating an HP ESKM/SKM local CA 5. Under Certificates & CAs, select Trusted CA Lists to display the Trusted Certificate Authority List Profiles. 6. Click on Default under Profile Name. 7. In the Trusted Certificate Authority List, click Edit. 8. From the list of Available CAs in the right panel, select the CA you just created. Repeat these steps any time another local CA is needed.
Steps for connecting to an ESKM/SKM appliance 20 Creating and installing the ESKM/SKM server certificate To create the ESKM/SKM server certificate, complete the following steps: 1. Click the Security tab. 2. Under Certificates and CAs, select Certificates. 3. Enter the required information under Create Certificate Request. - Enter a Certificate Name and Common Name. The same name may be used for both. Enter your organizational information.
20 Steps for connecting to an ESKM/SKM appliance 17. Select the server certificate name you just created from the certificate list, and select Properties. The Certificate Request Information window displays. 18. Click Install Certificate. The Certificate Installation window displays. 19. Paste the signed certificate data you copied under Certificate Response, then click Save. The status of the server certificate should change from Request Pending to Active.
Steps for connecting to an ESKM/SKM appliance 20 4. For Local Port, use the default value of 9001 unless you are explicitly directed to use a different value for your site. 5. Type the cluster password in the Create Cluster section of the main window to create the new cluster, then click Create. 6. In the Cluster Settings section of the window, click Download Cluster Key and save the key to a convenient location, such as your computer's desktop.
20 Steps for connecting to an ESKM/SKM appliance 9. Click Save. 10. Select the Device tab. 11. In the Device Configuration menu, click Cluster. 12. Click Join Cluster. In the Join Cluster section of the window, leave Local IP and Local Port set to their default settings. 13. Enter the original cluster member’s local IP address into Cluster Member IP. 14. Enter the original cluster member’s local Port into Cluster Member Port. 15. Click Browse, then select the Cluster Key File you saved. 16.
Steps for connecting to an ESKM/SKM appliance 20 12. Paste the file contents that you copied in step 3 in the Certificate Request Copy area. 13. Select Sign Request. 14. Download the signed certificate to your local system as signed_kac_eskm_cert.pem or signed_kac_skm_cert.pem, depending on your key vault type. This file is ready to be imported to the encryption switch or blade.
20 Steps for connecting to an ESKM/SKM appliance Disk keys and tape pool keys support DEK creation, retrieval, and update for disk and tape pool keys are as follows: • DEK creation: The DEK is first archived to the virtual IP address of the ESKM/SKM cluster. The request gets routed to the primary or secondary ESKM/SKM, and is synchronized with other ESKMs or SKMs in the cluster.
Steps for connecting to a TEKA appliance 20 Steps for connecting to a TEKA appliance TEKA provides a web user interface for management of clients, keys, admins, and configuration parameters. A Thales officer creates domains, groups, and managers (a type of administrator), assigns groups to domains, and assigns managers to manage groups. Managers are responsible for creating clients and passwords for the groups they manage.
20 Steps for connecting to a TEKA appliance 1. Log in to the Thales management program as admin and select the Network tab (Figure 200). FIGURE 200 TEKA Network Settings 2. Enter the management IP address information under Management Interface. 3. Enter the client IP address information under KM Server Interface. 4. Enter a host name for the appliance, Internet or intranet domain, and, if used, the primary and secondary DNS IP address under Common Settings. 5. Set Service Settings.
Steps for connecting to a TEKA appliance 20 Creating a client on TEKA This step assumes the group brocade has been created by an administrator. If the group brocade does not exist, you must log in to TEKA as officer, create the group, and assign the group to a manager. 1. From the Encryption Center Devices table, select a switch that needs to have a TEKA Client, then select Properties. 2. Click Key Vault User Name. The Key Vault User Information dialog box displays (Figure 201).
20 Steps for connecting to a TEKA appliance 9. Select the group brocade from the group pull-down menu, then click Add Client. A TEKA client user is created and is listed in the table. Establishing TEKA key vault credentials on the switch The credentials established for the TEKA client must be presented to TEKA by the switch. 1. From the Encryption Center Devices table, select a switch, then select Switch > Key Vault Credentials from the menu task bar.
Steps for connecting to a TEKA appliance 20 Signing the encryption node KAC CSR on TEKA The KAC certificate signing request (KAC CSR) generated when the encryption node is initialized must be exported for each encryption node and signed by the local CA on TEKA. The signed certificate must then be imported back into the encryption node. 1. From the Encryption Center, select Switch > Export Certificate. The Export Switch Certificate dialog box displays. 2.
20 Steps for connecting to a TKLM appliance Steps for connecting to a TKLM appliance All switches you plan to include in an encryption group must have a secure connection to the Tivoli Key Lifecycle Manager (TKLM). A local LINUX host must be available to transfer certificates. NOTE Ensure that the time zone and clock time setting on the TKLM server and encryption nodes are the same. A difference of only a few minutes can cause the TLS connectivity to fail.
Steps for connecting to a TKLM appliance 20 Exporting the Fabric OS node self-signed KAC certificates Each Fabric OS node generates a self-signed KAC certificate as part of the node initialization process as described under “Encryption node initialization and certificate generation”. These certificates must be exported from each switch and stored on a local LINUX host to make them available for importing to TKLM. 1.
20 Steps for connecting to a TKLM appliance Creating a self-signed certificate for TKLM You must create a self-signed certificate for TKLM that can be downloaded to the Fabric OS encryption engines to verify the authenticity of TKLM. 1. Select Tivoli Key Lifecycle Manager > Configuration. The Configuration page displays. 2. Select Create self-signed certificate. 3. Under Certificate label in key store, enter a certificate label. 4. Under Certificate description (common name), enter a descriptive name. 5.
Steps for connecting to a TKLM appliance 20 For Windows: \ibm\tivoli\tiptklmV2\bin\wsadmin.bat -username TKLMAdmin -password -lang jython 2. Check the certificate list using the following command: print AdminTask.tklmCertList('[]') The listing will contain the UUID for all certificates. Use the UUID of the server certificate to export the server certificate from the database to the file system. print AdminTask.
20 Steps for connecting to a KMIP appliance (SafeNet KeySecure) Steps for connecting to a KMIP appliance (SafeNet KeySecure) With the introduction of Fabric OS 7.1.0, the Key Management Interoperability Protocol (KMIP) KeySecure Management Console can be used on the Fabric OS encryption switch. Any KMIP-compliant server can be reregistered as a KMIP key vault. NOTE Currently, only KMIP with SafeNet KeySecure for Key Management (SSKM) native hosting LKM is supported.
Steps for connecting to a KMIP appliance (SafeNet KeySecure) 20 Setting FIPS compliance 1. From the KeySecure Management Console, select the Security tab, then select Advanced Security, > High Security. The High Security Configuration page displays (Figure 206). FIGURE 206 KeySecure High Security Configuration page 2. Under FIPS Compliance, set FIPS Compliance to Yes. This ensures that only TLS 1.0 connections are supported between the Fabric OS encryption switch and the KeySecure.
20 Steps for connecting to a KMIP appliance (SafeNet KeySecure) Creating a local CA 1. From the KeySecure Management Console, select the Security tab, then select CAs & SSL Certificates > Local CAs. The Certificate and CA Configuration page displays (Figure 207). FIGURE 207 KeySecure Certificate and CA Configuration - Create Local Certificate Authority 2. Under Create Local Certificate Authority, enter the organization information in the fields provided, then click Create.
Steps for connecting to a KMIP appliance (SafeNet KeySecure) 20 Creating a server certificate 1. From the Security tab, select CAs & SSL Certificates > SSL Certificates. The Certificate and CA Configuration page displays (Figure 209). FIGURE 209 KeySecure Certificate and CA Configuration page 2. Under Create Certificate Request, enter your organization information in the fields provided, then click Create Certificate Request. (The example is using “Safenet75ServerCert” as the server certificate name.
20 Steps for connecting to a KMIP appliance (SafeNet KeySecure) FIGURE 210 KeySecure Certificate and CA Configuration - Certificate List 4. Click on the server certificate name you just created (Safenet75ServerCert), which will display the certificate contents (Figure 211). FIGURE 211 KeySecure Certificate and CA Configuration page - Certificate Request Information 5. Copy the certificate contents.
Steps for connecting to a KMIP appliance (SafeNet KeySecure) 20 6. From the Security tab, select CAs & SSL Certificates > Local CAs. The Certificate and CA Configuration page displays (Figure 212). FIGURE 212 KeySecure Certificate and CA Configuration - Local Certificate Authority List 7. Under Local Certificate Authority List, select the local CA certificate you just created (SafeNetCA), then click Sign Request. The Sign Certificate Request dialog box displays (Figure 213).
20 Steps for connecting to a KMIP appliance (SafeNet KeySecure) 9. Paste the server certificate contents that you copied (refer to step 5) in the Certificate Request text box, then click Sign Request. The Certificate and CA Configuration page refreshes and the certificate information is displayed under Certificate Request Information (Figure 214). FIGURE 214 KeySecure Certificate and CA Configuration - Certificate Request Information 10.
Steps for connecting to a KMIP appliance (SafeNet KeySecure) 20 13. Paste the server certificate request contents in the Certificate Installation text box, then click Save (Figure 215). FIGURE 215 KeySecure Certificate and CA Configuration - Certificate Installation After the page refreshes, the new certificate information is displayed in the Certificate List table (Figure 216). 14. Verify the server certificate status is shown as Active.
20 Steps for connecting to a KMIP appliance (SafeNet KeySecure) Creating a cluster 1. From the KeySecure Management Console, select the Device tab, then select Device Configuration > Cluster. The Cluster Configuration page displays (Figure 217). FIGURE 217 KeySecure Cluster Configuration page 2. Under Create Cluster, enter a user-defined password in the fields provided, then click Create.
Steps for connecting to a KMIP appliance (SafeNet KeySecure) 20 FIGURE 218 KeySecure Cluster Configuration page 4. Under Cluster Settings, click Download Cluster Key (Figure 219). You will be prompted to enter a local file name.
20 Steps for connecting to a KMIP appliance (SafeNet KeySecure) Signing the encryption node KAC CSR on KMIP The KAC certificate signing request generated when the encryption node is initialized must be exported for each encryption node and signed by the Brocade local CA on KMIP. The signed certificate must then be imported back into the encryption node. 1. Select Configure > Encryption from the menu task bar to display the The Encryption Center dialog box (Refer to Figure 185 on page 526). 2.
Steps for connecting to a KMIP appliance (SafeNet KeySecure) 20 FIGURE 220 Certificate and CA Configuration page - Sign Certificate Request 9. Select Sign with Certificate Authority from the drop-down list. (The example is using “SafeNetCA (maximum of 3550 days)”. 10. Select Client as Certificate Purpose. 11. Set Certificate Duration. Default is 3649 days (recommended). 12. Paste the file contents that you copied in step 3 in the Certificate Request area. 13. Select Sign Request. 14.
20 Steps for connecting to a KMIP appliance (SafeNet KeySecure) The Import Signed Certificate dialog box displays (Figure 221). FIGURE 221 Import Signed Certificate dialog box 3. Browse to the location where the signed certificate is stored, then click OK. The signed certificate is stored on the switch. Backing up the certificates 1. From the KeySecure Management Console, select the Device tab, then select Maintenance > Backup & Restore > Create Backup. The Backup and Restore page displays (Figure 222).
Steps for connecting to a KMIP appliance (SafeNet KeySecure) 20 FIGURE 223 Backup and Restore - Device items 5. Select the items for backup, then click Continue. The Create Backup dialog box displays (Figure 224), which is used for setting backup details. FIGURE 224 Backup and Restore - Backup details 6. Enter backup details in the fields provided, then click Backup to initiate the backup process. 7. Restore this backup file on the secondary clustered SSKM server.
20 Steps for connecting to a KMIP appliance (SafeNet KeySecure) Configuring the KMIP server 1. From the KeySecure Management Console, select the Device tab, then select Device Configuration > Key Server > Key Server. The Cryptographic Key Server Configuration page displays (Figure 225). FIGURE 225 KeySecure Cryptographic Key Server Configuration page 2. Under Cryptographic Key Server Settings, select KMIP as the protocol. 3. Ensure that the Use SSL check box is selected. 4.
Steps for connecting to a KMIP appliance (SafeNet KeySecure) 20 Adding a node to the cluster Perform the following steps on the secondary KeySecure node when adding it to the cluster. 1. From the KeySecure Management Console, select the Device tab, then select Device Configuration > Cluster. The Cluster Configuration page displays (Figure 226). FIGURE 226 KeySecure Cluster Configuration page 2. Under Join Cluster, enter the cluster information that you configured for the primary KeySecure node.
20 Steps for connecting to a KMIP appliance (SafeNet KeySecure) FIGURE 227 KeySecure Cluster Configuration - Cluster Members 7. From the Devices tab, select Maintenance > Backup and Restore > Restore Backup. The Backup and Restore page displays (Figure 228). FIGURE 228 KeySecure Backup and Restore page 8. Under Restore Backup, select Upload from browser, then enter a file name or browse to the file location.
Encryption preparation 20 9. Enter the Backup Password in the field provided, then click Restore. 10. After the certificate is restored to the secondary node from the previously backed-up primary node, select Maintenance > Services. The Services Configuration page displays (Figure 229). NOTE A message displays, advising that the secondary node requires a restart. FIGURE 229 KeySecure Services Configuration page 11.
20 Creating a new encryption group • Switch KAC certificates have been signed by a CA and stored in a known location. • Key management system (key vault) certificates have been obtained and stored in a known location. Creating a new encryption group The following steps describe how to start and run the encryption setup wizard and create a new encryption group. NOTE When a new encryption group is created, any existing tape pools in the switch are removed. 1.
Creating a new encryption group 20 6. Confirm the configuration. 7. Configuration Status. 8. Read Instructions. FIGURE 231 Configure Switch Encryption wizard - welcome screen 4. From the Configure Switch Encryption welcome screen, click Next to begin. The Designate Switch Membership dialog box displays (Figure 232).
20 Creating a new encryption group FIGURE 232 Designate Switch Membership dialog box 5. For this procedure, verify that Create a new encryption group containing just this switch is selected, then click Next. NOTE If you are adding a switch to an encryption, refer to “Adding a switch to an encryption group” on page 630. The Create a New Encryption Group dialog box displays (Figure 233).
Creating a new encryption group 20 The dialog box contains the following information: • Encryption Group Name text box: Encryption group names can have up to 15 characters. Letters, digits, and underscores are allowed. The group name is case-sensitive. • Failback mode: Selects whether or not storage targets should be automatically transferred back to an encryption engine that comes online after being unavailable. Options are Automatic or Manual.
20 Creating a new encryption group Using this dialog box, you can select a key vault for the encryption group that contains the selected switch. Prior to selecting your Key Vault Type, the selection is shown as None. The dialog box contains the following information: • Key Vault Type: If an encryption group contains mixed firmware nodes, the Encryption Group Properties Key Vault Type name is based on the firmware version of the group leader.
Creating a new encryption group 20 • Backup Certificate File: (Optional.) If a backup key vault is entered, the backup certificate file must also be entered. Navigate to and select the secondary public key certificate from your desktop, if applicable. • Serial Number: (TKLM only.) Serial number of the switch, which is required for registering the switch on the key vault. • Device Group: (TKLM only.) The name of the device group of which the switch is a member.
20 Creating a new encryption group FIGURE 235 Select Key Vault dialog box for DPM 1. Enter the IP address or host name for the primary key vault. If you are clustering DPM appliances for high availability, IP load balancers are used to direct traffic to the appliances. Use the IP address of the load balancer. 2. Enter the name of the file that holds the Primary Key Vault’s CA Key Certificate or browse to the desired location. 3.
Creating a new encryption group 20 FIGURE 236 Specify Certificate Signing Request File Name dialog box 5. Enter the filename in which you want to store the certificate information, or browse to the file location. The certificate stored in this file is the switch’s Switch Certificate Signing file. You will need to know this path and file name to install the switch’s Switch Certificate Signing file on the key management appliance. 6. Click Next.
20 Creating a new encryption group FIGURE 237 Specify Master Key File Name dialog box 7. Enter the location of the file in which you want to store back up master key information, or browse to the desired location. 8. Enter the passphrase, which is required for restoring the master key. The passphrase can be between eight and 40 characters, and any character is allowed. 9. Re-enter the passphrase for verification, then click Next. The Select Security Settings dialog box displays (Figure 238).
Creating a new encryption group 20 FIGURE 238 Select Security Settings dialog box 10. Set quorum size and system card requirements. The quorum size is the minimum number of cards necessary to enable the card holders to perform the security sensitive operations listed above. The maximum quorum size is five cards.
20 Creating a new encryption group FIGURE 239 Confirm Configuration dialog box The Configuration Status dialog box displays (Figure 240). FIGURE 240 Configuration Status dialog box 12. Review the post-configuration instructions, which you can copy to a clipboard or print for later, then click Next. The Next Steps dialog box displays (Figure 241). Instructions for installing public key certificates for the encryption switch are displayed.
Creating a new encryption group 20 FIGURE 241 Next Steps dialog box 13. Review the post-configuration instructions, which you can copy to a clipboard or print for later, then click Finish to exit the wizard.
20 Creating a new encryption group Configuring key vault settings for NetApp Link Key Manager (LKM/SSKM) The following procedure assumes you have already configured the initial steps in the Configure Switch Encryption wizard. If you have not already done so, go to “Creating a new encryption group” on page 592. Figure 242 shows the key vault selection dialog box for LKM/SSKM. FIGURE 242 Select Key Vault dialog box for LKM/SSKM 1. Enter the IP address or host name for the primary key vault. 2.
Creating a new encryption group 20 FIGURE 243 Specify Public Key Certificate (KAC) File Name dialog box 4. Specify the location of the file in which you want to store the public key certificate that is used to authenticate connections to the key vault. The certificate stored in this file is the switch’s public key certificate. You will need to know this path and file name to install the switch’s public key certificate on the key management appliance. 5. Click Next.
20 Creating a new encryption group FIGURE 244 Select Security Settings dialog box 6. Set quorum size and system card requirements. The quorum size is the minimum number of cards necessary to enable the card holders to perform the security sensitive operations listed above. The maximum quorum size is five cards.
Creating a new encryption group 20 FIGURE 245 Confirm Configuration dialog box The Configuration Status dialog box displays (Figure 246). FIGURE 246 Configuration Status dialog box All configuration items have green check marks if the configuration is successful. A red stop sign indicates a failed step. A message displays below the table, indicating the encryption switch was added to the group you named, and the public key certificate is stored in the location you specified.
20 Creating a new encryption group After configuration of the encryption group is completed, the Management application sends API commands to verify the switch configuration. See “Understanding configuration status results” on page 629 for more information. 8. Verify the information is correct, then click Next. The Next Steps dialog box displays (Figure 247). Instructions for installing public key certificates for the encryption switch are displayed. These instructions are specific to the key vault type.
Creating a new encryption group 20 Configuring key vault settings for HP Enterprise Secure Key Manager (ESKM/SKM) The following procedure assumes you have already configured the initial steps in the Configure Switch Encryption wizard. If you have not already done so, go to “Creating a new encryption group” on page 592. Figure 248 shows the key vault selection dialog box for ESKM/SKM. FIGURE 248 Select Key Vault dialog box for ESKM/SKM 1. Enter the IP address or host name for the primary key vault. 2.
20 Creating a new encryption group FIGURE 249 Specify Certificate Signing Request File Name dialog box 6. Enter the location of the file in which you want to store the certificate information, or browse to the desired location, then click Next. The Specify Master Key File Name dialog box displays (Figure 250). FIGURE 250 Specify Master Key File Name dialog box 7. 610 Enter the passphrase, which is required for restoring the master key.
Creating a new encryption group 20 8. Re-enter the passphrase for verification, then click Next. The Select Security Settings dialog box displays (Figure 251). FIGURE 251 Select Security Settings dialog box 9. Set quorum size and system card requirements. The quorum size is the minimum number of cards necessary to enable the card holders to perform the security sensitive operations listed above. The maximum quorum size is five cards.
20 Creating a new encryption group FIGURE 252 Confirm Configuration dialog box The Configuration Status dialog box displays (Figure 253). FIGURE 253 Configuration Status dialog box All configuration items have green check marks if the configuration is successful. A red stop sign indicates a failed step. A message displays below the table, indicating the encryption switch was added to the group you named, and the public key certificate is stored in the location you specified.
Creating a new encryption group 20 After configuration of the encryption group is completed, the Management application sends API commands to verify the switch configuration. See “Understanding configuration status results” on page 629 for more information. 11. Review important messages, then click Next. The Next Steps dialog box displays (Figure 254). Instructions for installing public key certificates for the encryption switch are displayed. FIGURE 254 Next Steps dialog box 12.
20 Creating a new encryption group FIGURE 255 Select Key Vault dialog box for TEKA 1. Enter the IP address or host name for the primary key vault. 2. Enter the name of the file that holds the primary key vault’s public key certificate, or browse to the desired location. 3. Enter the password you created for the Brocade group TEKA client. 4.
Creating a new encryption group 20 FIGURE 256 Specify Master Key File Name dialog box 6. Enter the name of the file used for backing up the master key or browse to the desired location. 7. Enter the passphrase, which is required for restoring the master key. The passphrase can be between eight and 40 characters, and any character is allowed. 8. Re-enter the passphrase for verification, then click Next. The Select Security Settings dialog box displays (Figure 257).
20 Creating a new encryption group 9. Set quorum size and system card requirements. The quorum size is the minimum number of cards necessary to enable the card holders to perform the security sensitive operations listed above. The maximum quorum size is five cards. The actual number of authentication cards registered is always more than the quorum size, so if you set the quorum size to five, for example, you will need to register at least six cards in the subsequent steps.
Creating a new encryption group 20 FIGURE 259 Configuration Status dialog box All configuration items have green check marks if the configuration is successful. A red stop sign indicates a failed step. A message displays below the table, indicating the encryption switch was added to the group you named, and the public key certificate is stored in the location you specified.
20 Creating a new encryption group FIGURE 260 Next Steps dialog box 12. Review the post-configuration instructions, which you can copy to a clipboard or print for later. 13. Click Finish to exit the Configure Switch Encryption wizard. 14. Refer to “Understanding configuration status results” on page 629.
Creating a new encryption group 20 Configuring key vault settings for IBM Tivoli Key Lifetime Manager (TKLM) The following procedure assumes you have already configured the initial steps in the Configure Switch Encryption wizard. If you have not already done so, go to “Creating a new encryption group” on page 592. Figure 261 shows the key vault selection dialog box for TKLM. FIGURE 261 Select Key Vault dialog box for TKLM 1. Enter the IP address or host name for the primary key vault. 2.
20 Creating a new encryption group FIGURE 262 Specify Public Key Certificate (KAC) File Name dialog box 5. Enter the name of the file in which the switch’s public key certificate is stored, or browse to the desired location, then click Next. The Specify Master Key File Name dialog box displays (Figure 263). FIGURE 263 Specify Master Key File Name dialog box 6. Enter the name of the file used for backing up the master key, or browse to the desired location.
Creating a new encryption group 7. 20 Enter the passphrase, which is required for restoring the master key. The passphrase can be between eight and 40 characters, and any character is allowed. 8. Re-enter the passphrase for verification, then click Next. The Select Security Settings dialog box displays (Figure 264). FIGURE 264 Select Security Settings dialog box 9. Set quorum size and system card requirements.
20 Creating a new encryption group FIGURE 265 Confirm Configuration dialog box The Configuration Status dialog box displays (Figure 266). FIGURE 266 Configuration Status dialog box All configuration items have green check marks if the configuration is successful. A red stop sign indicates a failed step. A message displays below the table, indicating the encryption switch was added to the group you named, and the public key certificate is stored in the location you specified.
Creating a new encryption group 20 After configuration of the encryption group is completed, the Management application sends API commands to verify the switch configuration. 11. Click Next. The Next Steps dialog box displays (Figure 267). Instructions for installing public key certificates for the encryption switch are displayed. These instructions are specific to the key vault type. FIGURE 267 Next Steps dialog box 12.
20 Creating a new encryption group Figure 268 shows the key vault selection dialog box for KMIP. FIGURE 268 Select Key Vault dialog box for KMIP 1. Select the High Availability mode. Options are: • Opaque: Both the primary and secondary key vaults are registered on the Fabric OS encryption switch. The client archives the key to a single (primary) key vault. For disk operations, an additional hardening check is done on the secondary key vault before the key is used for encryption.
Creating a new encryption group 20 6. Select the Certificate Type. Options are: • CA Signed: The Fabric OS encryption switch KAC certificate is signed by a CA, imported back onto the Fabric OS encryption switch, and registered as a KAC certificate. The CA will be registered as a key vault certificate on the Fabric OS encryption switch. • Self Signed: The self-signed certificates are exchanged and registered on both ends.
20 Creating a new encryption group FIGURE 270 Specify Master Key File Name dialog box 9. Enter the name of the file used for backing up the master key, or browse to the desired location. 10. Enter the passphrase, which is required for restoring the master key. The passphrase can be between eight and 40 characters, and any character is allowed. 11. Re-enter the passphrase for verification, then click Next. The Select Security Settings dialog box displays (Figure 271).
Creating a new encryption group 20 FIGURE 271 Select Security Settings dialog box 12. Set quorum size and system card requirements. The quorum size is the minimum number of cards necessary to enable the card holders to perform the security sensitive operations listed above. The maximum quorum size is five cards.
20 Creating a new encryption group FIGURE 272 Confirm Configuration dialog box 14. Confirm the encryption group name and switch public key certificate file name you specified are correct, then click Next. The Configuration Status dialog box displays (Figure 273).
Creating a new encryption group 20 All configuration items have green check marks if the configuration is successful. A red stop sign indicates a failed step. A message displays below the table, indicating the encryption switch was added to the group you named, and the public key certificate is stored in the location you specified. After configuration of the encryption group is completed, the Management application sends API commands to verify the switch configuration. 15. Click Next.
20 Adding a switch to an encryption group 3. Register the key vault. The Management application registers the key vault using the cryptocfg --reg keyvault command. 4. Enable the encryption engines. The Management application initializes an encryption switch using the cryptocfg --initEE [] and cryptocfg --regEE [] commands. 5. Create a new master key. (Opaque key vaults only). The Management application checks for a new master key.
Adding a switch to an encryption group 20 FIGURE 275 Configure Switch Encryption wizard - welcome screen 3. Click Next. The Designate Switch Membership dialog box displays (Figure 276). FIGURE 276 Designate Switch Membership dialog box 4. For this procedure, select Add this switch to an existing encryption group, then click Next. The Add Switch to Existing Encryption Group dialog box displays (Figure 277).
20 Adding a switch to an encryption group The dialog box contains the following information: • Encryption Groups table: Enables you to select an encryption group in which to add a switch. • Member Switches table: Lists the switches in the selected encryption group. NOTE If you are creating a new encryption group, refer to “Creating a new encryption group” on page 592. FIGURE 277 Add Switch to Existing Encryption Group dialog box 5. Select the group in which to add the switch, then click Next.
Adding a switch to an encryption group 20 FIGURE 278 Specify Public Key Certificate (KAC) File Name dialog box 6. Enter the location where you want to store the public key certificate that is used to authenticate connections to the key vault, or browse to the desired location, then click Next. The Confirm Configuration dialog box displays (Figure 279). Confirm the encryption group name and switch public key certificate file name you specified are correct, then click Next.
20 Adding a switch to an encryption group FIGURE 280 Configuration Status dialog box All configuration items have green check marks if the configuration is successful. A red stop sign indicates a failed step. A message displays below the table, indicating the encryption switch was added to the group you named, and the public key certificate is stored in the location you specified. 7. Review important messages, then click Next. The Error Instructions dialog box displays (Figure 281).
Adding a switch to an encryption group 20 FIGURE 281 Error Instructions dialog box 8. Review the post-configuration instructions, which you can copy to a clipboard or print for later. 9. Click Finish to exit the Configure Switch Encryption wizard.
20 Replacing an encryption engine in an encryption group Replacing an encryption engine in an encryption group To replace an encryption engine in an encryption group with another encryption engine within the same DEK Cluster, complete the following steps: 1. Select Configure > Encryption from the menu task bar to display the Encryption Center dialog box. (Refer to Figure 185 on page 526.) 2.
High availability (HA) clusters 20 High availability (HA) clusters A high availability (HA) cluster is a group of exactly two encryption engines (EEs). One encryption engine can take over encryption and decryption tasks for the other encryption engine, if that member fails or becomes unreachable. NOTE High Availability clusters between two EEs should not be confused with High Availability opaque mode that is supported in KMIP.
20 High availability (HA) clusters FIGURE 283 Encryption Group Properties dialog box - HA Clusters tab NOTE If you are creating a new HA cluster, a dialog box displays requesting a name for the new HA cluster. HA Cluster names can have up to 31 characters. Letters, digits, and underscores are allowed. Removing engines from an HA cluster Removing the last engine from an HA cluster also removes the HA cluster.
High availability (HA) clusters 20 Swapping engines in an HA cluster Swapping engines is useful when replacing hardware. Swapping engines is different from removing an engine and adding another because when you swap engines, the configured targets on the former HA cluster member are moved to the new HA cluster member. 1. Select Configure > Encryption from the menu task bar to display the Encryption Center dialog box. 2.
20 Configuring encryption storage targets Configuring encryption storage targets Adding an encryption target maps storage devices and hosts to virtual targets and virtual initiators within the encryption switch. The storage encryption wizard enables you to configure encryption for a storage device (target). NOTE It is recommended that you configure the host and target in the same zone before configuring them for encryption.
Configuring encryption storage targets 20 FIGURE 284 Encryption Targets dialog box 3. Click Add. The Configure Storage Encryption welcome screen displays (Figure 285). FIGURE 285 Configure Storage Encryption welcome screen 4. Click Next. The Select Encryption Engine dialog box displays (Figure 286).
20 Configuring encryption storage targets FIGURE 286 Select Encryption Engine dialog box The dialog box contains the following information: • Encryption engine: The name of the encryption engine. The list of engines depends on the scope being viewed: • If an encryption group was selected, the list includes all engines in the group. • If a switch was selected, the list includes all encryption engines for the switch. • If a single encryption engine was selected, the list contains only that engine.
Configuring encryption storage targets 20 FIGURE 287 Select Target dialog box The dialog box contains the following information: • Target Port WWN: The world wide name of the target port in the same fabric as the encryption engine. • Target Port Name: The name of the target port in the same fabric as the encryption engine. • Target Node WWN: The world wide name of the target node in the same fabric as the encryption engine. • Target Node Name: The name of the target device.
20 Configuring encryption storage targets FIGURE 288 Select Hosts dialog box The dialog box contains the following information: • Hosts in Fabric table: Lists the available hosts in the fabric. • Selected Hosts table: Lists the hosts that have been selected to access the target. • Port WWN: The world wide name of the host ports that are in the same fabric as the encryption engine. • Node WWN: The world wide name of the host nodes that are in the same fabric as the encryption engine.
Configuring encryption storage targets 20 • Right arrow button: Moves a host from the Host in Fabric table to the Selected Hosts table. • Left arrow button: Removes a host from the Selected Hosts table. • Add button: Click to manually add host port world wide names or host node world wide names to the Selected Hosts table. 8. Select hosts using either of the following methods: a.
20 Configuring encryption storage targets FIGURE 290 Confirmation dialog box The screen contains the following information: • Encryption Engine: The slot location of the encryption engine. • Container Name: The logical encryption name used to map storage targets and hosts to virtual targets and virtual initiators. • • • • Target Device Port: The world wide name of the target device port. Host Node WWN: The world wide name of the host node. Host Port WWN: The world wide name of the host port.
Configuring encryption storage targets 20 FIGURE 291 Configuration Status screen The screen contains the following information: • Device: The device type (target or host). • Device Port WWN: The port world wide name. • Represented by VI/VT: The virtual target (VT) mapped to the physical target or virtual initiator (VI) representing the host. • VI/VT Port WWN: The port world wide name of the virtual target or virtual initiator.
20 Configuring hosts for encryption targets FIGURE 292 Next Steps screen The screen contains the following information: • Important Instructions: Instructions about post-configuration tasks you must complete after you close the wizard. For example, you must zone the physical hosts and the target together and then you encrypt the LUNs using the Storage Device LUNs dialog box. • Copy to Clipboard button: Saves a copy of the instructions. • Print button: Prints the configuration. 14.
Configuring hosts for encryption targets 20 NOTE You can also select a group, switch, or engine from the Encryption Center Devices table, then click the Targets icon. The Encryption Targets dialog box displays (Figure 293). FIGURE 293 Encryption Targets dialog box 3. Select a target storage device from the list, then click Hosts. The Encryption Target Hosts dialog box displays (Figure 294). The Hosts in Fabric table lists the configured hosts in a fabric.
20 Adding target disk LUNs for encryption NOTE Both the Host Ports in Fabric table and the Selected Hosts table now contain a Port ID column to display the 24-bit PID of the host port. 4. Select one or more hosts in a fabric using either of the following methods: a. Select a maximum of 1024 hosts from the Hosts in Fabric table, then click the right arrow to move the hosts to the Selected Hosts table. (The Port WWN column contains all target information that displays when using the nsshow command.) b.
Adding target disk LUNs for encryption 20 The Encryption Disk LUN View dialog box displays (Figure 295). FIGURE 295 Encryption Disk LUN View dialog box The dialog box provides a convenient way to view and manage disk LUNs that are provisioned from different hosts, identify conflicts between configuration policies on storage systems, and to provide a launching point for the Add New Path wizard for configuring multiple I/O paths to the LUN.
20 Adding target disk LUNs for encryption FIGURE 296 Select Target Port dialog box The dialog box is used to select a target port when configuring multiple I/O paths to a disk LUN. The dialog box contains the following information: • Storage Array: The Storage Array selected from the LUN view prior to launching the Add New Path wizard. • Host: The host selected from the LUN view prior to launching the Add New Path wizard.
Adding target disk LUNs for encryption 20 The dialog box is used to select an initiator port when configuring multiple I/O paths to a disk LUN. The dialog box contains the following information: • Storage Array: Displays the storage array that was selected from the LUN view prior to launching the wizard. • Host: The host selected from the LUN view prior to launching the wizard.
20 Adding target disk LUNs for encryption • LUN table: Available LUNs identified by the following: • Host • LUN Number • LUN Serial Number • Current LUN State: Options are Encrypted, which is automatically selected if the LUN has a key ID; Clear Text, and
Adding target disk LUNs for encryption 20 FIGURE 299 Correcting an Encryption Mode Mismatch When you correct a policy on a LUN, it is automatically selected for all paths to the selected LUN. When you modify LUN policies, a Modify icon displays to identify the modified LUN entry. 11. Click OK or Apply to apply the changes. Configuring Storage Arrays The Storage Array contains a list of storage ports that will be used later in the LUN centric view.
20 Adding target disk LUNs for encryption Remote replication LUNs The Symmetrix Remote Data Facility (SRDF) transmits data that is being written to both a local Symmetrix array and a remote symmetrix array. The replicated data facilitates a fast switchover to the remote site for data recovery. SRDF supports the following methods of data replication: • Synchronous Replication provides real-time mirroring of data between the source Symmetrix and the target Symmetrix systems.
Adding target disk LUNs for encryption 20 FIGURE 300 Basic SRDF configuration with encryption switches Metadata requirements and remote replication When the metadata and key ID are written, the primary metadata on blocks 1–16 is compressed and encrypted. However, there are scenarios whereby these blocks cannot be compressed, and the metadata is not written to the media.
20 Adding target tape LUNs for encryption • The New LUN option can be used only if replication is enabled for the encryption group. • If the local LUN contains host data, configuring it with the New LUN option will cause the data on the last three blocks of the LUN to be lost. Before using the New LUN option, you must migrate the contents of the LUN to another LUN that is larger by at least three blocks. The new, larger LUN can then be used when creating the SRDF pair.
Adding target tape LUNs for encryption 20 FIGURE 302 Encryption Target Tape LUNs dialog box 4. Click Add. The Add Encryption Target Tape LUNs dialog box displays (Figure 303). A table of all LUNs in the storage device that are visible to hosts is displayed. LUNs are identified by the Host world wide name, LUN number, Volume Label Prefix number, and Enable Write Early ACK and Enable Read Ahead status. The LUN numbers may be different for different hosts.
20 Adding target tape LUNs for encryption When you select a specific host, only the LUNs visible to that host are displayed. If you select All Hosts, LUNs visible to all configured hosts are displayed. If a LUN is visible to multiple hosts, it is listed once for each host. 6. Choose a LUN to be added to an encryption target container using one of the two following methods: • Discover: Identifies the exposed logical unit number for a specified initiator.
Moving Targets 20 Moving Targets The Move Targets dialog box is used to redistribute which engine encrypts which targets. It is also useful for transferring all targets to another engine before replacing or removing engine hardware. Moving targets to another engine may be done while traffic is flowing between the host and target. Traffic is interrupted for a short time but resumes before the host applications are affected. 1. Select Configure > Encryption. The Encryption Center dialog box displays. 2.
20 Tape LUN write early and read ahead 8. In the Encryption Targets dialog box, select Target Port A, click LUNs, then click Add. Select the LUNs to be encrypted and the encryption policies for the LUNs. 9. In the Encryption Targets dialog box, select Target Port B, click LUNs, then click Add. Select the LUNs to be encrypted and the encryption policies for the LUNs, making sure that the encryption policies match the policies specified in the other path. 10.
Tape LUN write early and read ahead 20 FIGURE 304 Encryption Targets dialog box 3. Select a target tape storage device from the table, then click LUNs. The Encryption Target Tape LUNs dialog box displays (Figure 305). FIGURE 305 Encryption Target Tape LUNs dialog box - Setting tape LUN read ahead and write early 4.
20 Tape LUN statistics NOTE You can also select a group, switch, or engine from the Encryption Center Devices table, then click the Targets icon. c. Select the appropriate crypto target container, then click Commit. Tape LUN statistics This feature enables you to view and clear statistics for tape LUNs. These statistics include the number of compressed blocks, uncompressed blocks, compressed bytes and uncompressed bytes written to a tape LUN.
Tape LUN statistics 20 FIGURE 307 Tape LUN Statistics dialog box The dialog box contains the following information: • LUN #: The number of the logical unit for which statics are displayed. • Tape Volume/Pool: The tape volume label of the currently-mounted tape, if a tape session is currently in progress. • • • • • • • • Tape Session #: The number of the ongoing tape session. Uncompressed blocks: The number of uncompressed blocks written to tape.
20 Tape LUN statistics 3. Select a tape target storage device, then click LUNs. The Target Tape LUNs dialog box displays (Figure 308). A list of the configured tape LUNs is displayed. FIGURE 308 Target Tape LUNs dialog box 4. Select the LUN or LUNs for which to display or clear statistics, then click Statistics. The Tape LUN Statistics dialog box displays (Figure 309). The statistic results based on the LUN or LUNs you selected is displayed. Tape LUN statistics are cumulative.
Tape LUN statistics 20 • Host Port WWN: The WWN of the host port that is being used for the write operation. • A Refresh button updates the statistics on the display since the last reset. • A Clear button resets all statistics in the display. 5. Do either of the following: • Click Clear to clear the tape LUN statistics, then click Yes to confirm. • Click Refresh to view the current statistics cumulative since the last reset.
20 Encryption engine rebalancing FIGURE 311 Tape LUN Statistics dialog box The dialog box contains the following information: • LUN #: The number of the logical unit for which statics are displayed. • Tape Volume/Pool: The tape volume label of the currently-mounted tape, if a tape session is currently in progress. • • • • • • Tape Session #: The number of the ongoing tape session. Uncompressed blocks: The number of uncompressed blocks written to tape.
Master keys 20 During rebalancing operations, be aware of the following: • You might notice a slight disruption in Disk I/O. In some cases, manual intervention may be needed. • Backup jobs to tapes might need to be restarted after rebalancing is completed. To determine if rebalancing is recommended for an encryption engine, check the encryption engine properties. Beginning with Fabric OS 6.4, a field is added that indicates whether or not re-balancing is recommended.
20 Master keys The new master key cannot be used (no new data encryption keys can be created, so no new encrypted LUNs can be configured), until you back up the new master key. After you have backed up the new master key, it is strongly recommended that all encrypted disk LUNs be rekeyed. rekeying causes a new data encryption key to be created and encrypted using the new active master key, thereby removing any dependency on the old master key.
Master keys 20 Refer to the following procedures for more information: • “Saving the master key to a file” on page 671 • “Saving a master key to a key vault” on page 672 • “Saving a master key to a smart card set” on page 673 You must back up the master key when the status is Created but not backed up. • Restore master key: Enabled when no master key exists or the previous master key has been backed up. This option is also enabled when using a DPM key vault.
20 Master keys FIGURE 312 Backup Destination (to file) dialog box 4. Select File as the Backup Destination. 5. Enter a file name, or browse to the desired location. 6. Enter the passphrase, which is required for restoring the master key. The passphrase can be between eight and 40 characters, and any character is allowed. 7. Re-enter the passphrase for verification, then click OK. ATTENTION Save the passphrase. This passphrase is required if you ever need to restore the master key from the file.
Master keys 20 FIGURE 313 Backup Destination (to key vault) dialog box 4. Select Key Vault as the Backup Destination. 5. Enter the passphrase, which is required for restoring the master key. The passphrase can be between eight and 40 characters, and any character is allowed. 6. Re-enter the passphrase for verification, then click OK. A dialog box displays that shows the Key ID. The Key ID identifies the storage location in the key vault. 7. Store both the Key ID and the passphrase in a secure place.
20 Master keys FIGURE 314 Backup Destination (to smart cards) dialog box 4. Select A Recovery Set of Smart Cards as the Backup Destination. 5. Enter the recovery card set size. 6. Insert the first blank card and wait for the card serial number to appear. 7. Run the additional cards through the reader that are needed for the set. As you read each card, the card ID displays in the Card Serial# field. Be sure to wait for the ID to appear. 8.
Master keys 20 Saving a master key to a smart card set - Overview A card reader must be attached to the SAN Management application PC to save a master key to a recovery card. Recovery cards can only be written once to back up a single master key. Each master key backup operation requires a new set of previously unused smart cards. NOTE Windows operating systems do not require smart card drivers to be installed separately; the driver is bundled with the operating system.
20 Master keys FIGURE 315 Select a Master Key to Restore (from file) dialog box 4. Choose the active or alternate master key for restoration, as appropriate. 5. Select File as the Restore From location. 6. Enter a file name, or browse to the desired location. 7. Enter the passphrase. The passphrase that was used to back up the master key must be used to restore the master key. 8. Click OK. Restoring a master key from a key vault Use the following procedure to restore the master key from a key vault: 1.
Master keys 20 FIGURE 316 Select a Master Key to Restore (from key vault) dialog box 4. Choose the active or alternate master key for restoration, as appropriate. 5. Select Key Vault as the Restore From location. 6. Enter the key ID of the master key that was backed up to the key vault. 7. Enter the passphrase. The passphrase that was used to back up the master key must be used to restore the master key. 8. Click OK.
20 Master keys FIGURE 317 Select a Master Key to Restore (from a recovery set of smart cards) dialog box 4. Choose the active or alternate master key for restoration, as appropriate. 5. Select A Recovery Set of Smart Cards as the Restore From location. 6. Insert the recovery card containing a share of the master key that was backed up earlier, and wait for the card serial number to appear. 7. Enter the password that was used to create the card.
Security Settings 20 Security Settings Security settings help you identify if system cards are required to initialize an encryption engine and also determine the number of authentication cards needed for a quorum. 1. Select Configure > Encryption from the menu task bar to display the Encryption Center dialog box (Refer to Figure 185 on page 526). 2. Select a group from the Encryption Center Devices table, then select Group > Security from the menu task bar.
20 Zeroizing an encryption engine NOTE Zeroizing an engine affects the I/Os, but all target and LUN configuration remain intact. Encryption target configuration data is not deleted. You can zeroize an encryption engine only if it is enabled (running), or disabled but ready to be enabled. If the encryption engine is not in one of these states, an error message results.
Using the Encryption Targets dialog box 20 Using the Encryption Targets dialog box The Encryption Targets dialog box enables you to send outbound data that you want to store as ciphertext to an encryption device. The encryption target acts as a virtual target when receiving data from a host, and as a virtual initiator when writing the encrypted data to storage. NOTE The Encryption Targets dialog box enables you to launch a variety of wizards and other related dialog boxes.
20 Redirection zones Redirection zones It is recommended that you configure the host and target in the same zone before you configure them for encryption. Doing so creates a redirection zone to redirect the host/target traffic through the encryption engine; however, a redirection zone can only be created if the host and target are in the same zone.
Disk device decommissioning 20 Provided that the crypto configuration is not left uncommitted because of any crypto configuration changes or a failed device decommission operation issued on a encryption group leader node, this error message will not be seen for any device decommission operation issued serially on an encryption group member node.
20 Disk device decommissioning Displaying and deleting decommissioned key IDs With the introduction of Fabric OS 7.1.0, the ability to decommission disk LUNs is supported on all key vault platforms. Earlier releases restricted this functionality to DPM (formerly RKM) and LKM/SSKM key vaults only. When disk LUNs are decommissioned, the process includes the disabling of the key record in the key vault and indication that the key has been decommissioned.
Rekeying all disk LUNs manually 20 3. Click Delete All to delete the decommissioned keys from the switch. As a precaution, copy the keys to a secure location before deleting them from the switch. Right-click on an entry in the table to individually select a key ID. You may also copy or export a single row within the table or the entire table. To export the keys, right-click and select Export, which will export the key IDs.
20 Rekeying all disk LUNs manually • The encryption group must be in the converged state. • The target container that hosts the LUN must be online. In addition to providing the ability to launch manual rekey operations, the management application also enables you to monitor their progress. Setting disk LUN Re-key All To rekey all disk LUNs on an encryption node, complete these steps: 1.
Rekeying all disk LUNs manually 20 . FIGURE 322 Pending manual rekey operations Viewing disk LUN rekeying details You can view details related to the rekeying of a selected target disk LUN from the LUN Re-keying Details dialog box. 1. Select Configure > Encryption from the menu task bar to display the Encryption Center dialog box (Refer to Figure 185 on page 526). 2.
20 Rekeying all disk LUNs manually FIGURE 323 Encryption Target Disk LUNs dialog box 4. Click Add. The Add Disk LUNs dialog box displays. This dialog box includes a table of all LUNs in the storage device that are visible to the hosts. 5. Click Re-keying Details. The LUN Re-keying Details dialog box displays. The dialog box contains the following information: • • • • • • Key ID: The LUN key identifier. Key ID State: The state of the LUN rekeying operation.
Rekeying all disk LUNs manually 20 Viewing the progress of manual rekey operations To monitor the progress of manual rekey operations, complete these steps: 1. Select Configure > Encryption from the menu task bar to display the Encryption Center dialog box (Refer to Figure 185 on page 526). 2. Select an encryption group from the Encryption Center Devices table, then select Group > Re-Key Sessions from the menu task bar.
20 Thin provision LUNs • Current LBA: The Logical Block Address (LBA) of the block that is currently being written. • Number of Blocks: The number of blocks written. • Thin Provision LUN: Identifies if the new LUN is a thin provisioned LUN. Options are: • Yes: Thin provision support is limited to Brocade-tested storage arrays. The thin provision LUN status will be displayed as Yes for supported storage arrays only. • No: Shown as No if the LUN is not a thin provision LUN.
Viewing time left for auto rekey 20 Viewing time left for auto rekey You can view the time remaining until auto rekey is no longer active for a disk LUN. The information is expressed as the difference between the next rekey date and the current date and time, and is measured in days, hours, and minutes. Although you cannot make changes directly to the table, you can modify the time left using CLI. For more information, see the administrator’s guide supporting your key vault management system.
20 Viewing and editing switch encryption properties Viewing and editing switch encryption properties To view switch encryption properties, complete the following steps: 1. Select Configure > Encryption from the menu task bar to display the Encryption Center dialog box. (Refer to Figure 185 on page 526.) 2.
Viewing and editing switch encryption properties 20 • Switch Status: The health status of the switch. Options are: • Healthy • Marginal • Down • Unknown • Unmonitored • Unreachable • Switch Membership Status: The alert or informational message description, which details the health status of the switch. Options are: • • • • • Group Member Leader-Member Comm Error Discovering Not a member • Encryption Group: The name of the encryption group to which the switch belongs.
20 Viewing and editing switch encryption properties • Thales e-Security keyAuthority (TEKA): If an encryption group contains mixed firmware nodes, the Encryption Group Properties Key Vault Type name is based on the firmware version of the group leader. For example, If a switch is running Fabric OS 7.1.0 or later, the Key Vault Type is displayed as “Thales e-Security keyAuthority (TEKA).”If a switch is running Fabric OS prior to v7.1.0, Key Vault Type is displayed as “Thales Key Manager (TEMS)”.
Viewing and editing switch encryption properties 20 • need master/link key • Online • Set State To: Identifies if the state is enabled or disabled. You can click the line item in the table to change the value, then click OK to apply the change. • Total Targets: The number of encrypted target devices. • HA Cluster Peer: The name and location of the high-availability (HA) cluster peer (another encryption engine in the same group), if in an HA configuration. If no peer is configured, No Peer is displayed.
20 Viewing and editing encryption group properties FIGURE 327 Import Signed Certificate dialog box 4. Enter or browse to the file containing the signed certificate, then click OK. The file is imported onto the switch. Enabling and disabling the encryption engine state from properties To enable the encryption engine, complete the following steps: 1. Select Configure > Encryption from the menu task bar to display the Encryption Center dialog box (Refer to Figure 185 on page 526). 2.
Viewing and editing encryption group properties 20 The Encryption Group Properties dialog box includes several tabs that are used to configure the various functions for encryption groups. All tabs are visible for all key vault types with one exception; the Link Keys tab is visible only if the key vault type is NetApp LKM/SSKM. Unless otherwise specified, the Encryption Group Properties dialog box opens with the General tab displayed.
20 Viewing and editing encryption group properties General tab The General tab (Figure 329) is viewed from the Encryption Group Properties dialog box. To access the General tab, select a group from the Encryption Center Devices table, then select Group > Properties from the menu task bar. NOTE You can also select a group from the Encryption Center Devices table, then click the Properties icon.
Viewing and editing encryption group properties 20 When the first encryption engine comes back online, the encryption group’s failback setting determines whether the first encryption engine automatically resumes encrypting and decrypting traffic to its encryption targets. In manual mode, the second encryption engine continues handling the traffic until you manually invoke failback using the CLI, or until the second encryption engine fails.
20 Viewing and editing encryption group properties • Backup Key Vault Connection Status: The status of the backup key vault link. Options are: • Connected • Unknown/Busy • Not configured • Not responding • Failed authentication • High Availability Mode: (For KMIP key vault only.) Options are: • Opaque: Both the primary and secondary key vaults are registered on the Fabric OS encryption switch. The client archives the key to a single (primary) key vault.
Viewing and editing encryption group properties 20 Members tab The Members tab lists group switches, their role, and their connection status with the group leader. The table columns are not editable. The tab displays the configured membership for the group and includes the following: • • • • Node WWN: The member switch’s world wide name. IP Address: The switch’s IP address or host name. Node Name: The switch’s node name, if known. If unknown, this field is blank.
20 Viewing and editing encryption group properties FIGURE 330 Encryption Group Properties dialog box - Members tab Members tab Remove button You can click the Remove button to remove a selected switch or group from the encryption group table. • You cannot remove the group leader unless it is the only switch in the group. If you remove the group leader, the Management application also removes the HA cluster, the target container, and the tape pool (if configured) that are associated with the switch.
Viewing and editing encryption group properties 20 The consequences of removing the last switch in a group (which will be the group leader) are all switch removal consequences noted above, plus the following: • The encryption group is deleted. • All configured tape pools are deleted. Table 67 explains the impact of removing switches. TABLE 67 Switch removal impact Switch configuration Impact of removal The switch is the only switch in the encryption group. The encryption group is also removed.
20 Viewing and editing encryption group properties FIGURE 331 Encryption Group Properties dialog box - Security tab The dialog box contains the following information: • Master Key Status: Displays the status of the master key. Possible values are: • Not used: Displays when LKM/SSKM is the key vault. • Required but not created: Displays when a master key needs to be created. • Created but not backed up: Displays when the master key needs to be backed up.
Viewing and editing encryption group properties 20 • Registered Authentication Cards table: Lists the registered authentication cards by Group Card number, Card ID, the name of the person to which the card is assigned, and optional notes. • Register from Card Reader button: Launches the Add Authentication Card dialog box. • Register from Archive button: Launches the Add Authentication Card dialog box.
20 Viewing and editing encryption group properties • Right- and Left-arrow buttons: You can select an encryption engine in the Non-HA Encryption Engines table and click the Right-arrow button to add the encryption engine to the High-Availability Clusters. (If you are creating a new HA cluster, a dialog box displays requesting a name for the new HA cluster.) Similarly, you can select an encryption engine in the High-Availability Clusters table and click the Left-arrow button to remove it from a cluster.
Viewing and editing encryption group properties 20 Link Keys tab NOTE The Link Keys tab displays only if the key vault type is NetApp LKM/SSKM. Connections between a switch and an NetApp LKM/SSKM key vault require a shared link key. Link keys are used only with LKM/SSKM key vaults. Link keys are used to protect data encryption keys in transit to and from the key vault. There is a separate link key for each key vault for each switch.
20 Viewing and editing encryption group properties FIGURE 333 Encryption Group Properties dialog box - Link Keys tab Tape Pools tab Tape pools are managed from the Tape Pools tab. From the Tape Pools tab, you can add, modify, and remove tape pools. • To add a tape pool, click Add, then complete the Add Tape Pool dialog box. • To remove an encryption switch or engine from a tape pool, select one or more tape pools listed in the table, then click Remove.
Viewing and editing encryption group properties 20 FIGURE 334 Encryption Group Properties dialog box - Tape Pools tab Tape pools overview Tape cartridges and volumes can be organized into a tape pool (a collection of tape media). The same data encryption keys are used for all cartridges and volumes in the pool. Tape pools are used by backup application programs to group all tape volumes used in a single backup or in a backup plan.
20 Viewing and editing encryption group properties NOTE If groups are not visible in the Encryption Center Devices table, select View > Groups from the menu task bar. 3. Click Add. The Add Tape Pool dialog box displays (Figure 335). The Name tape pool label type is the default; however, you can change the tape pool label type to Number (Figure 336). FIGURE 335 Add Tape Pool by name dialog box FIGURE 336 Add Tape Pool by number dialog box 4.
Viewing and editing encryption group properties 20 6. Enter the number of days to use a key before obtaining a new one, if you choose to enforce a key lifespan. The default is Infinite (a blank field or a value of 0), which is the recommended setting. NOTE The key lifespan interval represents the key expiry timeout period for tapes or tape pools. You can only enter the Key Lifespan field if the tape pool is encrypted. If Clear Text is selected as the encryption mode, the Key Lifespan field is disabled.
20 Encryption-related acronyms in log messages NOTE You cannot replace an encryption engine if it is part of an HA Cluster. Encryption-related acronyms in log messages Fabric OS log messages related to encryption components and features may have acronyms embedded that require interpretation. Table 68 lists some of those acronyms.
Chapter 21 Zoning In this chapter • Zoning overview . . . . . . . . . . . . . . . . . . . . . . . . . . . . . . . . . . . . . . . . . . . . . . . • Zone database size . . . . . . . . . . . . . . . . . . . . . . . . . . . . . . . . . . . . . . . . . . . . • Zoning configuration . . . . . . . . . . . . . . . . . . . . . . . . . . . . . . . . . . . . . . . . . . . • LSAN zones . . . . . . . . . . . . . . . . . . . . . . . . . . . . . . . . . . . . . . . . . . . . . . . . . . • Traffic Isolation zones . . .
21 Zoning overview Blue Zone Server 2 Server 1 Storage 2 Red Zone Storage 1 RAID Green Zone Storage 3 Server 3 FIGURE 338 Zoning NOTE Zone objects based on physical port number or port ID (D,I ports) are not supported in Network OS fabrics. Types of zones The following types of zones are supported: • Standard zones Enable you to partition your fabric into logical groups of devices that can access each other. These are “regular” or “standard” zones.
Zoning overview 21 • QoS zones Assign high or low priority to designated traffic flows. Quality of Service (QoS) zones are standard zones with additional QoS attributes that you select when you create the zone. • Traffic Isolation zones (TI zones) Isolate inter-switch traffic to a specific, dedicated path through the fabric. Refer to “Traffic Isolation zones” on page 742 for more information.
21 Zone database size Zone naming conventions The naming rules for zone names, zone aliases, and zone configuration names vary with the type of fabric. The following conventions apply: • Names must start with an alphabetic character and may contain alphanumeric characters and the underscore ( _ ) character. • Names are not case-sensitive. • Zone, alias, and configuration names cannot begin with “bfa_”,“red_”, “lsan_red_”, or “d__efault__”. Zone configuration names cannot begin with “r_e_d_i_r_c__fg”.
Zoning configuration 21 Zoning configuration At a minimum, zoning configuration entails creating zones and zone members. However, you can also create zone aliases, zone configurations, and zone databases. You can define multiple zone configurations, deactivating and activating individual configurations as your needs change. Zoning configuration can also involve enabling or disabling the default zone.
21 Zoning configuration 2. Click the Zone DB tab if that tab is not automatically displayed. 3. Select a fabric from the Zoning Scope list. This identifies the target entity for all subsequent zoning actions and displays the zoning database for the selected entity. 4. Click New Zone. A new zone displays in the Zones list. 5. Type the name for the zone. For zone name requirements and limitations, refer to “Zone naming conventions” on page 716. 6.
Zoning configuration 21 Adding members to a zone Use this procedure to add a member to a zone when the member is listed in the Potential Members list of the Zone DB tab. Enterprise and Professional Plus editions: For instructions to add a member to a zone when the member is not listed in the Potential Members list, refer to the procedure “Creating a member in a zone” on page 720. 1. Select Configure > Zoning > Fabric. The Zoning dialog box displays. 2.
21 Zoning configuration 9. Click OK or Apply to save your changes. Any zones or zone configurations you have changed are saved in the zone database. Creating a member in a zone Use this procedure to add a member to a zone when the member is not listed in the Potential Members list of the Zone DB tab. For instructions to add a member to a zone when the member is listed in the Potential Members list, refer to the procedure “Adding members to a zone” on page 719. 1. Select Configure > Zoning > Fabric.
Zoning configuration 21 Removing a member from a zone Use the following procedure to remove one or more members from a zone or zones. Note that the member is not deleted; it is only removed from the zone. 1. Select Configure > Zoning > Fabric. The Zoning dialog box displays. 2. Click the Zone DB tab if that tab is not automatically displayed. 3. Select a fabric from the Zoning Scope list.
21 Zoning configuration Any zones or zone configurations you have changed are saved in the zone database. Deleting a zone 1. Select Configure > Zoning > Fabric. The Zoning dialog box displays. 2. Click the Zone DB tab if that tab is not automatically displayed. 3. Select a fabric from the Zoning Scope list. This identifies the target entity for all subsequent zoning actions and displays the zoning database for the selected entity. 4.
Zoning configuration 21 5. (Optional) Type a new name for the zone and press Enter to save the name. Depending on the characters included in the name you enter, a message may display informing you the name contains characters that are not accepted by some switch vendors. Click OK and enter a different name or accept the default name assigned to the zone. (For zone name requirements and limitations, refer to “Zone naming conventions” on page 716.) 6. Click OK or Apply to save your changes.
21 Zoning configuration 6. Make sure the appropriate fabric is named on the Zoning Policies dialog box. 7. Perform one of the following actions based on the task you want to complete: • To enable the default zone, click Enable, and then click OK. • To disable the default zone, click Disable, and then click OK. The Zoning Policies dialog box closes and the Zone DB tab displays. 8. Click OK or Apply to save your changes. Any zones or zone configurations you have changed are saved in the zone database.
Zoning configuration 21 Editing a zone alias 1. Select Configure > Zoning > Fabric. The Zoning dialog box displays. 2. Click the Zone DB tab if that tab is not automatically displayed. 3. Select a fabric from the Zoning Scope list. 4. Select Alias from the Type list. 5. Select the alias you want to edit in the Alias list and click Edit. The Edit Alias dialog box displays. 6. Add members to the alias by completing the following steps. a.
21 Zoning configuration 6. Select one or more objects that you want to remove from the alias in the Alias list. (Press SHIFT or CTRL and click each member to select more than one member.) You can select objects from different zone aliases. 7. Right-click one of the selected objects and select Remove. The selected objects are removed from the associated zone aliases. 8. Click OK or Apply on the Zoning dialog box to save your changes. Exporting zone aliases 1. Select Configure > Zoning > Fabric.
Zoning configuration 21 3. Select a fabric from the Zoning Scope list. 4. Select Alias from the Type list. 5. Right-click the zone alias you want to delete and select Delete. 6. Click Yes on the confirmation message. The selected zone alias is deleted from the Alias list. 7. Click OK or Apply on the Zoning dialog box to save your changes. Duplicating a zone alias 1. Select Configure > Zoning > Fabric. The Zoning dialog box displays. 2. Click the Zone DB tab if that tab is not automatically displayed. 3.
21 Zoning configuration 7. Add zones to the zone configuration. For step-by-step instructions, refer to “Adding zones to a zone configuration” on page 728. 8. Click OK or Apply to save your changes. Any zones or zone configurations you have changed are saved in the zone database. Viewing zone configuration properties 1. Select Configure > Zoning > Fabric. The Zoning dialog box displays. 2. Click the Zone DB tab if that tab is not automatically displayed. 3.
Zoning configuration 21 Removing a zone from a zone configuration Use the following procedure to remove a zone from a zone configuration. Note that the zone is not deleted; it is only removed from the zone configuration. 1. Select Configure > Zoning > Fabric. The Zoning dialog box displays. 2. Click the Zone DB tab if that tab is not automatically displayed. 3. Select a fabric from the Zoning Scope list.
21 Zoning configuration 3. Select a fabric from the Zoning Scope list. This identifies the target entity for all subsequent zoning actions and displays the zoning database for the selected entity. 4. (Optional) Select a zone database from the Zone DB list (Enterprise and Professional Plus editions only). 5. Select the zone configuration you want to activate in the Zone Configurations list. 6. Click Activate. 7. Review the information in the Activate Zone Configuration dialog box. a.
Zoning configuration 21 • The selected fabric is not supported by the Management application. • The selected fabric is no longer discovered. 1. Select Configure > Zoning > Fabric. The Zoning dialog box displays. 2. Click the Active Zone Configuration tab. 3. Select a fabric from the Active Zone Configuration list. This identifies the target entity for all subsequent zoning actions and displays the zoning database for the selected entity. 4. Click Deactivate. 5. Click Yes on the confirmation message.
21 Zoning configuration 3. Select a fabric from the Zoning Scope list. This identifies the target entity for all subsequent zoning actions and displays the zoning database for the selected entity. 4. Select one or more zone configurations in the Zone Configurations list that you want to delete, then right-click and select Delete. A message displays asking you to confirm the deletion. 5. Click Yes to delete the selected zone configuration.
Zoning configuration 21 6. Click OK or Apply to save your changes. Any zones or zone configurations you have changed are saved in the zone database. Creating an offline zone database Offline zone databases are supported only in Enterprise and Professional Plus editions. Use this procedure to create a zone database and save it offline. 1. Select Configure > Zoning > Fabric. The Zoning dialog box displays. 2. Click the Zone DB tab if that tab is not automatically displayed. 3.
21 Zoning configuration 2. Select a fabric from the Zoning Scope list. This identifies the target entity for all subsequent zoning actions and displays the zoning databases for the selected entity. 3. Select the offline zone database you want to delete in the Zone DB list. NOTE Only offline databases can be deleted. 4. Select Delete from the Zone DB Operation list. 5. Click Yes on the confirmation message.
Zoning configuration 7. 21 Ensure that the active configurations are the same. a. Load the newly created offline zone database. b. Add the active zones to the zone configuration that is the active configuration on the other fabric. c. Rename the inactive configuration. Merging two zone databases If a zone or zone configuration is merged, the resulting zone or zone configuration includes all members that were marked for addition or removal as well as all members not otherwise marked. 1.
21 Zoning configuration 5. (Optional) Merge elements (zone configurations, zones, or aliases) by completing the following steps: a. Select one or more of the same element type from the Reference Zone DB area. You can select zone configurations, zones, or aliases, but do not mix element types. b. Select the same type of element in the Editable Zone DB area. If you selected a zone configuration in the Reference Zone DB area, you must select a zone configuration in the Editable Zone DB area. c.
Zoning configuration 21 2. Select Compare from the Zone DB Operation list. The Compare/Merge Zone DBs dialog box displays, as shown in Figure 339. 3. Select the database for the first fabric from the Reference Zone DB list. 4. Select the database for the second fabric from the Editable Zone DB list. 5. Set up a zone configuration that contains the active zones in both fabrics: a. Select the name of the active zone configuration from the Reference Zone DB area. b.
21 LSAN zones 5. Click Export Zone DB. 6. Click OK to save your work and close the Zoning dialog box. Importing an offline zone database NOTE You cannot import an online zone database. You cannot import a zone database that contains zones with duplicate members. 1. Select Configure > Zoning > Fabric. The Zoning dialog box displays. 2. Select an offline zone database from the Zone DB list. 3. Select Import from the Zone DB Operation list. The Import Zone DB dialog box displays. 4.
LSAN zones 21 LSAN zones are supported between the following types of fabrics: • Fabric OS and Fabric OS NOTE LSAN zoning is supported only in Enterprise and Professional Plus editions. Configuring LSAN zoning The following procedure provides an overview of the steps you must perform to configure LSAN zoning. Note that for any zoning-related procedure, changes to a zone database are not saved until you click OK or Apply on the Zoning dialog box. 1.
21 LSAN zones Creating an LSAN zone 1. Select a backbone fabric from the Connectivity Map or Product List. 2. Select Configure > Zoning > LSAN Zoning (Device Sharing). The Zoning dialog box displays. 3. Click the Zone DB tab if that tab is not automatically displayed. 4. Click New Zone. The prefix LSAN_ is automatically added in the text field. 5. Enter a name for the zone. For zone name requirements and limitations, refer to “Zone naming conventions” on page 716. 6. Press Enter. 7. Click Activate. 8.
LSAN zones 21 6. Select an option from the Type list. By default, the first time you launch the LSAN Zoning dialog box for a zoning scope, the Potential Members list displays valid members using the following rules: • If you select the WWN type, the valid members display by the Attached Ports. • If you select the WWN-Fabric Assigned type, the valid members display by the ports on which FA-PWWN is configured. For DCB-capable switches, you may need to change the port display options to see the ports.
21 Traffic Isolation zones 6. Click OK to save your changes and close the Add Zone Member dialog box. OR Click Apply to save your changes and keep the Add Zone Member dialog box open so you can add more new members. Repeat step 3 through step 5 as many times as needed, and proceed to step 7 when you have finished adding members. 7. Click Activate. 8. Review the information in the Activate LSAN Zones dialog box. 9. Click OK to activate the LSAN zones.
Traffic Isolation zones 21 NOTE TI zones are not supported with Network OS. Failover options A TI zone can have failover enabled or disabled. Disable failover if you want to guarantee that TI zone traffic uses only the dedicated path, and that no other traffic can use the dedicated path. Enable failover if you want traffic to have alternate routes if either the dedicated or non-dedicated paths cannot be used.
21 Traffic Isolation zones If the fabric contains a switch running an earlier version of Fabric OS, you cannot create an enhanced TI zone. The failover mode must be the same for each enhanced TI zone to which a port belongs. You cannot merge a down-level switch into a fabric containing enhanced TI zones, and you cannot merge a switch with enhanced TI zones defined into a fabric containing switches that do not support ETIZ.
Traffic Isolation zones 21 3. Select a fabric from the Zoning Scope list. This identifies the target entity for all subsequent zoning actions and displays the zoning database for the selected entity. 4. Select Domain, Port Index from the Type list. 5. Select New TI Zone from the New Zone list. 6. Enter a name for the zone. For zone name requirements and limitations, refer to “Zone naming conventions” on page 716. 7. Press Enter. 8. Click OK or Apply to save your changes.
21 Traffic Isolation zones 8. Click the right arrow between the Potential Members list and the Zones list to add the selected ports to the zone. 9. Click OK or Apply to save your changes. The TI zone is saved, but is not activated. Traffic Isolation zones are activated when you activate a zone configuration in the same zone database. Enabling a Traffic Isolation zone NOTE Traffic Isolation zones are configurable only on a Fabric OS device. Use this procedure to enable a Traffic Isolation zone.
Traffic Isolation zones 21 5. Click OK or Apply to save your changes. The Traffic Isolation zone is not disabled until you activate a zone configuration in the same zone database. Enabling failover on a Traffic Isolation zone NOTE Traffic Isolation zones are configurable only on a Fabric OS device. 1. Select Configure > Zoning > Fabric. The Zoning dialog box displays. 2. Click the Zone DB tab if that tab is not automatically displayed. 3. Select a fabric from the Zoning Scope list.
21 Boot LUN zones This identifies the target entity for all subsequent zoning actions and displays the zoning database for the selected entity. 4. Right-click the Traffic Isolation zone upon which you want to disable failover in the Zones list and clear the Configured Failover check box. 5. Click OK or Apply to save your changes. Boot LUN zones A Boot LUN zone is a special zone used to boot from SAN.
Zoning administration 21 The Boot LUN zone is saved to the Active Zone DB. To activate the Boot LUN zone, you must move it to a zone configuration and activate the configuration. Modifying a Boot LUN zone Only one Boot LUN zone can exist for a host port. If you want to change the target port or LUN number, you must create a new Boot LUN zone and overwrite the existing zone. 1. Select Configure > Zoning > Fabric. The Zoning dialog box displays. 2.
21 Zoning administration Comparing zone databases You can compare zone databases against one another to identify any and all differences between their memberships prior to sending them to the switch. Once the two databases have been compared, icons display to show the differences between the two databases. These icons are illustrated and described in Table 69. TABLE 69 Icon Compare icon indicators Description Added—Displays when an element is added to the editable database.
Zoning administration 21 4. Select a database from the Editable Zone DB list. The Reference Zone DB and Editable Zone DB areas display all available element types (zone configurations, zones, and aliases) for the two selected zone databases. In the Editable Zone DB area, each element type and element display with an icon indicator (Table 69) to show the differences between the two databases. 5.
21 Zoning administration Setting change limits on zoning activation Use this procedure to set a limit on the number of changes a user can make to the zone database before activating a zone configuration. If the user exceeds the limit, zone configuration activation is not allowed. By default, all fabrics allow unlimited changes. Changes include adding, removing, or modifying zones, aliases, and zone configurations. Use this procedure to set the following limits: • Set a different limit for each fabric.
Zoning administration 21 2. Select a fabric from the Zoning Scope list. This identifies the target entity for all subsequent zoning actions and displays the zoning databases for the selected entity. 3. Select the Fabric Zone DB from the Zone DB list. 4. Select Clear All from the Zone DB Operation list. 5. Click Yes on the confirmation message. The message closes and the Fabric Zone DB is cleared of all zoning configurations. 6. Click OK to close the Zoning dialog box.
21 Zoning administration 6. Click Find > between the Potential Members list and the Zones list. If the member is found, all instances of the zone member found are highlighted in the Zones list. Finding a zone member in the potential member list Use this procedure to locate a zone member in the Potential Members list on the Zone DB tab. 1. Select Configure > Zoning > Fabric. The Zoning dialog box displays. 2. Click the Zone DB tab if that tab is not automatically displayed. 3.
Zoning administration 21 3. Select a fabric from the Zoning Scope list. This identifies the target entity for all subsequent zoning actions and displays the zoning database for the selected entity. 4. Select the zone configuration member (for example, the zone) in the Zone Configurations list that you want to find in the Zones list. (Press SHIFT or CTRL and click each zone configuration member to select more than one zone configuration member.) 5.
21 Zoning administration 5. Click Close to exit the Un-Zone Members dialog box. Removing an offline device The Management application enables you to remove an offline device from all zones and zone aliases in the selected zone DB. 1. Select Configure > Zoning > Fabric. The Zoning dialog box displays. 2. Select a fabric from the Zoning Scope list. This identifies the target entity for all subsequent zoning actions and displays the zoning database for the selected entity. 3.
Zoning administration 21 6. Enter the WWN, name, domain and port index numbers, or alias—whichever is appropriate for the method you chose in step 5. When you choose the WWN method, you may define a name for the replacement zone member. 7. Click OK. The new zone member replaces the old zone member in the Zones list and the Replace Zone Member dialog box closes. 8. Click OK or Apply to save your changes. Any zones or zone configurations you have changed are saved in the zone database.
21 Zoning administration 1. Select Configure > Zoning > Fabric. The Zoning dialog box displays. 2. Select a fabric from the Zoning Scope list. This identifies the target entity for all subsequent zoning actions and displays the zoning database for the selected entity. 3. Select Offline Utility from the Zone DB Operation list. The Offline Device Management dialog box displays. 4. Clear the Remove column check box for the offline device you want to replace. 5.
Chapter 22 Fibre Channel over IP In this chapter • FCIP services licensing . . . . . . . . . . . . . . . . . . . . . . . . . . . . . . . . . . . . . . . . . • FCIP Concepts . . . . . . . . . . . . . . . . . . . . . . . . . . . . . . . . . . . . . . . . . . . . . . . . • IP network considerations. . . . . . . . . . . . . . . . . . . . . . . . . . . . . . . . . . . . . . . • FCIP platforms and supported features. . . . . . . . . . . . . . . . . . . . . . . . . . . . • FCIP trunking . . . . . . . . . . . .
22 FCIP services licensing FCIP services licensing Most of the FCIP extension services described in this chapter require the High Performance Extension over FCIP/FC license. FICON emulation features require additional licenses. The following features and licensing apply to the 8 Gbps Extension platforms. • FCIP Adaptive Rate Limiting requires the FTR_AE (Advanced Extension) license. • FCIP trunking requires FTR_AE license.
FCIP platforms and supported features 22 FCIP platforms and supported features The following Fabric OS platforms that support FCIP: • The 8 Gbps extension switch. • The 8 Gbps Extension blade (8-slot Backbone Chassis, 4-slot Backbone Chassis). • The 4 Gbps Extension blade (8-slot Backbone Chassis, 4-slot Backbone Chassis, Director Chassis). There are differences in platform capabilities. For example, the 4 Gbps Extension Blade cannot support FCIP trunking or Adaptive Rate Limiting.
22 FCIP trunking The way FCIP tunnels and virtual ports map to the physical GbE ports depends on the switch or blade model. The 8 Gbps Extension Switch and 8 Gbps Extension Blade tunnels are not tied to a specific GbE port, and may be assigned to any virtual port within the allowed range. The 4 Gbps Extension Blade requires tunnels to be mapped to specific GbE ports and specific virtual ports. The mapping of GbE ports to tunnels and virtual port numbers is summarized in Table 71.
FCIP trunking 22 WAN IP Router 10.0.1.1 IP Router 10.0.0.1 FCIP Circuits 10.0.0.2 10.0.0.3 10.0.0.4 10.0.0.5 FCIP Circuits FCIP Tunnel 10.0.1.2 10.0.1.3 10.0.1.4 10.0.1.5 FIGURE 341 FCIP tunnel and FCIP circuits Design for redundancy and fault tolerance Multiple FCIP tunnels can be defined between pairs of 8 Gbps extension switches and 8 Gbps extension Blades, but doing so defeats the concept of a multiple circuit FCIP tunnel.
22 FCIP trunking • In a scenario where a FCIP tunnel has multiple circuits of different metrics the data will flow over the lower metric circuits unless a failover condition occurs, as described in “FCIP circuit failover capabilities”. • The maximum bandwidth for a single circuit is 1 Gbps. However, a maximum of 10 Gbps per circuit is allowed between 10 GbE ports on 8 Gbps Extension Blades when both blades are running Fabric OS 7.0 or greater.
Adaptive Rate Limiting 22 Bandwidth calculation during failover The bandwidth of higher metric circuits is not calculated as available bandwidth on an FCIP tunnel until all lowest metric circuits have failed. For example, assume the following: • Circuits 0 and 1 are created with a metric of 0. Circuit 0 is created with a maximum transmission rate of 1 Gbps, and Circuit 1 is created with a maximum transmission rate of 500 Mbps. Together, Circuits 0 and 1 provide an available bandwidth of 1.5 Gbps.
22 QoS SID/DID priorities over an FCIP trunk QoS SID/DID priorities over an FCIP trunk QoS SID/DID traffic prioritization is a capability of Fabric OS Adaptive Networking licensed feature. This feature allows you to prioritize FC traffic flows between hosts and targets. Four internal TCP connections provide internal circuits for managing QoS SID/DID priorities over an FCIP tunnel, as illustrated in Figure 344.
QoS SID/DID priorities over an FCIP trunk 22 External User Perspective Internal Architecture VE Port Tunnel Circuit High Priority Med.
22 IPsec and IKE implementation over FCIP The Advanced Settings dialog box is displayed. This dialog box has a Transmission tab, Security tab, and FICON Emulation tab. Configure QoS percentages on the Transmission tab (Figure 345). FIGURE 345 Advanced Settings Transmission Tab 5. Click the up or down arrows by QoS High, QoS Medium, and QoS Low to increment values by 1% and override the default values of 50% (high), 30% (medium), and 20% (low). The three values must equal 100%.
IPsec and IKE implementation over FCIP 22 IPsec for the 4 Gbps platforms IPsec uses some terms that you should be familiar with before beginning your configuration. These are standard terms, but are included here for your convenience. Term Definition AES Advanced Encryption Standard. FIPS 197 endorses the Rijndael encryption algorithm as the approved AES for use by US Government organizations and others to protect sensitive information. It replaces DES as the encryption standard.
22 QOS, DSCP, and VLANs IPSec for the 8 Gbps platforms The 8 Gbps platforms use AES-GCM-ESP as a single, pre-defined mode of operation for protecting all TCP traffic over an FCIP tunnel. AES-GCM-ESP is described in RFC-4106. Key features are listed below: • Encryption is provided by AES with 256 bit keys. • The IKEv2 key exchange protocol is used by peer switches and blades for mutual authentication. • IKEv2 uses UDP port 500 to communicate between the peer switches or blades.
QOS, DSCP, and VLANs 22 DSCP settings are useful only if IP routers are configured to enforce QoS policies uniformly within the network. IP routers use the DSCP value as an index into a Per Hop Behavior (PHB) table. Control connections and data connections may be configured with different DSCP values. Before configuring DSCP settings, determine if the IP network you are using implements PHB, and consult with your WAN administrator to determine the appropriate DSCP values.
22 Open systems tape pipelining TABLE 72 Default Mapping of DSCP priorities to L2Cos Priorities (Continued) DSCP priority/bits L2CoS priority/bits Assigned to: 59 / 111011 4 / 100 High QoS 63 / 111111 0 / 000 - Open systems tape pipelining Open Systems Tape Pipelining (OSTP) can be used to enhance open systems SCSI tape write I/O performance. To implement OSTP over FCIP, you must enable the following two features: • FCIP Fastwrite and Tape Acceleration. • FC Fastwrite.
FICON emulation features TABLE 73 22 OSTP constraints FCIP Fastwrite Tape Acceleration Class 3 traffic is accelerated with Fastwrite. Class 3 traffic is accelerated between host and sequential device. With sequential devices (tape drives), there are 1024 initiator-tape (IT) pairs per GbE port, but 2048 initiator-tape-LUN (ITL) pairs per GbE port. The ITL pairs are shared among the IT pairs. For example: Two ITL pairs for each IT pair as long as the target has two LUNs.
22 FCIP configuration guidelines Tape write pipelining FICON tape write pipelining improves performance for a variety of applications when writing to tape over extended distances. FICON tape write pipelining locally acknowledges write data records, enabling the host to generate more records while previous records are in transit across the IP WAN. If exception status is received from the device, the writing of data and emulation is terminated.
FCIP configuration guidelines 22 • The Management application must be able to discover the fabrics the contain the extension switches. • The extension switches should be physically connected to the IP network they will be using to pass data, and the connection should be active and working. • Identify all the devices in the data path between the extension switches, including Ethernet switches, Ethernet routers, firewalls, and common carrier equipment. A network diagram is very helpful.
22 Configuring an FCIP tunnel Configuring an FCIP tunnel When you configure an FCIP extension connection, you create FCIP tunnels and FCIP circuits, between two extension switches. 1. Select Configure > FCIP Tunnels. The FCIP Tunnels dialog box is displayed (Figure 346). All discovered fabrics with extension switches are listed under devices. FIGURE 346 FCIP Tunnels dialog box (fabric selected from Product tree) 2. To add an FCIP tunnel and circuits between switches follow these steps: a.
Configuring an FCIP tunnel 22 FIGURE 347 Add FCIP Tunnel dialog box c. Click Select Switch Two under Switch Two Settings on the Add FCIP Tunnels dialog box to display discovered extension switches in the Select Switch dialog box, The switch name and fabric are displayed in the Switch and Fabric fields. d. Select the switch that you want to connect to switch one. e. Enter a description of the tunnel in the Description field.
22 Adding an FCIP circuit A Circuits properties table displays at the bottom of the dialog box. For 8 Gbps platforms, this may contain columns for multiple circuits. Actual, as well as cached circuits display. You can configure circuits using the Add, Edit, Delete, Enable, and Disable circuits using the function buttons to the right of the table. For 4 Gbps platforms, the Delete, Enable, and Disable buttons do not display. In addition, the Edit operation is only supported for cached circuits. c.
Adding an FCIP circuit 22 1. Select the GiGE Port used for the Ethernet connection on each switch. The choices available depend on the extension switch or blade model. 2. Select Use as failover to configure the 10 GbE port on an 8 Gbps Blade platform as a 10 Gbps lossless failover circuit. 3. Select the IP Address Type. The implementation is a dual IP layer operation implementation as described in RFC 4213.
22 Adding an FCIP circuit 9. Select values for bandwidth settings. An uncommitted bandwidth is not allowed on an FCIP circuit. You must select Committed bandwidth. If you want to use ARL, set Minimum and Maximum bandwidth values. Bandwidth grows towards the maximum and reduces towards the minimum based on traffic conditions. If you do not want to use ARL, set Minimum and Maximum to the same value to set a single committed bandwidth.
Configuring FCIP tunnel advanced settings 22 - Use the Max. Retransmits option to override the default value of 8. As shown, the range is 1 to 8. - Select L2CoS and DSCP priorities. Refer to “QOS, DSCP, and VLANs” on page 770 for more information. - Select OK to save the settings and close the dialog box. 12. Click Apply on the Add FCIP Circuit dialog box to add the circuit and leave the dialog box open to add additional circuits. Click OK to add the circuit and close the dialog box. 13.
22 Configuring FCIP tunnel advanced settings 3. Click OK to commit your selection. For the 8 Gbps Extension Switch and 8 Gbps Extension Blade: 1. Select Advanced Settings on the Add FCIP Tunnel or Edit FCIP Tunnel dialog box to display the Advanced Settings dialog box. 2. From the Transmission tab, select the Enable Compression check box to enable compression. This enables the Compression Mode selector (Figure 350). FIGURE 350 Selecting a compression mode 3. Select the desired compression mode.
Configuring FCIP tunnel advanced settings 22 Enabling Open Systems Tape Pipelining (OSTP) Latency introduced by a long distance IP connection can negatively impact tape I/O performance. OSTP may be used to improve performance on SCSI write I/Os to sequential devices (such as tape drives). When OSTP is used, the extension blades or switches emulate write commands and responses locally to reduce delays caused by latency.
22 Configuring FCIP tunnel advanced settings Configuring IPSec and IKE policies IPSec and IKE policies are configured from the Security tab. The screens and procedures are platform-dependent. Figure 351 on page 784 shows the screen for the 8 Gbps Extension Switch and 8 Gbps Extension Blade. 1. Select Advanced Settings on the Add FCIP Tunnel or Edit FCIP Tunnel dialog box to display the Advanced Settings dialog box. 2. Select the Security tab.
Configuring FCIP tunnel advanced settings 22 • For the 4 Gbps Extension Switch and Blade and the 8 Gbps Extension Blade, the key value must be between 12 and 32 alphanumeric characters. The length depends on the chosen IKE policy. • For the 8Gbps Extension switch, the key value must be a minimum of 32 alphanumeric characters. These policies are used to make the connection more secure through authentication and encryption.
22 Configuring FCIP tunnel advanced settings 3. Select the check boxes for the FICON emulation features you want to implement. The primary FICON emulation features are FICON XRC Emulation (IBM z/OS Global Mirror emulation), tape write pipelining, tape read pipelining, TIN/TUR emulation and device level ACK emulation provide support for the primary features. If you select any of the primary features, you must also select TIN/TUR emulation and device level ACK emulation.
Viewing FCIP connection properties 22 Viewing FCIP connection properties The FCIP connection properties show properties of the blades or switches on both sides of a connection. To view FCIP connection properties, right-click the connection between two extension blades or switches (Figure 353).
22 Viewing General FCIP properties Viewing General FCIP properties Use the following steps to view general FCIP properties for a switch or blade. 1. Right click an extension blade or switch from the Fabric Tree structure or on the Connectivity Map, and select Properties. 2. Select the Properties tab. FIGURE 354 General FCIP properties tab (Extension switch or blade) Use the following steps to view the properties of a chassis where an extension blade is installed. 1.
Viewing FCIP FC port properties 22 FIGURE 355 General FCIP properties tab (blade chassis) Viewing FCIP FC port properties Take the following steps to view FCIP FC port properties. 1. Right click an extension blade or switch from the Fabric Tree structure or on the Connectivity Map, and select Properties. 2. Select the Port tab. 3. Select the FC from the Type drop-down list (Figure 357).
22 Viewing FCIP Ethernet port properties FIGURE 356 FC ports properties Viewing FCIP Ethernet port properties Take the following steps to view Ethernet port properties. 1. Right click an extension blade or switch from the Fabric Tree structure or on the Connectivity Map, and select Properties. 2. Select the Port tab. 3. Select the GigE from the Type drop-down list (Figure 357).
Editing FCIP circuits 22 FIGURE 357 GigE ports properties Editing FCIP circuits FCIP circuit settings may be edited from the Edit FCIP Circuit dialog box. The procedure for launching this dialog box for the 4 Gbps Extension Switch and Blade is different than the procedure for the 8 Gbps Extension Switch and the 8 Gbps Extension Blade.
22 Disabling FCIP tunnels 3. Select Edit to the right of the Circuits properties table at the bottom of the dialog box. The Edit FCIP Circuit dialog box displays. For the 8 Gbps Extension Switch and the 8 Gbps Extension Blade: 1. Select Edit. The Edit FCIP Tunnel dialog box displays. 2. Select a circuit that you want to edit from the Circuits properties table at the bottom of the dialog box and select Edit. The Edit FCIP Circuit dialog box displays (Figure 358). FIGURE 358 Edit FCIP Circuit dialog box 3.
Enabling FCIP tunnels 22 Enabling FCIP tunnels 1. From the FCIP Tunnels dialog box, select the tunnel you want to enable. 2. Select Enable. 3. Click OK to enable the tunnel. Deleting FCIP tunnels 1. From the FCIP Tunnels dialog box, select the tunnel you want to delete. 2. Select the Delete. A confirmation dialog box displays, warning you of the consequences of deleting a tunnel. 3. Click OK to delete the tunnel. Disabling FCIP circuits 1.
22 Deleting FCIP Circuits Deleting FCIP Circuits 1. From the FCIP Tunnels dialog box, select the tunnel that contains the circuit. 2. Select Edit. The Edit FCIP Tunnel dialog box displays. 3. Select the circuit that you want to delete from the Circuit properties table at the bottom of the dialog box. 4. Select Delete. 5. For tunnels with multiple circuits, select additional circuits from the table to delete and select Delete after each selection. 6. Click OK to delete the circuit(s).
Displaying tunnel properties from the FCIP tunnels dialog box 22 Displaying tunnel properties from the FCIP tunnels dialog box Tunnel properties can be displayed from the FCIP Tunnels dialog box. 1. Select a tunnel from the FCIP tunnels dialog box. 2. Select the Tunnel tab. Tunnel properties are displayed.
22 Displaying FCIP circuit properties from the FCIP tunnels dialog box Displaying FCIP circuit properties from the FCIP tunnels dialog box Tunnel properties can be displayed from the FCIP Tunnels dialog box using the following procedure. 1. Select a tunnel from the FCIP tunnels dialog box. 2. Select the Circuit tab. Circuit properties are displayed (Figure 360).
Displaying switch properties from the FCIP Tunnels dialog box 22 Displaying switch properties from the FCIP Tunnels dialog box Switch properties are displayed on the FCIP Tunnels dialog box when you select a switch (Figure 361).
22 Displaying fabric properties from the FCIP Tunnels dialog box Displaying fabric properties from the FCIP Tunnels dialog box Fabric properties are displayed on the FCIP Tunnels dialog box when you select a fabric. (Figure 362). FIGURE 362 Fabric properties on the FCIP Tunnels dialog box Troubleshooting FCIP Ethernet connections 1. Right-click a blade an extension blade or switch from the Fabric Tree structure or Connectivity Map, and select Properties. 2. Select the Port tab. 3.
Chapter Fabric Binding 23 In this chapter • Fabric Bining overview. . . . . . . . . . . . . . . . . . . . . . . . . . . . . . . . . . . . . . . . . . 799 • High integrity fabrics overview . . . . . . . . . . . . . . . . . . . . . . . . . . . . . . . . . . . 804 Fabric Bining overview NOTE Fabric Binding is supported on Fabric OS 5.2 or later. The fabric binding feature enables you to configure whether switches can merge with a selected fabric.
23 Fabric Bining overview FIGURE 363 Fabric Binding dialog box 2. Review the fabric binding membership details. • Fabric List table — Lists the fabrics in your network. Fabric Name — The name of the fabric. Fabric WWN — The world wide name of the fabric. Binding Status — The binding status (enabled/disabled) of the fabric. Enable/Disable check box — Indicates whether fabric binding is enabled. Select to enable a fabric binding for the fabric.
Fabric Bining overview 23 • Membership List of Fabric_Name table — The current Fabric Membership List (FML) of the highlighted fabric, including the following details: Name — The name of the switch fabric. Node WWN — The node WWN of an available or member switch. Domain ID — The domain ID of an available or member switch. Fabric Name — The name of the fabric. Fabric WWN — The world wide name of the fabric. Attached — Whether or not the switch is attached.
23 Fabric Bining overview 2. In the Fabric List table, click the Enable/Disable check box for fabrics for which you want to configure fabric binding. For instructions on adding and removing switches from the membership list, refer to “Adding switches to the fabric binding membership list” on page 803 and “Removing switches from fabric binding membership” on page 804. 3. Click OK on the Fabric Binding dialog box.
Fabric Bining overview 23 Adding switches to the fabric binding membership list Once you have enabled Fabric Binding (refer to “Enabling fabric binding” on page 801), you can add switches to the fabric binding membership list. NOTE Fabric Binding is only supported on Fabric OS 5.2 or later. To add a switch to the fabric, complete the following steps. 1. Select Configure > Fabric Binding. The Fabric Binding dialog box displays (Figure 363). 2.
23 High integrity fabrics overview Removing switches from fabric binding membership Once you have enabled Fabric Binding (refer to “Enabling fabric binding” on page 801), you can remove switches that are not part of the fabric from the membership list. NOTE Fabric Binding is only supported on Fabric OS 5.2 or later. 1. Select Configure > Fabric Binding. The Fabric Binding dialog box displays (Figure 363). 2.
High integrity fabrics overview 23 • A policy must be set that limits connectivity to only the switches within the same fabric. Fabric binding is a security method for restricting switches that may join a fabric. For Fabric OS switches, fabric binding is implemented by defining a switch connection control (SCC) policy that prevents unauthorized switches from joining a fabric. • Dynamic Load Sharing (DLS) should be disabled.
23 High integrity fabrics overview Deactivating high integrity fabrics NOTE Deactivating high integrity fabrics is not supported in a pure Fabric OS environment. To deactivate a HIF, complete the following steps. 1. Select Configure > High Integrity Fabric. The High Integrity Fabric dialog box displays (Figure 364). 2. Select the fabric on which you want to deactivate HIF from the Fabric Name list. The HIF status displays in the High Integrity Fabric field. 3. Click Deactivate.
Chapter 24 Port Fencing In this chapter • About port fencing . . . . . . . . . . . . . . . . . . . . . . . . . . . . . . . . . . . . . . . . . . . . . • Thresholds . . . . . . . . . . . . . . . . . . . . . . . . . . . . . . . . . . . . . . . . . . . . . . . . . . . • Adding thresholds . . . . . . . . . . . . . . . . . . . . . . . . . . . . . . . . . . . . . . . . . . . . . • Editing thresholds . . . . . . . . . . . . . . . . . . . . . . . . . . . . . . . . . . . . . . . . . . . . . • Removing thresholds.
24 About port fencing Viewing port fencing configurations NOTE This feature is only available for Fabric OS devices. NOTE This feature requires a Trial or Licensed version. Port Fencing allows you to protect your SAN from repeated operational or security problems experienced by ports. Use Port Fencing to set threshold limits for the number of specific port events permitted during a given time period on the selected object.
About port fencing 24 • Thresholds table — List of configured thresholds based on the threshold type selected in the Violation Type list. Limit (Fabric OS) — The number of events allowed for the assigned threshold. If the object has no fencing support or no fencing changes, this field displays two hyphens separated by a space (- -). When the object is only partially managed by the management application, this field displays as inactive (grayed-out).
24 Thresholds Operational State — The operational state of the port. Blocked Configuration — The current configuration of the port (Blocked or Unblocked). Port WWN — The port world wide name of the port. Connected Product — The device label of the connected object. Connected Port # — The port number of the connected port. Connected Port WWN — The port world wide name of the connected port. Connected Port Name — The name of the connected port configured in the Element Manager.
Thresholds 24 C3 Discard Frames threshold NOTE This threshold is only available for Fabric OS devices running 6.3 or later. Use this type of threshold to block a port when a C3 Discard Frames violation meets the Fabric OS switch threshold. This threshold is only supported on directors, switches, and blades with a 4 Gbps, 8 Gbps, or 16 Gbps ASIC.
24 Thresholds Invalid CRCs threshold NOTE This threshold is only available for Fabric OS devices. Use this type of threshold to block a port when an Invalid CRCs violation meets the Fabric OS switch threshold. Invalid words threshold NOTE This threshold is only available for Fabric OS devices. Use this type of threshold to block a port when an Invalid Words violation meets the Fabric OS switch threshold. Link Reset threshold NOTE This threshold is only available for Fabric OS devices.
Adding thresholds 24 Adding thresholds NOTE This feature requires a Trial or Licensed version. The Management application allows you to create Invalid CRCs, Invalid words, Link, Link Reset, Protocol Error, Security, and Sync Loss thresholds. Adding a C3 Discard Frames threshold NOTE This threshold is only available for Fabric OS devices running 6.3 or later. Use to block a port when a C3 Discard Frames violation type meets the Fabric OS switch threshold.
24 Adding thresholds FIGURE 367 Add C3 Discard Frames Threshold dialog box 4. Enter a name for the threshold in the Name field. 5. Select one of the following options: • Default — Uses device defaults. Go to step 8. • Custom — Uses your selections. Continue with step 6. 6. Enter the number of C3 discarded frames allowed for the threshold in the Threshold errors field. 7. Select the time period for the threshold from the errors per list.
Adding thresholds 24 Adding an Invalid CRCs threshold NOTE This threshold is only available for Fabric OS devices. NOTE This feature requires a Trial or Licensed version. Use to block a port when an Invalid CRC violation type meets the Fabric OS switch threshold. For default threshold values for Fabric OS devices, refer to Chapter 7 of the Fabric Watch Administrator's Guide. To add an Invalid CRCs threshold, complete the following steps. 1. Select Monitor > Fabric Watch > Port Fencing.
24 Adding thresholds 8. Click OK to add the Invalid CRCs threshold to the table and close the Add Invalid CRCs Threshold dialog box. To assign this threshold to fabrics, switches, or switch ports, refer to “Assigning thresholds” on page 821. 9. Click OK on the Port Fencing dialog box. Adding an Invalid Words threshold NOTE This threshold is only available for Fabric OS devices. NOTE This feature requires a Trial or Licensed version.
Adding thresholds 24 • Minute — the port is blocked as soon as the specified number of invalid words allowed is reached within a minute. • Hour — the port is blocked as soon as the specified number of invalid words allowed is reached within a hour. • Day — the port is blocked as soon as the specified number of invalid words allowed is reached within a day. 8. Click OK to add the Invalid Words threshold to the table and close the Add Invalid Words Threshold dialog box.
24 Adding thresholds 7. Select the time period for the threshold from the errors per list. The following choices are available: • None — the port is blocked as soon as the specified number of link resets allowed is met. • Second — the port is blocked as soon as the specified number of link resets allowed is reached within a second. • Minute — the port is blocked as soon as the specified number of link resets allowed is reached within a minute.
Adding thresholds 24 FIGURE 371 Add Protocol Error Threshold dialog box 4. Enter a name for the threshold in the Name field. 5. Select the Fabric OS check box. a. Select one of the following options: • Default — Uses device defaults. Go to step 6. • Custom — Uses your selections. Continue with step b. b. Enter the number of protocol errors allowed for the threshold from the Threshold errors field. c. Select the time period for the threshold from the errors per list.
24 Adding thresholds Adding a State Change threshold NOTE This threshold is only available for Fabric OS devices running 6.3 or later. NOTE This feature requires a Trial or Licensed version. Use to block a port when a state change violation type meets the Fabric OS switch threshold. For 4 Gbps Router, Extension Switches and Blades only, when you apply this threshold on an E Port, the threshold is also applied to the VE Ports (internally by Fabric OS).
Adding thresholds 24 • Hour — the port is blocked as soon as the specified number of state changes allowed is reached within a hour. • Day — the port is blocked as soon as the specified number of state changes allowed is reached within a day. 8. Click OK to add the state changes threshold to the table and close the Add State Change Threshold dialog box. To assign this threshold to fabrics, switches, or switch ports, refer to “Assigning thresholds” on page 821. 9. Click OK on the Port Fencing dialog box.
24 Adding thresholds Unblocking a port The Management application allows you to unblock a port (only if it was blocked by Port Fencing) once the problem that triggered the threshold is fixed. When a port is blocked an Attention icon ( ) displays next to the port node. To unblock a port, complete the following steps. 1. Select Monitor > Fabric Watch > Port Fencing. The Port Fencing dialog box displays. 2. Right-click anywhere in the Ports table and select Expand. 3.
Editing thresholds 24 Editing thresholds The Management application allows you to edit the name, number of events needed, and time period of ISL Protocol, Link, and Security thresholds. Editing a C3 Discard Frames threshold NOTE This threshold is only available for Fabric OS devices. NOTE This feature requires a Trial or Licensed version. Use to block a port when a C3 Discard Frames violation type meets the Fabric OS switch threshold. To edit a C3 Discard Frames threshold, complete the following steps.
24 Editing thresholds 3. Select the threshold you want to change and click Edit. The Edit Invalid CRCs Threshold dialog box displays. 4. Complete step 4 through step 7 in “Adding an Invalid CRCs threshold” on page 815. 5. Click OK on the Edit Invalid CRCs Threshold dialog box. If the threshold has already been assigned to ports, an “Are you sure you want to make the requested changes to this threshold on “X” ports?” message displays. Click OK to close.
Editing thresholds 24 Editing a Link Reset threshold NOTE This threshold is only available for Fabric OS devices. NOTE This feature requires a Trial or Licensed version. Use to block a port when the Link Reset violation type meets the Fabric OS switch threshold. To edit a Link Reset threshold, complete the following steps. 1. Select Monitor > Fabric Watch > Port Fencing. The Port Fencing dialog box displays. 2. Select Link Reset (Fabric OS only) from the Violation Type list. 3.
24 Editing thresholds 3. Select the threshold you want to change and click Edit. The Edit Protocol Error Threshold dialog box displays. 4. Complete step 4 through step 5 in “Adding a Protocol Error threshold” on page 818. 5. Click OK on the Edit Protocol Error Threshold dialog box. If the threshold has already been assigned to ports, an “Are you sure you want to make the requested changes to this threshold on “X” ports?” message displays. Click OK to close.
Editing thresholds 24 Finding assigned thresholds The Management application allows you to find all ports with a specific threshold applied. NOTE This search is performed on the threshold name. Since Fabric OS devices do not retain the threshold name, the ability to search for a threshold on a Fabric OS device is not available in most cases. To find assigned thresholds, complete the following steps. 1. Select Monitor > Fabric Watch > Port Fencing. The Port Fencing dialog box displays. 2.
24 Removing thresholds 4. Review the Thresholds table. • • • • • • • • • # (Number) — The line number for each threshold in the table. Status — The threshold status. Directly Assigned Indicator — Whether or not the threshold was directly assigned. Name — The threshold name. Limit — The number of events required to trigger the threshold. Period — The time limit required (for the number of events) to trigger a port blocking action. Area — The threshold type. Class — The port type.
Removing thresholds 24 A directly assigned icon ( ) displays next to each object with an assigned threshold which does not inherit a threshold from higher in the tree. NOTE If you remove a threshold from All Fabrics, it removes the threshold from individual Fabrics, switches, and switch ports in all Fabrics except for a Chassis group. You must remove repeat the procedure for the Chassis group. 5. Click OK on the Port Fencing dialog box.
24 830 Removing thresholds Brocade Network Advisor SAN User Manual 53-1002696-01
Chapter 25 FICON Environments In this chapter • FICON Configurations . . . . . . . . . . . . . . . . . . . . . . . . . . . . . . . . . . . . . . . . . . • Configuring an Allow/Prohibit Matrix . . . . . . . . . . . . . . . . . . . . . . . . . . . . . . • Configuring an Allow/Prohibit Matrix manually . . . . . . . . . . . . . . . . . . . . . . • Saving or Copying Allow/Prohibit Matrix configurations to another device • Activating an Allow/Prohibit Matrix configuration . . . . . . . . . . . . . . . . . . .
25 Configuring FICON display FIGURE 374 Cascaded configuration, three domains, but only two in a path Configuring FICON display You can set display settings for FICON display so that the columns of any table that contains end device descriptions to move the following eight columns to be the first columns: FC Address, Serial #, Tag, Device Type, Model, Vendor, Port Type, and WWN. For instructions, refer to “SAN display settings” on page 84.
Configuring an Allow/Prohibit Matrix 25 • Double-click a configuration file. • Select a configuration file and click the right arrow. A matrix displays. The switch ports are displayed on both the vertical axis and horizontal axis. A green circle icon ( ) indicates communication is allowed between the ports. FIGURE 375 Active Configuration 4. Prohibit a connection between two ports by clicking the intersection point between the ports. A prohibit icon ( ) displays at the intersection point.
25 Configuring an Allow/Prohibit Matrix manually Configuring an Allow/Prohibit Matrix manually NOTE If you receive a 'FICON not supported on switch' error, refer to FICON troubleshooting for a list of possible causes. To configure to allow or prohibit communication between specific ports manually, complete the following steps. 1. Select Configure > Allow/Prohibit Matrix. The Configure Allow/Prohibit Matrix dialog box displays. 2. Select a switch from Available Switches.
Saving or Copying Allow/Prohibit Matrix configurations to another device 25 8. Click Add. The information displays in the Selected Ports for Modification table. To delete any of these manual configurations, select the configuration you want to delete in the Selected Ports for Modification table and click Remove. The table displays the following information: • Port Address 1 column—The port number of the first port for which you want to allow or prohibit communication.
25 Saving or Copying Allow/Prohibit Matrix configurations to another device Copying an Allow/Prohibit Matrix configuration NOTE If you receive a 'FICON not supported on switch' error, refer to FICON troubleshooting for a list of possible causes. To duplicate an existing Allow/Prohibit Matrix configuration, complete the following steps. 1. Select Configure > Allow/Prohibit Matrix. The Configure Allow/Prohibit Matrix dialog box displays. 2. Select the Allow/Prohibit Matrix configuration you want to copy.
Saving or Copying Allow/Prohibit Matrix configurations to another device 25 Saving an Allow/Prohibit Matrix configuration to another device NOTE If you receive a 'FICON not supported on switch' error, refer to FICON troubleshooting for a list of possible causes. To save an existing Allow/Prohibit Matrix configuration to another device, complete the following steps. 1. Select Configure > Allow/Prohibit Matrix. The Configure Allow/Prohibit Matrix dialog box displays. 2.
25 Activating an Allow/Prohibit Matrix configuration Activating an Allow/Prohibit Matrix configuration NOTE If you receive a 'FICON not supported on switch' error, refer to FICON troubleshooting for a list of possible causes. You must have an active zone configuration before you can activate a Allow/Prohibit Matrix configuration. 1. Select Configure > Allow/Prohibit Matrix. The Configure Allow/Prohibit Matrix dialog box displays. 2. Select the Allow/Prohibit Matrix configuration you want to activate.
Deleting an Allow/Prohibit Matrix configuration 25 Deleting an Allow/Prohibit Matrix configuration NOTE If you receive a 'FICON not supported on switch' error, refer to FICON troubleshooting for a list of possible causes. You cannot delete the active configuration, the IPL configuration, or a configuration that is marked as having uncommitted changes. 1. Select Configure > Allow/Prohibit Matrix. The Configure Allow/Prohibit Matrix dialog box displays. 2.
25 Cascaded FICON fabric Clearing port names Select the Clear Port Names option below the matrix display to clear all port names from the selected matrix. Perform the following steps to change the display to the desired format. 1. Select Clear Port Names. A warning displays asking you to confirm the operation. 2. Select Yes to clear all port names from the matrix or select No to cancel the operation.
Cascaded FICON fabric 25 Configuring a cascaded FICON fabric NOTE If you receive a 'FICON not supported on switch' error, refer to FICON troubleshooting for a list of possible causes. The FICON wizard automatically creates high integrity fabric configuration settings that support a cascaded FICON fabric. 1. Select Configure > FICON > Configure Fabric or right-click a fabric in the product tree and select FICON > Configure Fabric.
25 Cascaded FICON fabric 5. Select to enable port-based, exchange-based, or device-based routing on switches. If you select Port-Based Routing, enables port-based routing on 4 Gbps platform switches. If you select Exchange-Based Routing, enables exchange-based routing for the fabric if all switches are 8 Gbps or greater platforms running Fabric OS 6.4 or later. If these requirements are not met, an error message displays.
Cascaded FICON fabric merge 25 Cascaded FICON fabric merge The Management application provides a wizard to help you merge two fabrics for cascaded FICON. Note that merging two cascaded FICON fabrics may be disruptive to current I/O operations in both fabrics, as it needs to disable and enable the switches in both fabrics. The merge process will not make any configuration changes on the primary (production) fabric that are disruptive.
25 Cascaded FICON fabric merge • (Optional) Turns on FICON Management Server (FMS) mode on all switches. If some switches already have FMS mode enabled, it is re-enabled. - If switches are running Fabric OS 7.0 and later, FMS will not be enabled on switches that do not have an active CUP license. - If switches are running Fabric OS earlier than 7.
Cascaded FICON fabric merge 25 Merging two cascaded FICON fabrics NOTE If you receive a 'FICON not supported on switch' error, refer to FICON troubleshooting for a list of possible causes. If you want to join two cascaded FICON fabrics, they must be merged. If the distance between fabrics is 10 km or more, an Extended Fabrics license is required, and an extra step is required to configure the connection as a long distance connection.
25 Cascaded FICON fabric merge 8. Click Next. The Check merge screen displays. A Status details table shows progress through merge check points. A rotating arrow under Status indicates a Merge check step is in progress. A blue check mark indicates successful completion of that Merge check. A red stop sign indicates a failed step. If the configuration is successful, all configuration items have blue check marks. 9. If the merge fails, but is recoverable, click Resolve. 10.
Cascaded FICON fabric merge 25 Resolving merge conflicts You can resolve the following types of switch configuration conflicts: • • • • Domain ID TOV Buffer To Buffer Credit Disable Device Probe NOTE This test will be skipped if all primary and secondary fabric switches are found to be Fabric OS v7.0 and above. • • • • • • Route Priority Per Frame Sequence Level Switching Suppress Class F Long Distance Setting Data Field Size VC Priority Note that not all tests support resolution.
25 Port Groups 5. Perform step 11 through step 14 of the procedure “Merging two cascaded FICON fabrics” on page 845 to finish resolving a merge conflict. Port Groups A port group is a group of FC ports from one or more switches within the same fabric. Port groups are user-specific, you can only view and manage port groups that you create. The ports display in the order in which you add them to the port group.
Port Groups 25 FIGURE 381 Port Groups dialog box 2. Click New. 3. Enter a name for the port group in the Name field. 4. Enter a description for the port group in the Description field. 5. Select one or more ports to add to the group in the Group Type - FC Ports table. A port group must have at least one port in the Membership List. All ports must be from switches in the same fabric. 6. Click the right arrow button. The selected ports display in the Membership List. 7. Click Update.
25 Port Groups Viewing port groups Port groups are user-specific, you can only view and manage port groups that you create. To view port groups, complete the following steps. 1. Select Configure > Port Groups. The Port Groups dialog box only displays port groups defined by you. If a fabric becomes un-monitored, any port groups associated with that fabric do not display in the Port Groups table. Once the fabric becomes monitored again, the associated port groups display in the Port Groups table.
Swapping blades 7. 25 Select one or more ports to remove from the group in the Membership List table. 8. Click the left arrow button. The selected ports are removed from the Membership List. 9. Click Update. 10. Click OK. Deleting a port group To delete a port group, complete the following steps. 1. Select Configure > Port Groups. The Port Groups dialog box displays. 2. Select the port group you want to delete in the Port Groups table. 3. Click Remove.
25 Swapping blades 1. Select a chassis that contains at least two of the same type of blades. 2. Select Configure > Switch > Swap Blades. The Swap Blades dialog box displays. 3. Select the blade you want to replace from the first Swap Blades list. Once you select a blade, the second list automatically filters out the selected blade and any blade types that do not match the selected blade. 4. Select the blade with which you want to replace the first blade from the second Swap Blades list. 5.
Chapter 26 VLAN Management In this chapter • VLAN Manager . . . . . . . . . . . . . . . . . . . . . . . . . . . . . . . . . . . . . . . . . . . . . . . . • Port VLANs . . . . . . . . . . . . . . . . . . . . . . . . . . . . . . . . . . . . . . . . . . . . . . . . . . . • Spanning Tree Protocol configuration . . . . . . . . . . . . . . . . . . . . . . . . . . . . . • VLAN routing . . . . . . . . . . . . . . . . . . . . . . . . . . . . . . . . . . . . . . . . . . . . . . . . .
26 VLAN Manager Configuration requirements for VLAN Manager Before you can manage VLANs with VLAN Manager, you must complete the following tasks: • Make sure that the discovery process has been run. Discovery captures configuration information from Brocade products and places that information in the Management application database. Refer to Chapter 4, “Discovery” for details on running discovery.
VLAN Manager 26 VLAN management in a VCS environment Table 74 lists the VLAN management features that are supported in VCS mode (Fabric mode) and standalone mode.
26 VLAN Manager Displaying VLANs in the VLAN view The VLAN View tab displays all the VLANs discovered on the network and lists them by VLAN IDs (Figure 382). FIGURE 382 VLAN Manager dialog box - VLAN View tab To view the VLANs or products in the VLAN View tab, complete the following steps. 1. Click the VLAN View tab in the VLAN Manager dialog box. 2. Expand the folder under the VLAN View tab, then double-click a super-aggregated VLAN to display its port VLANs or Products.
VLAN Manager 26 3. Select a VLAN to expand the list of products listed under that VLAN. Use the Search tool to find VLANs, products, or ports quickly. A VLAN may be listed several times. For example, the first three VLAN1s have only one product. Each product in each VLAN is in its own broadcast domain and either does not have connectivity with other products or FDP or LLDP is not enabled on that product. The fourth VLAN1 has several products listed under it.
26 Port VLANs FIGURE 383 VLAN Manager dialog box - Product View tab 2. Expand a product to display the port VLANs that have been configured on that product. 3. Click a VLAN in the list to display the interfaces on that product that belong to the VLAN. Port VLANs VLAN Manager facilitates the creation, modification, and deletion of port VLANs on products that are known to the Management application. It also aids in the bulk deployment of these VLANs. For example, VLAN 3 can be configured on four products.
Port VLANs 26 FIGURE 384 Add VLAN dialog box - Ports tab 3. Enter a VLAN ID in the Configure VLAN field. You can enter more than one ID, separating individual IDs with a comma (for example, 10, 45, 79, 30). For DCB products, the VLAN ID range is from 1 through 3583. 4. Click the Load Products button. Products that already have the entered VLAN IDs configured on them are automatically moved to the Selected Products list. The Load Products button is disabled by default. 5.
26 Port VLANs 10. Complete one of the following tasks: • If you want to assign the interface to the VLAN as an untagged port, click Untag. • If you want to assign the interface to the VLAN as a tagged port, click Tag. • If you want to make the VLAN on the interface dual mode, assign that interface as tagged and select the same interface and assign as untagged to another VLAN. Dual mode ports can be added to any VLAN except for the default (VLAN 1).
Port VLANs 26 Adding or modifying dual mode ports You can configure an interface in a VLAN as a dual mode port by assigning it as a tagged port to one VLAN and as an untagged port to another VLAN. You can add a dual mode port to any VLAN except the default VLAN, VLAN 1. To add or modify a dual mode port, perform the following steps. 1. Follow the steps in “Adding or modifying port VLANs” on page 858 to familiarize yourself with adding tagged and untagged ports to a VLAN. 2.
26 Port VLANs Adding VLAN properties The Add VLAN dialog box has two tabs: Ports and Properties. The VLAN properties vary for different products, for example: • When an IOS VLAN is selected, the Name, QoS, Spanning Tree and Router Interface fields and Transparent Flooding enable check box display. • When a DCB VLAN or product is selected and moved to the Products/VLAN list, the Name and Admin Status fields and the FCoE check box display. All the fields displayed for DCB products are read-only.
Port VLANs 26 4. Enter the following information: For IOS VLAN Properties: - Name—Displays the name of the VLAN, which is editable. QoS—Select a QoS level from the list. • Select Low (None or 0) through High (7) for NetIron CES products. Select None for NetIron CER and NetIron CES products if the product does not have VLAN priority configured. (None applies only to NetIron CER and NetIron CES products.) • Select Low (0) through High (7) for all other Brocade IP products.
26 Port VLANs Modifying port VLAN properties Complete the following steps to modify port VLANs using the VLAN View tab or the Product View tab on the Edit VLAN dialog box. 1. On the VLAN Manager dialog box, click the VLAN View or Product View tab. 2. If in the VLAN view, select and expand a VLAN entry, or if in the Product view, select and expand a product and click the Edit button. The Ports tab of the Edit VLAN dialog box displays. 3. Select the VLAN type from the Target Context list.
Spanning Tree Protocol configuration 26 Deploying VLAN configurations The Deploy VLANs dialog box allows you to deploy a VLAN configuration to target products. Duplicate action is not supported. 1. Select a deployment option: • Click the Deploy now option if you want to deploy the VLAN definition. • Click the Save deployment only option if you want to save the VLAN definition without scheduling its deployment. • Click the Schedule option if you want to schedule the deployment of the VLAN definition. 2.
26 Spanning Tree Protocol configuration • MSTP—Multiple Spanning Tree Protocol (IEEE 802.1s Internet standard) allows several VLANs to be mapped to a reduced number of spanning tree instances. This is possible because most networks do not need more than a few logical topologies. Each instance handles multiple VLANs that have the same Layer 2 topology. DCB and IronWare products in standalone mode support STP, Rapid STP (RSTP), and Multiple STP (MSTP).
Spanning Tree Protocol configuration 26 FIGURE 387 STP Configuration dialog box 3. Select the target switch, VLAN, or port from the Target Context list. Target contexts and spanning tree options at the product, VLAN, or port level are listed in Table 76.
26 Spanning Tree Protocol configuration 10. The Force Version list is available only if you selected RSTP. This parameter forces the bridge to send BPDUs in a specific format. You can enter one of the following values: • 0: The bridge has been forced to operate in STP default mode. • 1: The bridge has been forced to operate in RSTP default mode. 11. Specify an interval in the Re-enable Port Interval field, available only if you selected RSTP.
Spanning Tree Protocol configuration 7. 26 Click Start on the Deployment Status dialog box to save the changes to the selected products. 8. After the deployment has successfully completed, click Close to close the Deployment Status dialog box. Configuring MSTP on a product You can configure MSTP attributes from the VLAN View tab or the Product View tab on the VLAN Manager dialog box. 1.
26 Spanning Tree Protocol configuration 7. Enter the number of seconds a bridge waits (the listen and learn period) before it begins to forward data packets in the Forward Delay field. The values range from 4 through 30 seconds. The default is 15 seconds. 8. Enter the number of seconds a root bridge waits before it sends the next BPDU in the Hello Time field. The values range from 1 through 10 seconds. The default is 2 seconds. 9.
VLAN routing 26 Adding an MSTP instance 1. Click the STP button on the VLAN Manager dialog box to display the STP Configuration dialog box. 2. Select a VLAN node (in this example, a FOS node) in the Selected VLANs list, and click the left arrow button. The target is automatically set to FOS VLAN in the Target Context list. 3. Select MSTP from the Spanning Tree list. The STP Configuration dialog box displays the Available MSTP Instances list. 4.
26 VLAN routing Managing IP addresses on an SVI Switch Virtual Interfaces (SVIs) can be added to port VLANs when you create or modify VLAN definitions. SVIs can only be created in Layer 3 products. Once VLAN definitions are deployed to products, you can add an IP address to the SVI by completing the following steps. 1. On the VLAN Manager dialog box, complete one of the following tasks: - Click the VLAN View tab and expand the VLAN node. Select the product that contains the SVI that you want to define.
VLAN routing 26 4. Enter the following information: - Primary or Secondary options (DCB products only)—Indicates whether the IP address is the primary or secondary IP address of the VLAN. - Type—Select the type of IP address you want to assign to the VLAN. Choose CIDR or IP/Subnet. - Enter the IP address in the fields provided: • If you chose the CIDR format, enter a subnet address in the subnet_address/subnet_mask_bits format (for example, 192.168.2.10/24).
26 874 VLAN routing Brocade Network Advisor SAN User Manual 53-1002696-01
Chapter 27 Deployment Manager In this chapter • Introduction to the Deployment Manager . . . . . . . . . . . . . . . . . . . . . . . . . . • Editing a deployment configuration . . . . . . . . . . . . . . . . . . . . . . . . . . . . . . . • Duplicating a deployment configuration . . . . . . . . . . . . . . . . . . . . . . . . . . . • Deleting a deployment configuration . . . . . . . . . . . . . . . . . . . . . . . . . . . . . . • Deploying a configuration . . . . . . . . . . . . . . . . . . . . . . . . .
27 Editing a deployment configuration Editing a deployment configuration 1. Select Configure > Deployment. The Deployment dialog box displays, as shown in Figure 391. FIGURE 391 Deployment dialog box 2. Select a deployment configuration in the Saved or Scheduled tab. Policy-based routing configurations cannot be edited. 3. Click Edit. A dialog box specific to the type of deployment displays. This is the same dialog box that was used when the deployment was created. 4.
Duplicating a deployment configuration 27 Duplicating a deployment configuration 1. Select Configure > Deployment. The Deployment dialog box displays. 2. Select a deployment configuration in the Saved or Scheduled tab. NOTE VLAN configurations and policy-based routing configurations cannot be duplicated. 3. Click Duplicate. A dialog box specific to the type of deployment displays. This is the same dialog box that was used when the original deployment was created. 4.
27 Viewing deployment logs Viewing deployment logs 1. Select Configure > Deployment. The Deployment dialog box displays. 2. Click the Log tab. A list of deployment configurations that are executed and the status of each displays. Generating a deployment report 1. Select Configure > Deployment. The Deployment dialog box displays. 2. Select a deployment in the Saved, Scheduled, or Log tab. 3. Click Report. An HTML report displays.
Searching the configuration snapshots 27 Searching the configuration snapshots 1. Select Configure > Deployment. The Deployment dialog box displays. 2. Select a deployment in the Saved, Scheduled, or Log tab. 3. Click Snapshot. The Configuration Snapshot Search dialog box displays. 4. Identify the targets you want to search. Select a target in the Available Targets list and click the right arrow to move the target to the Selected Targets list. 5. Define search criteria.
27 Comparing configuration snapshots FIGURE 392 Compare dialog box The Compare dialog box displays the following information: • Product — The IP address of the device. • Date — The Displays the date the device configuration was taken. • Change Navigator buttons/legend — The Enabled when there is at least one change between to two compared files. Go to first change button ( )—Click to move to the first change. Go to previous change button ( )—Click to move to the previous change.
Chapter Fibre Channel Troubleshooting 28 In this chapter • FC troubleshooting . . . . . . . . . . . . . . . . . . . . . . . . . . . . . . . . . . . . . . . . . . . . 881 • FCIP troubleshooting . . . . . . . . . . . . . . . . . . . . . . . . . . . . . . . . . . . . . . . . . . . 890 FC troubleshooting NOTE FC troubleshooting is only available for Fabric OS devices.
28 FC troubleshooting Tracing FC routes The Management application enables you to select a source port and a destination port and displays the detailed routing information from the source port or area on the local switch to the destination port or area on another switch. NOTE Trace route cannot be performed on offline devices. NOTE Trace route cannot be performed in a mixed (Fabric OS) fabric. Fabric OS trace route requirements • Fabric OS trace route is only supported in a pure-Fabric OS fabric.
FC troubleshooting 28 • Trace Route Summary — This table shows a brief summary of the trace including the following: Port WWN Port Name FC Address Switch Name (Fabric OS only) Whether ping was successful (Fabric OS only) (Fabric OS only) Round trip time (minimum, maximum, and average) (Fabric OS only) Whether the device ports are in active zones.
28 FC troubleshooting c. Click Search and Add. • Select the source and destination ports from a list by selecting the Select two device ports option and completing the following steps. a. Right-click a fabric in the Available Device Ports table and select Expand All. b. Select the ports (source and destination) for which you want to confirm device sharing from the Available Device Ports table.
FC troubleshooting 28 Confirming Fabric Device Sharing NOTE Fabric device sharing is only available with Trial or Licensed version. NOTE Fabric device sharing is only available on pure Fabric OS fabrics. To confirm that two or more fabrics have been configured to share devices, complete the following steps. 1. Select Configure > FC Troubleshooting > Fabric Device Sharing. The Fabric Device Sharing Diagnosis dialog box displays. 2.
28 FC troubleshooting ATTENTION If you run more than one test per slot, the result may go wrong or the test may fail. TABLE 77 D-Port test support matrix D-Ports Tests Fabric OS 7.0 Fabric OS 7.1 HBA driver 3.
FC troubleshooting 28 • Link traffic • Latency measurement • Measure link distance TABLE 78 Supported link distance measurements SFP speed Accuracy Precision 10 Gbps 124 meters + or - 50meters 16 Gbps 5 meters + or - 5 meters If any of the tests fail, the Management application does not rollback to already executed operations. When the test successfully completes, the Management application performs the following operations to change the port type back to E-port: 1. Disable the source port. 2.
28 FC troubleshooting TABLE 79 Status Detail messages Operation/Test Possible message Failed to enable the port slot_number/port_number of the switch switch_IP_address. Reason: CAL_error_message Disable the diagnostic mode on source or destination D ports Disabled diagnostic mode on port slot_number/port_number of the switch switch_IP_address. Failed to disable diagnostic mode on port slot_number/port_number of the switch switch_IP_address.
FC troubleshooting TABLE 79 28 Status Detail messages Operation/Test Possible message If any test fails, that test displays as failed and a Failure report displays. Sample failure report : Errors detected (local): CRC, Bad_EOF, Enc_out Errors detected (remote): CRC, Bad_EO Run portstatsshow and porterrshow for more detail on the errors. 7.
28 FCIP troubleshooting 7. Click OK on the Link Traffic Test Configuration dialog box. The Diagnostic Port Test dialog box displays. Return to step 5 of “Troubleshooting port diagnostics” on page 885. FCIP troubleshooting NOTE FCIP troubleshooting is only available for Fabric OS devices. You can perform the following operations using FCIP troubleshooting: • Ping. Use to confirm that the configured FCIP tunnels are working correctly. • Trace Route.
FCIP troubleshooting TABLE 80 28 FCIP IP Ping Response Details Field or Component Description Status Always displays ‘Completed’. If there is a failure, an error message displays instead of the IP Ping Result dialog box. Packets Sent Always displays ‘4. This is not configurable. Packets Received The number of received responses. Packets Lost Equal to the number of packets sent minus the number of packets received.
28 FCIP troubleshooting Tracing IP routes The Management application enables you to select an source and a target and displays the detailed routing information from the source port or area on the local switch to the destination port or area on another switch. Trace route cannot be performed on the offline devices or virtual devices. NOTE Trace route is only supported on Fabric OS devices running Fabric OS 5.2 or later. To trace routes, complete the following steps. 1.
FCIP troubleshooting 7. 28 Click Close on the IP Traceroute Result dialog box. 8. Click Cancel on the IP Traceroute dialog box. Viewing FCIP tunnel performance NOTE IP Performance is only supported on the 4 Gbps Router, Extension Switch and Encryption Blade running Fabric OS 5.2 or later. NOTE If you run IP Performance over a link also being used for production traffic, it will impact the production traffic performance. To view FCIP tunnel performance, complete the following steps. 1.
28 FCIP troubleshooting 7. Field/Component Description DELAY The average round trip time to send a packet of data and receive the acknowledgement. PMTU (Path Maximum Transmission Unit) The largest packet size that can be transmitted over the end path without fragmentation. This value is measured in bytes and includes the IP header and payload. IP Performance tries the configured Fabric OS Jumbo MTU value (anything over 15000, then 1500, then 1260.
Chapter 29 Performance Data In this chapter • SAN performance overview. . . . . . . . . . . . . . . . . . . . . . . . . . . . . . . . . . . . . . • SAN real-time performance data . . . . . . . . . . . . . . . . . . . . . . . . . . . . . . . . . • SAN Historical performance data . . . . . . . . . . . . . . . . . . . . . . . . . . . . . . . . . • SAN End-to-end monitoring. . . . . . . . . . . . . . . . . . . . . . . . . . . . . . . . . . . . . . • SAN Top Talker monitoring . . . . . . . . . . . . . . . . .
29 SAN performance overview SAN performance overview Performance monitoring provides details about the quantity of traffic and errors that a specific port or device generates on the fabric over a specific time. You can also use performance to indicate the devices that create the most traffic and to identify the ports that are most congested.
SAN performance overview 29 SAN Performance measures Performance measures enable you to select one or more measures to define the graph or report. The measures available to you depend on the object type from which you want to gather performance data. NOTE Devices with 10GE ports must be running Fabric OS 6.4.1ltd or later to obtain the correct TE port statistics (TX/RX). NOTE Devices with 10GE ports must have the rmon MIB enabled on the switch.
29 SAN performance overview • • • • • • • • • • • • • • • • • • • • • Compression Ratio — available for FCIP tunnels only. • • • • Dropped Frames — available for Managed HBA ports and Managed CNA ports. Latency — available for FCIP tunnels only. Link Retransmits — available for FCIP tunnels only. Timeout Retransmits — available for FCIP tunnels only. Fast Retransmits — available for FCIP tunnels only. Duplicate Ack Received — available for FCIP tunnels only.
SAN performance overview 29 Example of Management application Server IP included in access control list FCRRouter:admin> snmpconfig --show accesscontrol SNMP access list configuration: Entry 0: Access host subnet area 172.26.1.
29 SAN performance overview Community (rw): [OrigEquipMfr] Trap Recipient's IP address : [172.26.24.26] Trap recipient Severity level : (0..5) [4] Trap recipient Port : (0..65535) [162] Community (rw): [custom] Trap Recipient's IP address : [172.26.1.158] Trap recipient Severity level : (0..5) [4] Trap recipient Port : (0..65535) [162] Community (ro): [custom] Trap Recipient's IP address : [0.0.0.0] Community (ro): [common] Trap Recipient's IP address : [0.0.0.
SAN performance overview 29 Priv Protocol [DES(1)/noPriv(2)/3DES(3)/AES128(4)/AES2(5)/AES256(6)]): (2..2) [2] User (ro): [snmpuser1] Auth Protocol [MD5(1)/SHA(2)/noAuth(3)]: (1..3) [3] Priv Protocol [DES(1)/noPriv(2)/3DES(3)/AES128(4)/AES2(5)/AES256(6)]): (2..2) [2] User (ro): [snmpuser2] Auth Protocol [MD5(1)/SHA(2)/noAuth(3)]: (1..3) [3] Priv Protocol [DES(1)/noPriv(2)/3DES(3)/AES128(4)/AES2(5)/AES256(6)]): (2..2) [2] User (ro): [snmpuser3] Auth Protocol [MD5(1)/SHA(2)/noAuth(3)]: (1..
29 SAN performance overview SNMP SET Security Level: No security - To set the SNMP security level, use the snmpconfig --set secLevel command. Example of checking SNMP security level snmpconfig --set secLevel 0 Select SNMP GET Security Level (0 = No security, 1 = Authentication only, 2 = Authentication and Privacy, 3 = No Access): (0..3) [0] • To collect performance for GigE ports and FCIP statistics, make sure that SNMP v3 credentials match (see above) and that FCIP-MIB capability is enabled.
SAN real-time performance data 29 Example for FCIP tunnels Sprint-65:root> portshow fciptunnel ge0 1 -perf SAN real-time performance data Real-time performance enables you to collect data from managed devices in your SAN. Real-time performance is only supported on the following managed objects: FC (E_ and F_ports), GE_ports, E port trunks, 10GE_ports, Managed HBA Ports, Managed CNA Ports, and FCIP tunnels.
29 SAN real-time performance data FIGURE 393 Realtime Port Selector dialog box NOTE You can set columns in right side of the dialog box for FICON display using Server > Options > SAN DIsplay. The first eight columns will display FC Address, Serial #, Tag, Product Type, Model, Vendor, Port Name, Port Type, and Port WWN. 3.
SAN real-time performance data 29 Filtering real-time performance data To filter real-time performance data from the Real Time Performance Graphs dialog box, complete the following steps. 1. Open the Real Time Performance Graphs dialog box. For step-by-step instructions, refer to “Generating a real-time performance graph” on page 903. The Real Time Performance Graphs dialog box displays. 2. Select how the data is measured, in received frames, transmitted frames, or CRC errors.
29 SAN real-time performance data • • • • Port Type - Type of port being monitored. Graph - Graph of data over time. Destination - The destination device. Destination Port - The port through which the selected device is connected to the destination device. • Destination Tunnel ID - The ID of the destination FCIP tunnel. • Destination Port Type - The port type through which the selected device is connected to the destination device.
SAN Historical performance data 29 SAN Historical performance data Performance should be enabled constantly to receive the necessary historical data required for a meaningful report. The following options and features are available for obtaining historical performance data: • Collect historical performance data from the entire SAN or from a selected fabric. NOTE Virtual Fabric logical ISL ports are not included in performance collection. • Persist data on every polling cycle (5 minutes).
29 SAN Historical performance data Enabling historical performance collection SAN wide To enable historical performance collection, select Monitor > Performance > Historical Data Collection. The Fabric Selector dialog box displays with Enable SAN Wide enabled by default. This enables historical performance data collection for all fabrics in the SAN. NOTE After, enabling historical data collection information for switches, ports, and FCIP tunnels also displays in the IP Historical Graph/Tables dialog box.
SAN Historical performance data 29 5. Select the Include newly discovered fabrics check box to automatically add all newly discovered fabrics to the Selected table. 6. Click OK. Historical performance data collection is enabled for all selected fabrics. NOTE After, enabling historical data collection, information for switches, ports, and FCIP tunnels also displays in the IP Historical Graph/Tables dialog box. If available, click the IP tab, then select Monitor > Performance > Historical Graphs/Tables.
29 SAN Historical performance data FIGURE 395 Historical Performance Graphs dialog box 3. Select a default or custom-saved (port and time) from the Favorites list or filter the historical data by completing the following steps. a. Select the number of results to display from the Display list. b. Select ports, FCIP tunnels, EE monitors, SFP, or Custom from which you want to gather performance data from the From list. NOTE Devices with 10GE ports must be running Fabric OS 6.4.
SAN Historical performance data • • • • 29 Raw samples for last 1 day 30 minutes granularity for last 3 days 2 hour granularity for last 30 days 1 day granularity for last 2 years Option 2—2 years data with the following samples: • Raw samples for last 8 days • 1 day granularity for last 2 years NOTE The graph will not update dynamically if the granularity is 30 Minutes, 2 Hours, or 1 day. To update, click Apply. The graph will update dynamically when 5 Minutes is selected.
29 SAN Historical performance data Configuring the graph display To configure the historical performance graph display, right click in the graph and select the following options: • • • • • Select Zoom In to zoom in on the graph. Select Zoom Out to zoom out on the graph. Select Fit in window to fit the graph in the window. Select Go to Latest to go to the latest data point on the graph. Select the Use Logarithmic Axis check box to present data on a logarithmic or non-logarithmic axis.
SAN Historical performance data 29 FIGURE 396 Custom Port Selector dialog box 3. Right-click a device in the Available table and select Expand All. 4. Select the ports (press Ctrl or Shift and then click to select multiple ports) from which you want to gather performance data from the Available table and click the right arrow button. NOTE Devices with 10GE ports must be running Fabric OS 6.4.1ltd or later to obtain the correct TE port statistics (TX/RX).
29 SAN Historical performance data FIGURE 397 Custom Port Selector dialog box 3. Click OK. Exporting historical performance data To export historical performance data, complete the following steps. 1. Generate a performance graph. To generate a performance graph, refer to “Generating and saving a historical performance graph” on page 909. 2. Right-click anywhere in the graph table and select Export. The Save to a tab delimited file dialog box displays. 3.
SAN End-to-end monitoring 29 SAN End-to-end monitoring NOTE End-to-end monitoring requires a Fabric OS device. NOTE An end-to-end monitor and a Top Talker monitor cannot be configured on the same external F-port ASIC (application-specific integrated circuit). You must delete the Top Talker monitor before you configure the end-to-end monitor. NOTE End-to-end monitoring on an Access Gateway device requires Fabric OS 7.0 or later with an Advanced Performance Monitor license.
29 SAN End-to-end monitoring FIGURE 398 Set End-to-End Monitors dialog box 2. Select the fabric for which you want to configure end-to-end monitoring from the Fabric list. 3. Select an initiator port from the Select an initiator port table. 4. Select a target port from the Select a target port table. 5. Click the right arrow to move the selected initiator and target ports to the Monitored Pairs table.
SAN End-to-end monitoring 29 Displaying end-to-end monitor pairs in a real-time graph To display an end-to-end monitor pair in a graph, complete the following steps. 1. Select Monitor > Performance > End-to-End Monitors. The Set End-to-End Monitor dialog box displays. 2. Select one or more end-to-end monitor pairs you want to view from the Monitored Pairs table. You can select up to 100 monitored pairs. 3. Click Real-Time Graph. The Real Time Performance Graphs dialog box displays.
29 SAN Top Talker monitoring 2. Select the end-to-end monitor pair you want to delete from the Monitored Pairs table. 3. Click Delete Monitor. 4. Click OK. SAN Top Talker monitoring Here are some important notes for using this feature: • • • • Top Talkers requires the Advance Performance Monitoring (APM) license on the device. Top Talkers cannot be enabled on a single-switch fabric. Top Talkers requires Fabric OS version 6.2 or later.
SAN Top Talker monitoring 29 Configuring a fabric mode Top Talker monitor NOTE A fabric mode Top Talker and an end-to-end monitor cannot be configured on the same fabric. You must delete the end-to-end monitor before you configure the fabric mode Top Talker. NOTE A fabric mode Top Talker and an F_Port mode Top Talker cannot be configured on the same fabric. You must delete the F_Port mode Top Talker before you configure the fabric mode Top Talker.
29 SAN Top Talker monitoring 7. Click Apply. The top 20 conversations display in the Current Top Talkers table. The Top Talkers Summary table displays all Top Talkers that occurred since the Top Talkers dialog box was opened (displays a maximum of 360). When the maximum is reached, the oldest Top Talker drops as a new one occurs.
SAN Top Talker monitoring 29 6. Select how often you want the Top Talker to refresh (10, 20, 30, 40, or 50 seconds, or 1 minute) from the Refresh Interval list. 7. Select whether you want to monitor the receive (Rx) flow or the transmit (Tx) flow for the port from the Flow list. 8. Click Apply. The top 20 conversations display in the Current Top Talkers table. The Top Talkers Summary table displays all Top Talkers that occurred since the Top Talkers dialog box was opened (displays a maximum of 360).
29 Bottleneck detection Bottleneck detection A bottleneck is a port in the fabric where frames cannot get through as fast as they should. In other words, a bottleneck is a port where the offered load is greater than the achieved egress throughput. Bottlenecks can cause undesirable degradation in throughput on various links. When a bottleneck occurs at one place, other points in the fabric can experience bottlenecks as the traffic backs up.
Bottleneck detection 29 • Bottleneck detection is supported whether Virtual Fabrics is enabled or disabled. In VF mode, bottleneck detection is supported on all fabrics, including the base fabric. How bottlenecks are reported Bottlenecks are reported through alerts in the Master Log. A bottleneck cleared alert is sent when the bottleneck is cleared. NOTE A bottleneck cleared alert is sent if you disable bottleneck detection on a bottlenecked port, even though the port is still bottlenecked.
29 Bottleneck detection Enabling bottleneck alerts and configuring alert parameters Bottleneck detection is enabled on a switch or fabric basis. It enables both latency and congestion detection. • If you enable bottleneck detection on a fabric, the feature is applied to all eligible switches in the fabric and all eligible ports on the switches. • If you enable bottleneck detection on a switch, the feature is applied to all eligible ports on that switch.
Bottleneck detection 29 FIGURE 401Bottlenecks dialog box 2. Select Enable if it is not already selected. 3. Select the Congestion Alerts check box to enable alerts for congestion bottlenecks. Clear this check box to disable alerts. If you enabled alerts, enter threshold values (1-100%), or use the default value for triggering a congestion alert. 4. Select the Latency Alerts check box to enable alerts for latency bottlenecks.
29 Bottleneck detection 7. Select one or more fabrics, switches, or ports from the Products/Ports list. You can select fabrics or switches or ports, but you cannot select a mix of fabrics, switches, and ports. 8. Click the right arrow to apply the settings in the Bottleneck Detection pane to the selected elements in the Products/Ports list.
Bottleneck detection 29 5. Click the right arrow. The bottleneck parameters are applied to the selected items. 6. Click OK or Apply to save your changes. Displaying bottleneck statistics You can display a graph of bottleneck statistics for up to 32 ports at one time. You can display a graph showing the history of bottleneck conditions, for up to the last 150 minutes. 1. Select Monitor > Performance > Bottleneck Graph.
29 Bottleneck detection Displaying devices that could be affected by an F_ or FL_Port bottleneck The following procedure displays hosts and targets that could be affected because of a bottlenecked F_ or FL_Port. These devices are determined based on zoning information and are not based on actual traffic flow. Affected devices cannot be determined for bottleneck E_Ports. 1. Select Monitor > Performance > Bottlenecks. The Bottlenecks dialog box displays. 2.
Thresholds and event notification 29 Thresholds and event notification Performance allows you to apply thresholds and event notification to real-time performance data. A performance monitor process (thread) monitors the performance data against the threshold setting for each port and issues an appropriate alert to notify you when the threshold is exceeded. For information about configuring event notification, refer to Event Notification.
29 Thresholds and event notification FIGURE 403 Set Threshold Policies dialog box 2. To edit a current policy, select a policy form the available threshold policies. The Edit Threshold Policy dialog box displays. FIGURE 404 Edit Threshold Policy dialog box 3. To add a new policy, perform the following steps: a. click Add. The New Threshold Policy dialog box displays.
Thresholds and event notification 29 FIGURE 405 New Threshold Policy dialog box b. Enter a name for the policy (100 characters maximum) in the Name field. 4. Select a policy type from the Policy Type list. You can only define policies for E and F/FL ports. 5. Select a measure from the Measure list. You can only define policies for the Tx and Rx % Utilization measures. You cannot add the same measure more than once.
29 Thresholds and event notification FIGURE 406 Confirm Threshold Changes dialog box 14. Make the threshold changes by selecting one of the following options: • To only add new thresholds, select the Keep currently set thresholds and only add new thresholds check box. • To overwrite all existing thresholds on all fabrics and devices, select the Overwrite all thresholds currently set on all switches check box. 15. Click OK on the Confirm Threshold Changes dialog box.
Thresholds and event notification 29 2. Select one or more threshold policies you want to assign to a fabric or device in the Available Threshold Policies table. Press Ctrl or Shift and then click to select multiple policies. 3. Select one or more fabrics or devices to which you want to assign the policy in the Available Threshold Policies table. If you choose to assign the policy to a fabric and a M-EOS logical switch is present in the fabric, the policy is not assigned to the M-EOS logical switch.
29 SAN Connection utilization 6. Make the threshold changes by selecting one of the following options: • To only add new thresholds, select the Keep currently set thresholds and only add new thresholds check box. • To overwrite all existing thresholds on all fabrics and devices, select the Overwrite all thresholds currently set on all switches check box. 7. Click OK on the Confirm Threshold Changes dialog box.
SAN Connection utilization Line Color Utilization Defaults Blue line 1% to 40% utilization Gray line 0% to 1% utilization Black line Utilization disabled 29 Enabling connection utilization NOTE Fabrics where performance data collection is not enabled display connections as thin black lines. To display the connection utilization, complete the following steps. 1. Choose from one of the following options: • Select Monitor > Performance > View Utilization • Press CTRL + U.
29 SAN Connection utilization Changing connection utilization You can change the utilization percentages. To change the utilization percentages, complete the following steps. 1. Click the change link in the utilization legend. FIGURE 408 Utilization Legend in edit mode 2. Enter or select the end percentage you want for the blue line.
SAN Connection utilization 29 • Select the Use Logarithmic Axis check box to present data on a logarithmic or non-logarithmic axis. • Select the Show Values check box to annotate data point values in the graph. • Select the Enable Auto Scrolling check box to automatically jump to display the new data when new data is collected while the graph is in view.
29 SAN Connection utilization 3. Click Options to launch the Graph Options dialog box. Refer to “Configuring graph options” on page 938 for instructions on using this dialog box. 4. Select the Graph or Table option to display data in graphical or tabular format. 5. Select a time range relative to the present for the display of historical data from the For list. The options are incremental from the last 30 minutes to the last 24 hours. 6.
SAN Connection utilization 29 FIGURE 409 Graph Options dialog box (Historical Graphs/Tables dialog box) NOTE Figure 409 illustrates the Graph Options dialog box available from the Historical Graphs/Tables dialog box. The Graph Options dialog box available from the Real Time Graphs/Tables dialog box is similar, but has fewer control options. 2. Select the type of chart style from the Chart Style list. Available chart styles include Line Chart, Area Chart, or Bar Chart. 3.
29 SAN Connection utilization • (Historical graphs and monitors only) Plot Min/Max - Plots minimum and maximum values along with the average data. The range between the minimum and maximum values will be represented by the width of a color band surrounding the data points as shown in the following illustration. Note that this option is not available if you select Minimum Interval granularity. It also does not apply and is not available for Real Time Performance graphs.
SAN Connection utilization 29 a. (Historical graphs and monitors only) Select the granularity of the data points to display on the graph from the Granularity list. Options are Minimum interval, 30 minutes, 2 hours, or 1 day. The granularity varies depending on the configuration on the Server Management Console, Performance Data Aging tab. For more information, refer to “Defining the performance data aging interval” on page 309. b.
29 942 SAN Connection utilization Brocade Network Advisor SAN User Manual 53-1002696-01
Chapter 30 Frame Monitor In this chapter • Frame Monitor . . . . . . . . . . . . . . . . . . . . . . . . . . . . . . . . . . . . . . . . . . . . . . . . • Creating a custom frame monitor . . . . . . . . . . . . . . . . . . . . . . . . . . . . . . . . • Editing a frame monitor . . . . . . . . . . . . . . . . . . . . . . . . . . . . . . . . . . . . . . . . • Assigning a frame monitor to a port. . . . . . . . . . . . . . . . . . . . . . . . . . . . . . . • Finding frame monitor assignments . . . . . . . . .
30 Frame Monitor Pre-defined frame types Pre-defined frame types include the following: • • • • • • • • • ABTS (Abort Sequence Basic Link Service command) BA_ACC (Abort Accept) IP SCSI SCSI Read SCSI Write SCSI RW SCSI-2 Reserve SCSI-3 Reserve Custom frame types In addition to the standard frame types, you can create custom frame types to gather statistics that fit your needs. To define a custom frame type, you must specify a series of offsets, bitmasks, and values.
Creating a custom frame monitor 30 Frame Monitoring requirements To configure Frame Monitoring, the following requirements must be met: • The switch must be running Fabric OS 7.0.0 or later. • Frame Monitoring requires the Advanced Performance Monitoring license and the Fabric Watch license. NOTE The Advanced Performance Monitoring license is required to configure frame monitors. The monitoring functionality requires the Fabric Watch license.
30 Creating a custom frame monitor 2. Select the Switch option. The Products / Monitors list displays the switches that support Frame Monitoring. 3. Enter the monitor data in the Configure Monitor area. 4. Select one or more switches in the Products / Monitors list, and click the right arrow button to assign the frame monitor to those switches. 5. Select the Port option. 6. Expand the switch in the Products / Ports list. The Monitors list displays all of the frame monitors defined for that switch. 7.
Editing a frame monitor 30 11. Click Start. The frame monitor configuration is applied to the switches. 12. Click Close after configuration is complete (indicated by “Completed” in the Progress column). Editing a frame monitor 1. Select Monitor > Fabric Watch > Frame Monitor. The Frame Monitor dialog box displays. 2. Select the Switch option. 3. Expand the Products / Monitors list to display the frame monitors for each switch. 4. Select a frame monitor and click the left arrow button.
30 Finding frame monitor assignments 6. Click the right arrow button to move the frame monitor to the selected ports. The Monitor Details list displays the monitors that are assigned to a selected port. If no monitors are assigned, or if more than one port is selected, the Monitor Details list does not display. 7. Click OK. The Frame Monitor Configuration Status dialog box displays. 8. Click Start. The frame monitor configuration is applied to the ports. 9.
Removing a frame monitor from a switch 30 8. Click Start. The frame monitor configuration is applied to the ports. 9. Click Close after configuration is complete (indicated by “Completed” in the Progress column). Removing a frame monitor from a switch When you remove a frame monitor from a switch, the frame monitor is automatically removed from all assigned ports in the switch. You can remove only custom frame types; you cannot remove the pre-defined frame types. 1.
30 950 Removing a frame monitor from a switch Brocade Network Advisor SAN User Manual 53-1002696-01
Chapter 31 Policy Monitor In this chapter • Policy monitor overview. . . . . . . . . . . . . . . . . . . . . . . . . . . . . . . . . . . . . . . . . • Preconfigured policy monitors . . . . . . . . . . . . . . . . . . . . . . . . . . . . . . . . . . . • Viewing policy monitor status . . . . . . . . . . . . . . . . . . . . . . . . . . . . . . . . . . . . • Viewing existing policy monitors . . . . . . . . . . . . . . . . . . . . . . . . . . . . . . . . . . • Adding a policy monitor . . . . . . . . . . . . .
31 Policy monitor overview Fabric policy monitors Fabric policy monitors enable you to set the following policy monitors on SAN (refer to “Adding a policy monitor” on page 959): • Check zoning status — This fabric policy monitor enables you to determine if zoning is enabled or disabled on the fabric. Zoning plays a key role in the management of device communication. When you enforce zoning, devices not in the same zone cannot communicate.
Policy monitor overview 31 Some devices can function as both initiator and target. If the application finds this type of device as one of the active zone members, this device port is treated as both initiator and target: - Target (storage port) — The application counts the number of initiator ports zoned to this storage port. - Initiator — The application counts this device as an initiator port for other storage ports in the same zone.
31 Policy monitor overview • Check if the product is configured to send events to this server — This switch and router policy monitor enables you to determine if the Management application server is registered as an SNMP recipient and Syslog recipient. If the server has multiple NICs, the server uses an IP address reachable from the switch for event registration. This policy cannot determine if the server is using a reachable IP address for the event registration.
Policy monitor overview 31 • Check for SNMPv3 (secure SNMP) configuration — This switch and router policy monitor enables you to check each target to see if SNMPv3 is active for device data transmission and SNMPv1 and SNMPv2 are not configured. NOTE For this check to pass, you must discover the products using SNMPv3 credentials. Rule Violation Fix — If the policy monitor report shows a violation, configure SNMPv3 on the device. Remove SNMPv1 and SNMPv2 settings on the device, if configured.
31 Policy monitor overview • Check for connections through two fabrics to each target LUN — This host policy monitor enables you to determine if there are redundant connections between the host group and the target LUN. To prevent a single point of failure, the host should have a redundant connection to the target LUN. Available hosts include both automatic hosts and manual hosts. An automatic host is a host discovered through Host adapter discovery or VM Manager discovery.
Preconfigured policy monitors 31 Preconfigured policy monitors The Management application provides preconfigured policy monitors. The preconfigured policy monitors include the following: Default SAN Policy — Available for SAN products and contains the following values: • • • • Name — Default SAN Policy Description — Default policy to run on all SAN targets Frequency — Weekly Next Run — Next time the policy will run using the format: .
31 Viewing existing policy monitors Viewing existing policy monitors To view existing policy monitors, complete the following steps. 1. Select Monitor > Policy Monitor (Figure 412). The Policy Monitor dialog box displays. FIGURE 412 Policy Monitor dialog box 2. Review the policy monitor details: • Name — The user-defined name of the policy. • Description — A description of the policy.
Adding a policy monitor 7. 31 To open the last executed report for a selected policy monitor, select a policy monitor and click Report (refer to “Viewing a policy monitor report” on page 969). 8. To view the report history for all policy monitors, click History (refer to “Viewing historical reports for a policy monitor” on page 972). 9.
31 Adding a policy monitor 3. Enter a user-defined name for the policy in the Name field. The name must be unique. It cannot be over 64 characters, nor can the field be empty. It cannot include asterisks. 4. Enter a description of the policy in the Description field. The description cannot be over 128 characters. It cannot include asterisks. 5.
Adding a policy monitor e. 31 Select the fabrics to which you want to apply this policy in the Available Fabrics list and click the right arrow button. NOTE You can use the All Fabrics target in the Available Fabrics table for future provisioning. Select All Fabrics and click the right arrow button to apply this policy to all discovered fabrics. The selected fabrics display in the Selected Fabrics list. 7.
31 Adding a policy monitor FIGURE 414 Add Policy Monitor dialog box, Switch/Router Checks tab a. Select one or more of the following checks in the Available Checks list to include them in the policy monitor: For more information about these checks and fixes for rule violations, refer to “Switch and router policy monitors” on page 953.
Adding a policy monitor c. 31 If you selected the Check for redundant connections to neighboring switches (SAN only) check, enter the minimum number of connections allowed between a switch pair in the Minimum Connections field. The default recommended is 2. Valid values are from 2 through 512. d. Select the switches or routers to which you want to apply this policy in the Available Switches/Routers list and click the right arrow button.
31 Policy monitor scheduling c. Select the Check for connections through two fabrics to each target LUN check box to determine if there are redundant connections between the host group and the target LUN. For more information about this check and a fix for rule violations, refer to “Host policy monitors” on page 955. d. Select the hosts to which you want to apply this policy in the Available Hosts list and click the right arrow button.
Policy monitor scheduling 31 Configuring a one-time policy monitor schedule To configure a one-time schedule, complete the following steps. 1. Select One Time from the Frequency list. 2. Select the time of day you want deployment to run from the Time (hh:mm) lists. Where the hour value is from 1 through 12, the minute value is from 00 through 59, and the day or night value is AM or PM. 3. Click the Date list to select a date from the calendar. 4. Click OK on the Schedule Properties dialog box.
31 Editing a policy monitor Configuring a weekly policy monitor schedule To configure a weekly schedule, complete the following steps. 1. Select Weekly from the Frequency list. 2. Select the time of day you want deployment to run from the Time (hh:mm) lists. Where the hour value is from 1 through 12, the minute value is from 00 through 59, and the day or night value is AM or PM. 3. Select the day you want deployment to run from the Day of the Week list. 4. Click OK on the Schedule Properties dialog box.
Deleting a policy monitor 31 6. Click OK on the Edit Monitor dialog box. The updated policy monitor displays in the Monitors list of the Policy Monitor dialog box. 7. Click Close on the Policy Monitor dialog box. Deleting a policy monitor To delete an existing policy monitor, complete the following steps. 1. Select Monitor > Policy Monitor. The Policy Monitor dialog box displays. 2. Select the policy you want to delete in the Monitors list. 3. Click Delete. 4. Click Yes on the confirmation message. 5.
31 Running a policy monitor When the policy monitor check is complete, the Policy_Name - Policy Monitor Report displays (Figure 417) in a web browser. FIGURE 417 Policy_Name - Policy Monitor Report 4. Review the report details (refer to “Viewing a policy monitor report” on page 969). To export a report, refer to “Exporting a policy monitor report” on page 971. To e-mail a report, refer to “Exporting reports to e-mail recipients” on page 1059. 5.
Viewing a policy monitor report 31 Viewing a policy monitor report NOTE You must run the policy monitor at least once before you can view a report. To view an existing policy monitor report, complete the following steps. 1. Select Monitor > Policy Monitor. The Policy Monitor dialog box displays. 2. Select the policy for which you want to view a report in the Monitors list. 3. Click Report. NOTE If you have run this policy more than once, the latest report displays.
31 Viewing a policy monitor report Fabric Checks — Fabric checks provide the following information for each selected check: Name — Fabric name. Status — Result of the check and reason for failure if known. Valid results include Passed, Partially Failed, Failed, Not Applicable, and Unknown.
Viewing a policy monitor report Switch - Check for SNMPv3 (secure SNMP) configuration. This check provides the following additional detail for this check: 31 SNMPv3 Status — Whether SNMPv3 is enabled or disabled on the product. SNMP Status — Whether SNMP is enabled or disabled on the product. Configuration Rule Checks — Switch checks provide the following information for each selected check: - Block/Condition Name — Name of the block or condition.
31 Viewing historical reports for all policy monitors Viewing historical reports for all policy monitors 1. Select Monitor > Policy Monitor. The Policy Monitor dialog box displays. 2. Select the policy for which you want to view the report history and click History. The Report History dialog box displays with a list of reports. The Report History dialog box retains up to 10 reports for each policy monitor. • Name — Name of the policy monitor. • Date — Date and time the report was finished.
Chapter Fault Management 32 In this chapter • Fault management overview. . . . . . . . . . . . . . . . . . . . . . . . . . . . . . . . . . . . . 973 • Event notification. . . . . . . . . . . . . . . . . . . . . . . . . . . . . . . . . . . . . . . . . . . . . . 974 • Defining filters . . . . . . . . . . . . . . . . . . . . . . . . . . . . . . . . . . . . . . . . . . . . . . . . 975 • SNMP traps . . . . . . . . . . . . . . . . . . . . . . . . . . . . . . . . . . . . . . . . . . . . . . . . . .
32 Event notification Event notification The Management application records the SAN and IP events in the Master Log. You can configure the application to send event notifications to e-mail addresses at certain time intervals. This is a convenient way to keep track of events that occur on the SAN and IP networks. You can also configure products to “call home” for certain events, notifying the service center of product problems.
Defining filters 32 6. Enter the authentication ID of the SMTP mail server in the SMTP ID field. NOTE The SMTP ID field is optional unless the SMTP server enables authentication. 7. Enter the authentication password of the SMTP mail server in the SMTP Password field. NOTE The SMTP Password field is optional unless the SMTP server enables authentication. 8. Enter the sender’s e-mail address in the Reply Address field. 9.
32 Defining filters FIGURE 419 Define Filter dialog box 4. Select which product type you are defining (SAN, IP, or Hosts) and click the appropriate tab. 5. Select the Events Description check box and enter a description of the event in the field. 6. Select the Allow Products check box to control whether or not all products are always displayed. • When selected (the default), all products, even newly-added products, are added to the Selected Products to be displayed list.
Defining filters 32 Setting up advanced event filtering To set up advanced event filtering on the selected events for a user, complete the following steps. 1. Select Server > Users. The Users dialog box displays. 2. Select a user in the Users list and click Edit. The Edit User dialog box displays. 3. Select the E-mail Notification Enable check box and click the Filter link. The Define Filter dialog box displays. 4. Click Advanced.
32 SNMP traps e. 7. To add additional filters, repeat step a through step d. To exclude events from the event filter, complete the following steps. NOTE You can configure a maximum of ten filters to be included. a. Select the event type you want to remove from the Event Category list. All event types are listed in alphabetical order. b. Select the event column for the event from the Event Column list. All event columns are listed in alphabetical order. c.
SNMP traps • • • • • • • 32 “Adding an SNMP v3 credential” “Adding an SNMP v1 or v2c community string” “Importing a new MIB into the Management application” “Trap customization” “Unregistering a registered trap” “Customizing a registered trap definition” “Reverting the customization of a registered trap to default” Adding a trap recipient to one or more switches The SNMP Trap Recipients dialog box allows you to register any recipient as a trap recipient on selected products.
32 SNMP traps 5. Select the fabric or switches from the Available list and click the right arrow button to move it to the Selected list. You can select multiple products. NOTE For IP products and product groups, only switches are available to select. 6. If the selected product is a SAN or Network OS device, select a severity from the Severity list. Severity levels can be one of the following: None, Critical, Error, Warning, Info, or Debug. The Severity list is disabled for IP products.
SNMP traps 32 The SNMP Trap Forwarding dialog box, shown in Figure 422, displays. FIGURE 422 SNMP Trap Forwarding dialog box Adding a trap destination The Add Trap Destination dialog box allows you to configure destinations for forwarding SNMP traps. 1. Select Monitor > SNMP Setup > Trap Forwarding. The SNMP Trap Forwarding dialog box, shown in Figure 422, displays. 2. Click the Enable trap forwarding check box. 3. Click Add in the Destinations area of the SNMP Trap Forwarding dialog box.
32 SNMP traps FIGURE 423 Add Trap Destination dialog box 4. Enter a general description of the trap destination in the Description field. 5. Enter the IP address of the trap destination in the IP Address field. This is a mandatory field. IPv4 and IPv6 addresses are accepted, but a DNS name is not accepted. 6. Enter the SNMP trap listening port of the recipient in the Port # field. This is a mandatory field. Valid numeric values range from 1 through 65535.
SNMP traps 32 FIGURE 424 Add Trap Filter dialog box 3. Select the SAN, IP, or Hosts tab. Depending on the tab selected, the products available to which you can add a trap filter display in the Available Products list. 4. Enter a unique name for the trap filter in the Filter Name field. 5. Enter a general description of the trap filter in the Description field. 6. Click the Forward Application Messages check box to forward application events. 7.
32 SNMP traps 9. By default, all traps are listed in the Available Traps list, under the folders for the MIB to which they belong. You can limit the list by selecting one of the following MIB types: • MIB Information - Select the check box if you want the default SNMP name for the traps to be displayed. • MIB Alias - Select the check box if you want the aliases for traps to be displayed. 10.
SNMP traps 32 By default, the Management application receives SNMP v1 and v2c traps from Brocade IP products that have any SNMP community strings. You can accept or restrict SNMP v1 and v2c traps by selecting one of the following check boxes in the Event Reception dialog box: • Do not accept SNMP v1/v2c traps Use this option to turn off receiving SNMP v1 and v2c traps. If selected, the Management application will not receive any SNMP v1 and v2c traps.
32 SNMP traps Adding an SNMP v3 credential The SNMP v3 Credentials dialog box allows you to add the SNMP v3 credentials. To add an SNMP v3 credential, complete the following steps. 1. Select Monitor > SNMP Setup > Event Reception. The Event Reception dialog box displays. 2. Select an SNMP v3 credential from the SNMP v3 Credentials list on the Event Reception dialog box. 3. Click Add. The Add SNMP v3 Credentials dialog box, shown in Figure 426, displays. FIGURE 426 Add SNMP v3 Credentials dialog box 4.
SNMP traps 32 Adding an SNMP v1 or v2c community string The SNMP v1/2 Community String dialog box allows you to add the SNMP v1 or v2c credentials. To add an SNMP v1 or v2c community string credential, complete the following steps. 1. Select Monitor > SNMP Setup > Event Reception. The Event Reception dialog box displays. 2. Click the Accept SNMPv1/v2c traps with only these community strings button. 3. Click Add. The SNMP v1/v2c Community String dialog box, shown in Figure 427, displays.
32 SNMP traps The following is an example of how to add the two Cisco MIB files. # # Cisco Mibs # CISCO-SMI.mib CISCO-CONFIG-COPY-MIB.mib # # End Cisco Mibs # 4. Save the file. The Management application recompiles all the MIB files. If compilation is successful, the traps can now be registered in the Event Reception dialog box. NOTE If there are compilation errors, you can view the errors in the server log: \logs\server\server.log (Windows) or /logs/server/server.log (UNIX).
SNMP traps 32 FIGURE 428 Trap Configuration tab of the Event Reception dialog box 3. Expand a folder for a MIB to display the traps in the MIB. If the list is too long, use the Search tool to find a MIB or trap. 4. Select the trap you want to register. The SNMP name and Object Identification (OID) of the trap appear at the top line of the configuration pane. Also, the status of the trap shows Not Registered, which is the default definition of the trap.
32 SNMP traps d. Configure the recommended action for the trap. 6. When you have finished, click OK to accept your entries. The status of the trap changes to Registered - Customized and the trap appears in the Event Log. Unregistering a registered trap You can unregister only the traps that you have registered. You cannot unregister traps that come with the Management application by default. Perform the following steps if you want to unregister a trap that you registered. 1.
SNMP informs 32 4. Select a trap to display its current definition. 5. If the trap has been customized, a button labeled Default is available. Click Default to revert the previous changes to its default. SNMP informs The SNMP Informs dialog box allows you to enable or disable informs on informs-capable products. SNMP traps are unreliable because the receiver does not send any acknowledgment when it receives a trap. The sender cannot determine if the trap was received.
32 Syslogs Adding a syslog recipient The Syslog Recipients dialog box allows you to register any recipient as a syslog recipient on selected products. You can register different recipients for different products. You can register and unregister other recipient servers on the Fabric OS switches on a per-fabric basis. For IP products, you can perform registration only at the switch level. NOTE IPv6 Syslog registration is not supported for IronView OS products. 1.
Syslogs 32 Removing a syslog recipient 1. Select Monitor > Syslog Configuration > Syslog Forwarding. The Syslog Recipients dialog box displays. 2. Select Remove from the Action list. 3. Enter the IP address of the syslog port (the recipient server) in the Recipient IP Address field. 4. Select the fabric or switches from the Available list. 5. Click OK. The Management application removes the recipient from the managed switches.
32 Syslogs Adding a syslog destination The Add Syslog Destination dialog box allows you to configure destinations for forwarding syslog events. 1. Select Monitor > Syslog Configuration > Syslog Forwarding. The Syslog Forwarding dialog box displays. 2. Select the Enable syslog forwarding check box. 3. Click Add. The Add Syslog Destination dialog box, shown in Figure 431, displays. Enable and Syslog Repeater are enabled by default. FIGURE 431 Add Syslog Destination dialog box 4.
Syslogs 32 Adding a syslog filter You can add a syslog filter on SAN products, IP products, or hosts. 1. Select Monitor > Syslog Configuration > Syslog Forwarding. The Syslog Forwarding dialog box displays. 2. Select the Enable syslog forwarding check box. 3. Select Add in the Filters area. The Add Syslog Filter dialog box, shown in Figure 432, displays. FIGURE 432 Add Syslog Filter dialog box 4. Select the SAN, IP, or Hosts tab.
32 Event action definitions 9. Select the product from the Available Products list and click the right arrow button to move it to the Selected Products list. 10. Click OK. Snort message forwarding Snort is a third-party tool that monitors network traffic in real time. When Snort detects dangerous payloads or other abnormal behavior, it sends an alert to the syslog in real time.
Event action definitions 32 FIGURE 433 Event Actions dialog box 2. Click Add to display the Identification pane of the dialog box. 3. Enter a name and description for the event action and select the Enabled check box. 4. Click Next to advance to the Events pane. Events pane of the Add Event Action Sources dialog box 1. Select Monitor > Event Processing > Event Actions. The Event Actions dialog box displays. 2. Click Next to advance to the Events pane.
32 Event action definitions FIGURE 434 Add Event Action dialog box - Events pane 3. Select one of the following event types from the Show list: • • • • • Traps (default) Application Events Pseudo Events Custom Events Snort® Message Depending on what event type you select, a box listing the available events or pseudo events displays. 4. By default, all traps are listed in the Available Traps list, under the folders for the MIB to which they belong.
Event action definitions 32 9. If you selected Custom Events in step 3, click Next to accept the defaults; otherwise, select the Event Category, Severity, Message ID, and Description Contains, as required. 10. If you selected Snort® Message in step 3, select the Snort® messages in the left table and use the arrow button to move them to the right. To import Snort® rules, click the Import Snort® Rules button. 11.
32 Event action definitions • • • • • • > – Greater than >= – Greater than or equal to <= – Less than or equal to In – Matches collection Not_in – Does not match collection ~ – Arbitrary Unicode regular expression 5. Enter the value of the varbind. The value you enter must conform to the data type required by the varbind. For example, if the varbind expects an integer and you enter a text string, your entry will be rejected.
Event action definitions 32 3. Click the Provide the IP Address / Node WWN / Name of the source button if you want to manually enter the IP address, the world wide name (WWN), or the name of the source in the IP Address field. 4. Click the Select from the available list of sources button as an alternative to manually entering the IP address, WWN, or name of the source. You can select source address products or ports to use as event senders from the available list of sources. 5.
32 Event action definitions Configuring event action policies The Policy pane of the Add Event Action dialog box, shown in Figure 437, allows you to define the frequency of the event, enter a message for an event that will be displayed in the event log, and specify the event severity. FIGURE 437 Policy pane of the Add Event Action dialog box 1. Click Take actions for the selected events when they occur (default) if you want the action to be triggered each time the selected events occur. 2.
Event action definitions 32 4. Indicate how often the policy is to be reset. You can choose one of the following options: • Reset immediately - Repeats the policy as soon as the specified action has been applied. • Wait until ____ seconds or minutes - If this parameter is selected, the policy will not be applied to the product for the specified duration of time. Enter the duration in minutes or hours.
32 Event action definitions 1. Select Apply as a Logging Policy to indicate whether or not you want the event occurrence to be logged in the Management application database: - Select Log to log the occurrence in the Management application database and Master Log. - Select Drop to not log the occurrence in the Management application database or Master Log.
Event action definitions 32 Special events handling The following special error conditions are examples of events that are categorized as Special Events Handling events, a separate category that appears in the Name list of the Event Actions dialog box. All pre-selected events are SNMP traps.
32 Event action definitions 3. To view all acknowledged special events, click the Show Acknowledged check box in the upper right corner of the dialog box. This check box is disabled by default. The acknowledged special events display, sorted by the last event server time.
Event action definitions 32 4. If you want a prologue to be inserted at the beginning of the e-mail message, enter up to 255 characters in the Body Prologue field. The event action message follows the prologue. 5. If you want an epilogue to be placed at the end of the e-mail message, enter up to 255 characters in the Body Epilogue field. NOTE The prologue, the event action message, and the epilogue form the body of the e-mail alert. 6. Click Finish.
32 Event action definitions 3. Click Edit to display the Edit Event Action dialog box. 4. Make the changes you want to make to the definition. You can perform this action in any of the panes of the Add Event Action dialog box. 5. Click Finish to save your definition. Deleting an event action definition Perform the following steps to delete an event action definition. 1. Select Monitor > Event Processing > Event Actions. The Event Actions dialog box displays. 2.
Event action definitions 32 2. Click the Import Snort® Rule button. The Import Snort® Rule File dialog box displays, as shown in Figure 442. FIGURE 442 Import Snort® Rule File dialog box 3. Enter the complete path of the Snort rule file located on the Syslog server. 4. Click OK to import the Snort rules. 5. While still in the Add Event Action dialog box, continue to click Next until you advance to the Action Group - Actions pane. 6.
32 Pseudo events Pseudo events A pseudo event is a combination of different SNMP traps that you decide would constitute a single event. For example, there are two separate SNMP traps for link up and link down occurrences. You might decide that these two occurrences should be just one event. Displaying pseudo event definitions Perform the following steps to display the properties of a pseudo event. 1. Select Monitor > Event Processing > Pseudo Events.
Pseudo events 32 Setting pseudo event policies The Policy pane of the Add Pseudo Event dialog box allows you to create escalation, resolve, and flapping policies for the pseudo event, and then specify the time duration for each of these policies in minutes or seconds. The Policy pane of the Add Pseudo Event dialog box is displayed in Figure 444. FIGURE 444 Policy pane of the Add Pseudo Event dialog box 1.
32 Pseudo events 3. Click the Flapping button to create a flapping policy, and then enter the number of occurrences and the duration of time before the Management application performs the action specified in an event action. Specify the number of flapping times in minutes or seconds. The flapping policy checks to see if the event consistently transitions between two opposite states during a specified length of time. If it does, then the specified action in the definition is performed.
Pseudo events 32 FIGURE 445 Events pane of the Add Pseudo Event dialog box 3. From the Available Traps list, select the trap for the down state of a product or interface. By default, all traps known to the Management application are included in the Available Traps list, which is a list of all traps that are available based on the MIB and filter criteria. 4. Select a trap for the Selected Down Trap list and a trap for the Selected Up Trap list. You cannot select the same trap for up and down conditions.
32 Pseudo events Creating a pseudo event definition by copying an existing definition You can create a pseudo event definition by copying an existing definition. Perform the following steps. 1. Select Monitor > Event Processing > Pseudo Events. The Pseudo Events dialog box, shown in Figure 443, displays. 2. Select the pseudo event definition that you want to copy from the Pseudo Events list. Click the Duplicate button to display the Duplicate Pseudo Event dialog box.
Pseudo events 32 Adding a pseudo event on the escalation policy Use the escalation policy to be notified if a critical event occurs on a product, port, or system. When the event occurs, the escalation policy waits for a duration of time to see if the event remains in that state. If it does, then the specified action in the definition is performed.
32 Pseudo events 7. Select the source that you will use to monitor this event from the Selected Sources list. 8. Click Next to advance to the Policy pane of the Add Event Action dialog box. The Policy pane of the Add Event Action dialog box displays. 9. Click the Take actions for the selected events when they occur button if you want to take action for the selected events when they occur. 10. Click Next to advance to the Action Group-Actions pane of the Add Event Action dialog box.
Pseudo events 32 Adding a pseudo event on the resolving policy When a down event occurs, a resolving policy waits for a specified duration to see if the event remains in that state by checking if an up event occurs. If an up event occurs, a resolving pseudo event is generated by the Event Processor. The following two-part procedure uses both the Add Pseudo Events dialog box and the Add Event Actions dialog box to create an event action with the resolving policy. 1.
32 Pseudo events 8. Click Next to advance to the Policy pane of the Add Event Action dialog box. The Policy pane of the Add Event Action dialog box displays. 9. Define the frequency of the event’s occurrence that would trigger the action. • Click the Take actions for the selected event when they occur button if you want to take action for the selected events when they occur.
Pseudo events 32 9. Click Next to advance to the Summary pane. 10. Click Finish to complete the pseudo event configuration. Now, you must create a new event action definition using the Add Event Actions dialog box. Creating an event action with a pseudo event on the flapping policy 1. Select Monitor > Event Processing > Event Actions. The Event Actions dialog box displays. 2. Click Add to display the Identification pane of the Add Event Action dialog box. 3.
32 Pseudo events 12. You can either select an existing CLI configuration or create a new one and select that configuration. After selecting a CLI configuration, the name of the CLI configuration is displayed in the Selected Configuration field. - Has Parameters - Displays Yes if the CLI configuration has parameters that require values to be entered before it can be deployed, and displays No if no parameter needs to be defined.
Event custom reports 32 Event custom reports The Event Custom Reports dialog box allows you to manage customized event filter definitions and schedule when the definitions are run. To access the dialog box, select Reports > Event Custom Reports. The Event Custom Reports dialog box, shown in Figure 446, displays.
32 Event custom reports FIGURE 447 Add/Edit Report Definition dialog box - Result Settings tab NOTE The Available Column list lists the attributes you can include in the report. Each attribute represents a column on the report. 5. Select the attribute you want, then click the right arrow to move your selection to the Selected Columns list. To remove an attribute from the Selected Columns list, select the attribute that you want to remove, then click the left arrow button.
Event custom reports 32 2. Click the Add button. 3. The Add/Edit Report Definition dialog box - Product tab displays. 4. Click the Identification tab. The Add/Edit Report Definition dialog box - Identification tab, shown in Figure 448, displays. FIGURE 448 Add/Edit Report Definition dialog box - Identification tab 5. In the Name field, enter a name for the definition. This name appears under the Name column on the Report Definitions tab of the Event Custom Reports dialog box.
32 Event custom reports 10. Select the roles that will have view and run access to this definition, then press the right arrow button to move the role in the Selected Roles list. All Management application users who have the selected roles will be able to view, copy, and run the definition. NOTE You can share the available users definition with specific Management application users.
Event custom reports 32 FIGURE 449 Add/Edit Report Definition dialog box - Product tab 4. Click the Filter tab. The Add/Edit Report Definition dialog box - Filter tab, shown in Figure 450, displays.
32 Event custom reports 5. To limit the search results to traps, syslog, and pseudo event messages with a specific text string, enter the text string in the Description field. You can use an asterisk (*) to indicate a wildcard, as in the following examples: • *cdef: Matches a message ending with cdef • abc*: Matches a message beginning with abc • *abc*: Matches a message that contains abc For example, if you want to find the events that have the text “Auth” in the message, enter "*Auth*".
Event custom reports 32 4. Click the Time Settings tab. The Add/Edit Report Definition dialog box - Time Settings tab, as shown in Figure 451, displays. FIGURE 451 Add/Edit Report Definition dialog box - Time Settings tab 5. Choose between relative time (the default) and absolute time. • Click Relative Time if you want to filter traffic based on when the report is generated, and then select a relative time from the Range list.
32 Event custom reports 5. Perform one of the following tasks when you are finished modifying the definition: • Click OK to save the report. • Click Cancel to discard your changes and exit from the Report Definitions tab of the Event Custom Reports dialog box. • Click Reset to discard your changes without exiting from the Report Definitions tab of the Event Custom Reports dialog box. • Click Run to launch the report.
Event custom report schedules 32 Event custom report schedules Click the Schedules tab, shown in Figure 452, to display its contents. The Schedules list shows the definitions that have been scheduled to automatically run at a specified date and time. FIGURE 452 Schedules tab of the Event Custom Reports dialog box From the Schedules tab of the Event Custom Reports dialog box, you can perform the following tasks: • View—Displays the report data of the scheduled report definition.
32 Event custom report schedules FIGURE 453 Add Schedule dialog box 4. Enter the name of the new schedule in the Name field. You must enter a unique name for the schedule. The name can be up to 64 characters in length and it is case-sensitive. 5. Select the Suspend schedule check box if you want to disable the schedule. For example, you may want to temporarily prevent a report from being generated until further notice. You can clear the check mark to resume the automatic generation of the report. 6.
Event custom report schedules 32 10. Select the E-mail check box if you want the report to be sent to e-mail recipients. The server limits the displayed or sent report to 1000 records. 11. Change the value of the customReports.MaxRecordsToDisplay parameter in the configuration.properties file to the number of records you want displayed or sent. 12. Indicate the date when the report is generated. Open the calendar and select the date.
32 Event logs Event logs You can view all events that take place through the Master Log at the bottom of the main window. You can also view a specific log by selecting an option from the Logs submenu of the Monitor menu. The logs are described in the following list: • Audit Log—Displays all Application Events raised by the application modules and all Audit Syslog messages from the switches and Brocade HBAs.
Event logs 32 Copying part of a log entry You can copy data from logs to other applications. Use this method to analyze or store the data using another tool. To copy part of a log, complete the following steps. 1. Select Monitor > Logs > . The Logs dialog box displays the type of log you selected. 2. Select the rows you want to copy: • To select contiguous rows, select the first row you want to copy, press Shift, and click the contiguous row or rows you want to copy.
32 Event logs Exporting the entire log You can export the log data to a tab-delimited text file. To export a log, complete the following steps. 1. Select Monitor > Logs > . The Log dialog box displays the type of log you selected. 2. Right-click a row and select Export Table. The Save table to a tab delimited file dialog box displays. 3. Browse to the location where you want to export the data. 4. Enter a name for the file in the File Name field. 5. Click Save.
Event logs 32 5. Enter your e-mail address in the Reply From field. 6. Click OK. Displaying event properties from the Master Log You can view detailed information for an event. To display event details from the Master Log, complete the following steps. 1. Right-click an entry in the Master Log. 2. Select Properties. The Event Properties dialog box, shown in Table 86, displays. 3. Review the information.
32 Event logs TABLE 86 Event Properties (Continued) Event Field Description Operational Status The product’s operational status. Module Name The module associated with the event. Source Address The IP address of the source. Acknowledged Indicates whether the event has been acknowledged. 4. Click Close to close the Event Properties dialog box. Copying part of the Master Log You can copy data from logs to other applications. Use this method to analyze or store the data using another tool.
Event logs 32 Exporting the Master Log You can export the Master Log to a tab-delimited text file. Use this method to analyze or store the data using another tool. To export the Master Log, complete the following steps. 1. Right-click an entry in the Master Log. 2. Select Table > Export Table. The Save table to a tab delimited file dialog box displays. 3. Browse to the location where you want to export the data. 4. Enter a name for the file in the File Name field. 5. Click Save.
32 Event logs • • • • • • • • Alert Critical Errors Warning Notice Info Debug Unknown Clear the severity level check boxes to turn off the filter for the selected events. 5. Click OK.
Chapter Technical Support 33 In this chapter • Server and client support save. . . . . . . . . . . . . . . . . . . . . . . . . . . . . . . . . 1039 • Device technical support . . . . . . . . . . . . . . . . . . . . . . . . . . . . . . . . . . . . . 1043 • Upload failure data capture . . . . . . . . . . . . . . . . . . . . . . . . . . . . . . . . . . . 1049 Server and client support save You can use Technical Support to collect SupportSave data for the Management server and clients.
33 Server and client support save 4. Select the Include Database check box to include the database in the support save and choose one of the following options. • Select the Partial (Excludes historical performance data and events) option to exclude historical performance data and events from the database capture. • Select the Full option to capture the entire database. Clear the Include Database check box to exclude the database in the support save. 5.
Server and client support save 33 4. Enter a file name for the server support save file in the File Name field. The default file name is DCM-SS-Time_Stamp. 5. Select the Include Database check box to include the database in the support save and choose one of the following options. • Select the Partial (Excludes historical performance data and events) option to exclude historical performance data and events from the database capture. • Select the Full option to capture the entire database.
33 Server and client support save Client support save using a command line interface Use the following procedures to capture client support save files through the command line interface (CLI). Capturing client support save using the CLI (Windows) To capture client support save files through the CLI, complete the following steps. 1. Go to the following location: • (Local client) User_Home/Management_Application_Name/localhost • (Remote client) User_Home/Management_Application_Name/Server IP 2.
Device technical support 33 Device technical support You can use Technical Support to collect SupportSave data (such as, RASLOG, TRACE and so on) and switch events from Fabric OS devices. To gather technical support information for the Management application server, refer to “Capturing technical support information” on page 307. Scheduling technical support information collection You can capture technical support and event information for up to 50 devices.
33 Device technical support • • • • • • • • • • • • • Serial #—The serial number of the device. a. Right-click in the Available SAN Products table and select Expand All. b. Select the switches you want to collect data for in the Available SAN Products table and click the right arrow to move them to the Selected Products and Hosts table. WWN—The switch port’s world wide name. IP Address—The switch port’s IP address. Domain ID—The switch port’s top-level addressing hierarchy of the domain.
Device technical support 33 9. Select how often you want to purge the support data from the Purge Support Data list. 10. Click OK on the Technical SupportSave dialog box. 11. Click OK on the confirmation message. Data collection may take 20-30 minutes for each selected switch. This estimate may increase depending on the number of switches selected. Check the Master Log for status information. NOTE Unreachable switches increase the time needed to collect supportSave data.
33 Device technical support 4. Click the Hosts tab, if necessary, and complete the following steps. a. Right-click in the Available Hosts table and select Expand All. b. Select the hosts you want to collect data for in the Available Hoststable and click the right arrow to move them to the Selected Products and Hosts table. Technical SupportSave data for SAN devices is saved to the following directory: FTP_Host\ftproot\technicalsupport\ 5. Click OK on the Technical SupportSave dialog box.
Device technical support 33 2. Review the techncial support repository details: Field/Component Description Available SupportSave and Upload Failure Data Capture Files table Select the support data file you want to view. Displays the following information: File Name—The name of the SupportSave file. Size (MB)—The name of the SupportSave file. Last Modified—The date the SupportSave file was generated. Firmware Type—The type of file (Client, Server, FOS (Fabric OS), or First Failure Data Capture (FFDC)).
33 Device technical support E-mailing technical support information NOTE You cannot e-mail technical support information collected from the remote client. To e-mail technical support information, complete the following steps. 1. Select Monitor > Technical Support > View Repository. The Technical Support Repository dialog box displays. 2. Select the file you want to e-mail in the table. 3. Click E-mail to e-mail the event and supportsave files (zip).
Upload failure data capture 33 6. Enter the root directory where you want to copy the data on the external FTP server in the Root Directory field. 7. Click OK. The data is copied and the Technical Support Repository dialog box closes automatically. Deleting technical support files from the repository To delete a technical support file from the repository, complete the following steps. 1. Select Monitor > Technical Support > View Repository. The Technical Support Repository dialog box displays. 2.
33 Upload failure data capture 2. Select a one or more devices on which you want to enable automatic trace dump from the Available Switches with Upload Failure Data Capture Disabled table. The Available Switches with Upload Failure Data Capture Disabled table displays the following information: • • • • • • • • • • • • • • • • • All Levels — All discovered devices and ports as both text and icons. Name — The name of the available switch. Product Type — The type of product.
Upload failure data capture 33 Disabling upload failure data capture NOTE Upload Failure Data Capture is only supported on Fabric OS devices. 1. Select Monitor > Technical Support > Upload Failure Data Capture. The Upload Failure Data Capture dialog box displays. 2. Select one or more devices on which you want to disable automatic trace dump from the Available Switches with Upload Failure Data Capture Enabled table. 3. Click the left arrow button.
33 Upload failure data capture 4. Choose one of the following options: • Select the Use Management_Application option to use the Management application FTP server. • Select the Custom option and complete the following steps to configure a FTP server for the selected device. a. Enter the server’s IP address in the Host IP field. b. Enter a user name for the server in the User Name field. c. Enter a password for the server in the Password field. d.
Chapter 34 Reports In this chapter • SAN report types . . . . . . . . . . . . . . . . . . . . . . . . . . . . . . . . . . . . . . . . . . . . • Generating SAN reports . . . . . . . . . . . . . . . . . . . . . . . . . . . . . . . . . . . . . . • Viewing SAN reports . . . . . . . . . . . . . . . . . . . . . . . . . . . . . . . . . . . . . . . . . • Exporting SAN reports . . . . . . . . . . . . . . . . . . . . . . . . . . . . . . . . . . . . . . . . • Printing SAN reports . . . . . . . . . . . . . . . . . .
34 Generating SAN reports Generating SAN reports To generate reports, complete the following steps. 1. Select Reports > Generate. The Generate Reports dialog box displays. 2. Select the types of reports you want to generate. • Fabric Ports • Fabric Summary 3. Select the fabrics for which you want to generate reports. 4. Click OK. The generated reports display in the View Reports dialog box. NOTE Hyperlinks in reports are active only as long as the source data is available. 5.
Exporting SAN reports Icon 34 Description Actual Size—Click to display the report at its actual size. Fit to Page—Click to resize the report to display entirely in the view. Fit to Width—Click to resize the report to fit in the view by width. Zoom In—Click to zoom in on the report. Zoom Out—Click to zoom out on the report. 4. Click Show in Browser to view the selected report in your default browser window. 5. Click Close to close the View Reports dialog box. 6.
34 Printing SAN reports Printing SAN reports You can print reports through an internet browser. 1. Select Reports > View. The View Reports dialog box displays. 2. Select the report you want to print in the left pane of the dialog box. If you do not see the report you want to view, generate it first by following the instructions in “Generating SAN reports” on page 1054. NOTE Hyperlinks in reports are active only as long as the source data is available. 3. Click Show in Browser.
Generating SAN performance reports 34 Generating SAN performance reports NOTE Performance reports require a SAN Trial or Licensed version. To generate a historical performance report for a device, complete the following steps. 1. Select the device for which you want to generate a performance report. 2. Choose one of the following options: • Select Monitor > Performance > Historical Report. OR • Right-click the device and select Performance > Historical Report.
34 Generating SAN performance reports d. Select the granularity at which you want to gather performance data from the Granularity list. The granularity varies depending on the configuration on the Server Management Console, Performance Data Aging tab.
Generating SAN zoning reports 34 Generating SAN zoning reports The Management application enables you to generate a report for the current zone DB in the fabric. To generate a report for the edited zone DB, you must save it to the fabric first. Make sure no one else is making changes to the same area prior to submitting or your changes may be lost. To generate zoning reports, complete the following steps. 1. Select Configure > Zoning or right -click the device and select Zoning.
34 Exporting reports to e-mail recipients FIGURE 455 Reports via E-Mail dialog box 2. Click the ellipsis button next to the E-mail Recipients text box. The Users dialog box displays. 3. Select the preconfigured e-mail user account from the list and click OK. 4. Enter additional e-mail addresses in the Other Recipients text box. 5. Enter text in the Subject text box to change the subject of the e-mail. 6. Enter text in the Body text box to send a message with the report. 7. Click Send to send the report.
Appendix A Application menus In this appendix • Dashboard main menus . . . . . . . . . . . . . . . . . . . . . . . . . . . . . . . . . . . . . . . 1061 • SAN main menus . . . . . . . . . . . . . . . . . . . . . . . . . . . . . . . . . . . . . . . . . . . . 1062 • SAN shortcut menus . . . . . . . . . . . . . . . . . . . . . . . . . . . . . . . . . . . . . . . . . . 1071 Dashboard main menus The menu bar is located at the top of the main window.
A SAN main menus Menu Command Command Options License — Select to view or change your License information. About Management_Application_Name — Select to view the application information, such as the company information and release number. SAN main menus The menu bar is located at the top of the main window. The following table outlines the many functions available on each menu. Menu Command Command Options Server Menu Users — Select to configure users and user groups.
SAN main menus Menu Command A Command Options View Menu Show Main Tab — Select to choose which tab to display. Dashboard — Select to show the dashboard. SAN — Select to show the SAN tab. IP — Select to show the IP tab. Show Panels — Select to select which panels to display. All Panels — Select to show all panels. Topology Map — Select to only show the topology map. Product List — Select to only show the Product List. Master Log — Select to only show the Master Log.
A SAN main menus Menu Command Command Options Map Display — Select to customize a group's layout to make it easier to view the SAN and manage its devices. Domain ID/Port # — Select to set the display domain IDs and port numbers in decimal or hex format. Decimal — Select to display all domain IDs and port numbers in decimal format. Hex — Select to display all domain IDs in hex format. Product Label — Select to configure which product labels display.
SAN main menus Menu Command A Command Options Host Adapters — Select to discover hosts. VM Managers — Select to discover VM managers. Host Port Mapping — (Trial and Licensed version Only) Select to manually map HBA ports to a host. Storage Port Mapping — (Trial and Licensed version Only) Select to manually map Storage Ports to a Storage Device or other Storage Ports. Configure Menu Element Manager — Select to configure the selected device.
A Menu SAN main menus Command Command Options Schedule Backup — (Trial and Licensed version Only) Select to schedule configuration backup. Replicate — (Trial and Licensed version Only) Select to replicate the switch Configuration or Security. Deployment — Select to manage deployment. DCB — Select to manage a DCB switch, port, or link aggregation group (LAG). Encryption — Select to configure encryption for your SAN.
SAN main menus Menu Command A Command Options Routing — (Trial and Licensed version Only) Select to manage a selected router. Configuration — (Trial and Licensed version Only) Select to view the R_Ports on a router. Domain IDs — (Trial and Licensed version Only) Select to configure the router domain IDs. Security — Select to manage security. L2 ACL — Select to configure Layer 2 Access Control Lists on products and ports. Swap Blades — (Trial and Licensed version Only) Select to swap blades.
A SAN main menus Menu Command Command Options Monitor Menu Performance — Select to monitor SAN devices. Dashboard — Select to launch the Performance Dashboard. View Utilization — (Trial and Licensed version Only) Select to display connection utilization. View Bottlenecks — (Trial and Licensed version Only) Select to display bottlenecks.
SAN main menus Menu Command A Command Options Call Home — (Trial and Licensed version Only) Select to configure the Management Server to automatically dial-in to or send an E-mail to a support center to report system problems. Event Processing — Select to configure event processing. Pseudo Events — Select to configure pseudo events. Event Actions — Select to configure events actions. Fabric Tracking — Select to track fabrics. Track Fabric Changes — Select to track fabric changes on the selected fabric.
A Menu SAN main menus Command Command Options Port Optics (SFP) — Select to display the properties associated with a selected small form-factor pluggable (SFP) transceiver on the selected device. SNMP Setup — Select to configure SNMP traps. Trap Forwarding — Select to configure trap forwarding. Product Trap Recipients — Select to register a host as a trap recipient.
SAN shortcut menus Menu Command A Command Options FCIP — Select how to troubleshoot FCIP by choosing one of the following options: • Ping — Select to perform a zoning check between the selected device port WWNs. • Trace Route. (Trial and Licensed version Only) Select to view the route information from a source port on the local device to a destination port on another device. • Performance. (Trial and Licensed version Only) Select to view IP performance between two devices.
A SAN shortcut menus For each SAN component, you can optionally right-click the component and a shortcut menu displays. The table below details the command options available for each component.
SAN shortcut menus Component A Menu/Submenu Commands Comments Create Meta SAN View Only available for Backbone fabrics. Automatically creates a view with the selected fabric. View name is same as the current label. Map Display Port Display > Occupied Product Ports UnOccupied Product Ports Attached Ports Switch to Switch Connections Only available from Product List.
A SAN shortcut menus Component Menu/Submenu Commands Comments Table > Copy 'Device_Name Group' Copy Row Copy Table Export Row Export Table Search Select All Size All Columns To Fit Expand All Collapse All Customize Only available from Product List.
SAN shortcut menus Component Menu/Submenu Commands A Comments Swap Blades Virtual Fabric > Disable Logical Switches Locate Logical Switches > List_of_Logical_Switches (Fabric OS only) (Virtual Fabric-capable switches only) Zoning > Fabric Does not display when switch is in a Core Switch group, Chassis group or Isolated device group, or when it is in Access Gateway mode.
A SAN shortcut menus Component Menu/Submenu Commands Comments Product Only enabled when the fabric is tracked, and the product is removed and joins another fabric. Other Ports > Does not display when an Access Gateway mode device is attached to multiple fabrics. Show Ports check box Show Connections Port Display > Occupied Product Ports UnOccupied Product Ports Attached Ports Switch to Switch Connections Only available from Product List.
SAN shortcut menus Component Menu/Submenu Commands A Comments Technical Support > (Fabric OS only) Product/Host SupportSave Upload Failure Data Capture View Repository Port Display > Occupied Product Ports UnOccupied Product Ports Attached Ports Switch to Switch Connections Only available from Product List. Table > Copy 'Device_Name Group' Copy Row Copy Table Export Row Export Table Search Select All Size All Columns To Fit Expand All Collapse All Customize Only available from Product List.
A SAN shortcut menus Component Menu/Submenu Commands Comments Allow / Prohibit Matrix Security > L2 ACL Performance > Clear Counters Top Talkers Real-Time Graph Historical Graph Historical Report Bottleneck Graph Fabric Watch > Configure Port Fencing Frame Monitor Performance Thresholds Technical Support > Product / Host SupportSave Upload Failure Data Capture** View Repository Events Port Connectivity Port Optics (SFP) Telnet Telnet through Server Setup Tools Product Only ena
SAN shortcut menus Component Menu/Submenu Commands Comments Table > Copy 'Device_Name Group' Copy Row Copy Table Export Row Export Table Search Select All Size All Columns To Fit Expand All Collapse All Customize Only available from Product List. A HBA, iSCSI Host, and HBA Enclosure Element Manager Launches Element Manager for Fabric OS HBAs discovered using JSON agent. Launches blank window for unmanaged Fabric OS HBAs.
A SAN shortcut menus Component Menu/Submenu Commands Comments Port Display > Occupied Product Ports UnOccupied Product Ports Attached Ports Switch to Switch Connections Only available from Product List. Expand All Only available from Product List. Collapse All Only available from Product List. Properties Storage, iSCSI Storage, and Storage Enclosure Storage Port Mapping Trial and Licensed version Only Disabled for routed device.
SAN shortcut menus Component Menu/Submenu Commands Comments Port Display > Occupied Product Ports UnOccupied Product Ports Attached Ports Switch to Switch Connections Only available from Product List. Table > Copy 'Device_Name Group' Copy Row Copy Table Export Row Export Table Search Select All Size All Columns To Fit Expand All Collapse All Customize Only available from Product List.
A SAN shortcut menus Component Menu/Submenu Commands Comments Table > Copy 'Device_Name Group' Copy Row Copy Table Export Row Export Table Search Select All Size All Columns To Fit Expand All Collapse All Customize Only available from Product List. Collapse All Only available from Product List. Properties HBA and iSCSI Initiator Host Port Mapping Only available for Brocade, Emulex, and Qlogic HBAs and HBA enclosures. Performance > Real Time Graphs Disabled when all ports are offline.
SAN shortcut menus Component A Menu/Submenu Commands Comments Performance > Real Time Graphs Only available for occupied, managed ports. Disabled when all ports are offline. FC Security Protocol Only available for Managed JSON HBA Ports. Only available when you have the Security Privilege.
A SAN shortcut menus Component Menu/Submenu Commands Comments Giga-Bit Ethernet Port Performance > Real-Time Graph Modify Launches Element Manager. IP Troubleshooting > Ping Trace Route Performance (Trial and Licensed version Only) Port Display > Occupied Product Ports UnOccupied Product Ports Attached Ports Switch to Switch Connections Only available from Product List.
SAN shortcut menus Component Menu/Submenu Commands Comments Table > Copy 'Device_Name Group' Copy Row Copy Table Export Row Export Table Search Select All Size All Columns To Fit Expand All Collapse All Customize Only available from Product List.
A SAN shortcut menus Component Menu/Submenu Commands Comments Table > Copy 'Component' Copy Table Export Table Search Select All Size All Columns To Fit Expand All Collapse All Customize Some form of this shortcut menu is available for all tables in the Management interface.
Appendix B Call Home Event Tables In this appendix This appendix provides information about the specific events that display when using Call Home. This information is shown in the following Event Tables. • # CONSRV Events . . . . . . . . . . . . . . . . . . . . . . . . . . . . . . . . . . . . . . . . . . . . 1087 • # Thermal Events. . . . . . . . . . . . . . . . . . . . . . . . . . . . . . . . . . . . . . . . . . . . 1088 • Fabric OS Events . . . . . . . . . . . . . . . . . . . . . . . . . . . . . . . .
B Call Home Event Tables TABLE 89 # Thermal Events Event reason code FRU code/Event type Description Severity 800 DVP/LIM/HW High temperature warning. 3 801 DVP/LIM/HW Critically hot temperature warning. 3 802 DVP/LIM/HW Port card shutdown due to thermal violations. 3 805 SWM/SBAR/HW High temperature warning. 3 806 SWM/SBAR/HW Critically hot temperature warning. 3 807 SWM/SBAR/HW SBAR module shutdown due to thermal violations. 3 810 CTP/HW High temperature warning.
B Call Home Event Tables TABLE 90 Fabric OS Events (Continued) Event reason code FRU code/Event type Description Severity 1436 FW-1436 Marginal port. 3 1437 FW-1437 Faulty port. 3 1438 FW-1438 Faulty or missing SFPs.
B 1090 Call Home Event Tables Brocade Network Advisor SAN User Manual 53-1002696-01
Appendix C Event Categories In this appendix This section provides information about the events that display in each of the following categories: • Link incident events . . . . . . . . . . . . . . . . . . . . . . . . . . . . . . . . . . . . . . . . . . • Product status events . . . . . . . . . . . . . . . . . . . . . . . . . . . . . . . . . . . . . . . . . • Product audit events . . . . . . . . . . . . . . . . . . . . . . . . . . . . . . . . . . . . . . . . . • Security events . . . . . . . . . . . . .
C Product audit events If the event is a RASLOG and if the RASLOG ID matches any of the RASLOGS listed below, then the event is categorized as a product status event. • • • • • • • • • • • • • • • • • • • • • FW-1424 FW-1425 FW-1426 FW-1427 FW-1428 FW-1429 FW-1430 FW-1431 FW-1432 FW-1433 FW-1434 FW-1435 FW-1436 FW-1437 FW-1438 FW-1439 FW-1440 FW-1441 FW-1442 FW-1443 FW-1444 Product audit events Events that are used to track audit information are categorized as product audit events.
Security events C Security events Security events are those that indicate authentication success or failure, a security violation, or user login and logout. Security events for FC devices For FOS switches, if the event is a RASLOG event and the RASLOG ID contains 'SEC', then the event is categorized as a security event. Security events for IP devices For IOS devices, if the event OID starts with any of the following OIDs, then the event is categorized as a security event.
C User action events • • • • • • • • • • • • • • • • • 1.3.6.1.4.1.1991.1.6.1.7.4.2.13 [localMacAddrAuthFail] 1.3.6.1.4.1.1991.1.6.1.7.4.2.14 [pppLogonFail] 1.3.6.1.4.1.1991.1.6.1.7.4.2.18 [dot1xSupplicantAuthenticated] 1.3.6.1.4.1.1991.1.7.2.2.2.9 [apAuthFailureTooMany] 1.3.6.1.4.1.1991.1.8.2.1.4.0.2 [userLoginNotification] 1.3.6.1.4.1.1991.1.8.2.1.4.0.3 [userLogOffNotification] 1.3.6.1.4.1.1991.1.8.2.1.4.0.4 [userLoginFailNotification] 1.3.6.1.4.1.1991.1.11.1.1.2.2.2.32 [mwlAuthFailure] 1.3.6.1.4.1.
Product events C Product events All other events originating from the product are categorized as product events. IP Performance monitoring events IP performance monitoring events, listed in Table 91, occur when users select the option to forward events to the vCenter during VM Manager discovery. TABLE 91 Performance monitoring IP threshold events Trap name OID Description bnaRisingThresholdCrossed 1.3.6.1.4.1.1991.1.13.2.0.
C 1096 IP Performance monitoring events Brocade Network Advisor SAN User Manual 53-1002696-01
Appendix User Privileges D In this appendix • About user privileges . . . . . . . . . . . . . . . . . . . . . . . . . . . . . . . . . . . . . . . . . . 1097 • About Roles and Access Levels . . . . . . . . . . . . . . . . . . . . . . . . . . . . . . . . . 1114 About user privileges The Management application provides the User Administrator with a high level of control over what functions individual users can see and use.
D About user privileges TABLE 92 Application privileges and behavior Privilege Description No Privilege Read-Only Read/Write Active Session Management Allows you view active client sessions and disconnect an unwanted user. Disables the Active Sessions command from the Server menu. Enables the Active Sessions command from the Server menu. Disables all commands and functions on the dialog box except the Close and Help. Enables the Active Sessions command from the Server menu.
About user privileges TABLE 92 D Application privileges and behavior (Continued) Privilege Description No Privilege Read-Only Read/Write Element Manager Product Administration An Element Manager privilege that enables most functionally. Disables the functions described in the Element Manager User Manual for which you do not have rights. Displays the message, “You do not have rights to perform this action.” Same as No Privilege. Enables the functions described in the Element Manager User Manual.
D About user privileges TABLE 92 Application privileges and behavior (Continued) Privilege Description No Privilege Read-Only Read/Write Fault Management Allows you to control access to the SNMP Trap Registration and Forwarding dialog box, the Event Storage option of the Options dialog box, the Syslog Registration and Forwarding dialog box, as well as the Export and Clear functions in the Event Log dialog box and the Show and Hide functions in the Customize Columns dialog box.
About user privileges TABLE 92 D Application privileges and behavior (Continued) Privilege Description No Privilege Read-Only Read/Write Firmware Management Allows you to download firmware to selected switches and manage the firmware repository. Disables the Firmware Management command from the Configure menu and right-click menu. Enables the Firmware Management command from the Configure menu and right-click menu. Disables all commands and functions on the dialog box except the Close and Help.
D About user privileges TABLE 92 Application privileges and behavior (Continued) Privilege Description No Privilege Read-Only Read/Write Policy Monitor Allows you to configure policy monitors. Disables Policy Monitor command on the Monitor menu. Enables Policy Monitor command on the Monitor menu. Allows you to open the Policy Monitor dialog box; however, disables the Add, Delete, and Run buttons. No changes can be made. Enables you to use the Edit, Report, and History buttons to view content.
About user privileges TABLE 92 D Application privileges and behavior (Continued) Privilege Description No Privilege Read-Only Read/Write Security Allows you to enable and configure SANtegrity features. Disables the Security command from the Configure > Switch > Replicate menu. Disables the Security Log command on the Monitor > Logs menu. Disables the Security Misc command from the Server > Options menu. Disables the Security command from the Configure > Switch > Replicate menu.
D About user privileges TABLE 92 Application privileges and behavior (Continued) Privilege Description No Privilege Read-Only Read/Write Technical Support Data Collection Allows you to capture support data from Fabric OS switches. Disables the SupportSave, Upload Failure Data Capture, and View Repository commands from the Monitor > Technical Support menu and right-click menu. Enables the View Repository command from the Monitor > Technical Support menu and right-click menu.
About user privileges TABLE 92 D Application privileges and behavior (Continued) Privilege Description Web Services Allows you to use Web Services API. Zoning Activation (Fabric and offline zone database) Allows you to activate a zone configuration selected in the Zoning dialog box. NOTE You must also have the Zoning Offline and Zoning Online privileges to launch the Zoning dialog box.
D About user privileges TABLE 92 Application privileges and behavior (Continued) Privilege Description No Privilege Read-Only Read/Write Zoning Online Allows you to edit any of the fabric zone databases in the available fabrics within the Zoning dialog box from the client side and then save to the switch. In Zoning dialog box, the Zone DB list includes online and offline zones; however, if an online zone is selected, the contents are not loaded into the Zoning dialog box.
About user privileges TABLE 92 D Application privileges and behavior (Continued) Privilege Description No Privilege Read-Only Read/Write Zoning Offline Allows you to edit the zone database in offline mode and save the zone database to the repository or to the switch. In Zoning dialog box, the Zone DB list includes offline zones; however, if an offline zone is selected, the contents are not loaded into the Zoning dialog box.
D About user privileges TABLE 92 Application privileges and behavior (Continued) Privilege Description No Privilege Read-Only Read/Write Zoning - LSAN Allows you to edit and activate LSAN zones for the LSAN fabrics that are available within the Zoning dialog box. Prerequisite: Both the backbone fabrics as well as all directly connected edge fabrics must be added to a resource group and a user with LSAN Zoning privilege must be assigned to this specific resource group.
About user privileges TABLE 93 D SAN privileges and application behavior Privilege Description No Privilege Read-Only Read/Write SAN - Discovery Setup Allows you to configure discovery setup. Disables Setup on the Discover menu and toolbar. Enables Setup on the Discover menu and toolbar. Allows you to open the Discover Setup dialog box; however, disables all functions. Enables Setup on the Discover menu and toolbar. Enables all functions in the Discover Setup dialog box.
D About user privileges TABLE 93 SAN privileges and application behavior (Continued) Privilege Description No Privilege Read-Only Read/Write SAN - High Integrity Fabric Allows you to set Fabric Binding and Insistent Domain IDs. Disables the High Integrity Fabric command from the Configure menu. Enables the High Integrity Fabric command from the Configure menu. Disables all commands and functions on the dialog box except the Cancel and Help.
About user privileges TABLE 93 D SAN privileges and application behavior (Continued) Privilege Description No Privilege Read-Only Read/Write SAN - Properties Add/Delete Columns Allows you to define new properties as well as remove them. Disables the Add, Edit and Delete buttons on the Create View dialog box Columns tab. Disables the Add Column, Edit Column, and Delete Column commands on the right-click menu of the Product List column headers.
D About user privileges TABLE 93 SAN privileges and application behavior (Continued) Privilege Description No Privilege Read-Only Read/Write SAN - Storage Encryption Configuration Allows you to configure storage encryption configuration, including selecting storage devices and LUNs, viewing and editing switch, group, or engine properties, viewing and editing storage device encryption properties, and initiating manual LUN re-keying. Disables the Encryption command from the Configure menu.
About user privileges TABLE 93 D SAN privileges and application behavior (Continued) Privilege Description No Privilege Read-Only Read/Write SAN - Storage Encryption Security Allows you to configure storage encryption security, including creating a new encryption group, adding a switch to an existing group, zeroizing an encryption engine, backing up or restoring a master key, and enabling encryption functions after a power cycle. Disables all functions from the dialog box except view.
D About Roles and Access Levels TABLE 93 SAN privileges and application behavior (Continued) Privilege Description No Privilege Read-Only Read/Write SAN - View Management Allows you to create, edit, and delete views. Selecting from views should always be allowed unless restricted by the assignment of Views in the Group definition in the Users dialog box.
About Roles and Access Levels TABLE 94 D Application Features and Role Access Levels (Continued) Feature Roles with Read/Write Access Roles with Read-Only Access Event Management SAN System Administrator, Network Administrator Operator Fabric Watch SAN System Administrator, Fault Management SAN System AdministratorNetwork Administrator Operator FCoE Management SAN System Administrator, Network Administrator Security Administrator, Zone Administrator, Security Officer, Operator Firmware Man
D About Roles and Access Levels TABLE 95 SAN Features and Role Access Levels Feature Roles with Read/Write Access Roles with Read-Only Access SAN- Discovery Setup SAN System Administrator, Host Administrator Operator SAN - Element Manager SAN System Administrator, SAN - Element Manager - Product Operation SAN System Administrator, Operator SAN- Fabric Binding SAN System Administrator, Security Administrator, Security Officer Operator SAN- Fabric Tracking SAN System Administrator Operator
Appendix Device Properties E In this appendix • SAN device properties . . . . . . . . . . . . . . . . . . . . . . . . . . . . . . . . . . . . . . . . 1118 • Host properties . . . . . . . . . . . . . . . . . . . . . . . . . . . . . . . . . . . . . . . . . . . . .
E SAN device properties SAN device properties You can customize the device and fabric Properties dialog boxes to display only the data you need by adding, editing, and deleting property labels. You can also edit property fields to change information. Viewing Fabric properties To view the properties for a fabric, complete the following step. 1. Right-click any fabric and select Properties. The Fabric_Name Properties dialog box displays, with information related to the selected fabric.
SAN device properties E Viewing SAN device properties To view the properties for a device, complete the following steps. 1. Right-click any product icon and select Properties. The Properties dialog box displays, with information related to the selected device (such as, switches, directors, HBAs, trunks, tunnels, and nodes). Fields containing a green triangle ( ) in the lower right corner are editable.
E SAN device properties TABLE 97 Device properties (Continued) Field/Component IKE Policy # IP Address IPSec Policy # 1120 Description The IKE policy number. Also includes the following information: Authentication Algorithm Encryption Algorithm Diffie-Hellman SA Life • • • • The device’s IP address. The IPSec policy number. Also includes the following information: Authentication Algorithm Encryption Algorithm SA Life • • • L2 Capable Whether the device is Layer 2 capable.
SAN device properties TABLE 97 E Device properties (Continued) Field/Component Description Slot # The slot number of the trunk. Source IP Address The IP address of the of the FCIP tunnel source device. Speed (Gb/s) The speed of the port in gigabytes per second. State The device’s state, for example, online or offline. Status The operational status. Switch Name The switch name. Switch IP The switch IP address. Switch WWN The switch world wide name.
E SAN device properties 4. Click OK on the Properties dialog box to close. Viewing Storage properties The Storage Properties dialog box displays information related to a selected storage device. To view the properties for a storage device, complete the following steps. 1. Select a storage icon. 2. Select Edit > Properties. The Properties dialog box displays. 3. Click the Storage tab. NOTE Some fields may not be available for all products.
SAN device properties E Field Description Hosts Assigned The number of hosts to which this LUN has been assigned. Host Spares The number of disks assigned as host spares in addition to the disks that make up the LUN. Label A user-specified label. The default value is the name of the label as specified in the storage product. Loop (IBM ESS products only) The physical connection between a pair of product adapters in the ESS product. LSS ID Specifies the logical subsystem of an IBM ESS product.
E SAN device properties Viewing iSCSI Properties dialog box The iSCSI Properties dialog box displays information related to iSCSI. To view the properties for an iSCSI device, complete the following steps. 1. Right-click a product icon and select Properties . The Properties dialog box displays. 2. Select the iSCSI tab. NOTE Some fields may not be available for all products. 1124 Field Description Agent The Caffeine agent version number. Applications The applications.
SAN device properties E Field Description Name (Product) The name of the product. OS The name of the operating system running on the product. OS Build The operating system build running on the product. OS Release The operating system release running on the product. Portal Addresses The list of IP addresses. Port The port number. Protocol Error Count The number of protocol errors. Tag The group tag ID of the portal.
E SAN device properties The following port types are available depending on the selected device: • • • • FC Ports GigE Ports IP Ports iSCSI Ports NOTE iSCSI ports that have an FC Address of all zeros are inactive. All others are active. • Virtual Sessions Ports • Virtual FCoE Ports NOTE Depending on the port type, some of the following properties may not be available for all products.
SAN device properties TABLE 98 E Port properties (Continued) Field Description Device Type Whether the device is an initiator or target. Discovery Status The discovery status of the switch. Examples include ‘Discovered: Seed Switch’ and ‘Discovered: Not Reachable’. Distance Actual (km) The actual distance (in km) for -end port connectivity. Distance Estimated (km) The estimated distance (in km) for -end port connectivity.
E SAN device properties TABLE 98 1128 Port properties (Continued) Field Description L3 Capable Whether the device is Layer 3 capable. L2 Mode The Layer 2 mode. Options include Access, Converged, or Trunk. LAG ID The link aggregation group identifier. Last Discovery The date and time of the last discovery. Location The customer site location. Locked Port Type The port type of the locked product. Long Distance Setting Whether the connection is considered to be normal or longer distance.
SAN device properties TABLE 98 E Port properties (Continued) Field Description Protocol The network protocol, for example, Fibre Channel. Reason The device status. Remote Switch Name The remote switch name of the trunk. Remote Switch IP The remote switch IP address of the trunk. Remote Switch WWN The remote switch world wide name of the trunk. Remote Slot # The remote slot number of the trunk. Remote Master Port The remote master port of the trunk.
E Host properties TABLE 98 Port properties (Continued) Field Description VLAN Class of Service for Control Connection The VLAN class of service for the control connection of the FCIP tunnel. VLAN Class of Service for Data Connection The VLAN class of service for the data connection of the FCIP tunnel. VLAN ID The VLAN identification number. WWN The world wide name of the device. Host properties You can view device and port properties from the Product List or the map.
Host properties TABLE 31 E Adapter port properties (Continued) Field Description Type The port type; for example, N_Port. FC Address The port’s Fibre Channel address. Attached Port # The port number of the attached product. Active FC4 Types The active FC4 types; for example, SCSI or IP. Class of Service The class of the port; for example, Class-2 or Class-3. Switch The name of the switch. Fabric The name of the Fabric.
E Host properties TABLE 31 Adapter port properties (Continued) Field Description Operating State Displays details about the state of the following operating parameters: • Beacon State • Link Beacon State • MPIO Mode State • Path Time Out • Logging Level • Target Rate Limit • Default Rate Limit FC-SP Authentication Indicates whether FC-SP authentication is enabled or disabled. FCSP Status Whether FC-SP authentication is being used. Algorithm The configured authentication algorithm.
Appendix F Regular Expressions In this appendix This appendix presents a summary of Unicode regular expression constructs that you can use in the Management application. • Characters . . . . . . . . . . . . . . . . . . . . . . . . . . . . . . . . . . . . . . . . . . . . . . . . . • Character classes . . . . . . . . . . . . . . . . . . . . . . . . . . . . . . . . . . . . . . . . . . . • Predefined character classes . . . . . . . . . . . . . . . . . . . . . . . . . . . . . . . . . .
F Regular Expressions TABLE 1 Matches \e The escape character ('\u001B') \cx The control character corresponding to x TABLE 2 Character classes Construct Matches [abc] a, b, or c (simple class) [^abc] Any character except a, b, or c (negation) [a-zA-Z] a through z or A through Z, inclusive (range) [a-d[m-p]] a through d, or m through p: [a-dm-p] (union) [a-z&&[def]] d, e, or f (intersection) [a-z&&[^bc]] a through z, except for b and c: [ad-z] (subtraction) [a-z&&[^m-p]] a through z
Regular Expressions TABLE 4 POSIX character classes (US-ASCII only) Construct Matches \p{Blank} A space or a tab: [ \t] \p{Cntrl} A control character: [\x00-\x1F\x7F] \p{XDigit} A hexadecimal digit: [0-9a-fA-F] \p{Space} A whitespace character: [ \t\n\x0B\f\r] TABLE 5 java.lang.Character classes (simple java character type) Construct Matches \p{javaLowerCase} Equivalent to java.lang.Character.isLowerCase() \p{javaUpperCase} Equivalent to java.lang.Character.
F Regular Expressions TABLE 8 Construct Matches X? X, once or not at all X* X, zero or more times X+ X, one or more times X{n} X, exactly n times X{n,} X, at least n times X{n,m} X, at least n but not more than m times TABLE 9 Reluctant quantifiers Construct Matches X?? X, once or not at all X*? X, zero or more times X+? X, one or more times X{n}? X, exactly n times X{n,}? X, at least n times X{n,m}? X, at least n but not more than m times TABLE 10 Possessive quantifiers Co
Regular Expressions TABLE 12 F Back references Construct Matches \n Whatever the nth capturing group matched Quotation \ Nothing, but quotes the following character \Q Nothing, but quotes all characters until \E \E Nothing, but ends quoting started by \Q TABLE 13 Special constructs (non-capturing) Construct Matches (?:X) X, as a non-capturing group (?idmsux-idmsux) Nothing, but turns match flags on–off (?idmsux-idmsux:X) X, as a non-capturing group with the given flags on–off (?=X)
F 1138 Regular Expressions Brocade Network Advisor SAN User Manual 53-1002696-01
Appendix G Troubleshooting In this chapter • Application Configuration Wizard troubleshooting . . . . . . . . . . . . . . . . . • Browser troubleshooting . . . . . . . . . . . . . . . . . . . . . . . . . . . . . . . . . . . . . . • Client troubleshooting . . . . . . . . . . . . . . . . . . . . . . . . . . . . . . . . . . . . . . . . . • Fabric tracking troubleshooting . . . . . . . . . . . . . . . . . . . . . . . . . . . . . . . . . • FICON troubleshooting . . . . . . . . . . . . . . . . . . . . . . . .
G Application Configuration Wizard troubleshooting Application Configuration Wizard troubleshooting The following section states a possible issue and the recommended solution for Management application Configuration Wizard errors. Problem Resolution Unable to launch the Management application Configuration Wizard on a Windows Vista, Windows 7,or Windows 2008 R2 system The Windows Vista, Windows 7,or Windows 2008 R2 system enables the User Access Control (UAC) option by default.
Client troubleshooting G Client troubleshooting The following section states a possible issue and the recommended solution for client errors. Problem Resolution Downloading Client from a Internet Explorer Browser over HTTPS errors • CPU usage reaches 100% when using the Client in a local or remote client machine (Windows and Linux) TABLE 14 If the JNLP file does not launch automatically, use one of the following options: Complete the following steps. 1 Save the JNLP file to the local host.
G FICON troubleshooting FICON troubleshooting The following section states a possible issue and the possible cause for FICON errors. Problem Causes FICON not supported on switch error. FICON Unsupported Configurations: FICON is not supported on base switches. FICON is not supported on a logical switch which has an XISL configured. FICON is not supported if the PID format is 2. FICON is not supported if 10 bit address is enabled on 8-slot Backbone Chassis for non-default switch.
Firmware download troubleshooting G Problem Resolution Firmware download using SCP/SFTP does not work because of one of the following issues: • For internal SCP/SFTP server, the application was uninstalled and reinstalled without migration • For external SCP/SFTP server, the SSH handshake keypair is changed - manually - due to an external server reinstall - due to the SCP/SFTP server preference (Options dialog box) being changed from built-in to external (installed on same machine) or vice versa Clear
G Launch Client troubleshooting Launch Client troubleshooting The following section states a possible issue and the recommended solution if you are unable to launch the remote client. Problem Resolution Remote client does not upgrade from versions prior to 11.0. The remote client does not automatically upgrade when you select the remote client shortcut of client versions earlier than 11.0. To clear the old client and launch the new remote client version, complete the following steps.
Launch Client troubleshooting G Problem Resolution Unable to log into the Client (the application does not launch when you use a valid user name and password and exceptions are thrown in the client side). Use one the following procedures to configure the IP address in the host file. Windows operating systems 1 Log in using the 'Administrator' privilege. 2 Select Start > Run. 3 Type drivers in the Open field and press Enter. 4 Go to the ‘etc’ folder and open the ‘hosts’ file using a text editor.
G Names troubleshooting Names troubleshooting The following section states a possible issue and the recommended solution for names errors. Problem Resolution Duplicate name error. If you configured the Management application to only allow unique names and you try to use a name that already exists in the fabric.
Performance troubleshooting G Performance troubleshooting The following section states a possible issue and the recommended solution for Performance errors. Problem Resolution An error message with the following text displays: Real Time statistics collection has failed. Please see master log for details. Make sure that the following prerequisites for Performance Monitoring Data collection are met.
G Performance troubleshooting Problem Resolution An error message with the following text displays: Real Time statistics collection has failed. Please see master log for details. 2 1148 To collect data, the SNMP credentials in the Management application and switch must match. SNMP v1 or v3: The community strings entered in the Address Properties dialog box SNMP tab must match the one entered in the switch.
Performance troubleshooting Problem Resolution An error message with the following text displays: Real Time statistics collection has failed. Please see master log for details. 3 G To collect GigE port and FCIP statistics, you must enable the FCIP-MIB capability.
G Performance troubleshooting Problem Resolution An error message with the following text displays: Real Time statistics collection has failed. Please see master log for details. 5 To collect data on Virtual Fabric-enabled switches, the Fabric OS user must have access to all Virtual Fabrics. The SNMPv3 user name must be the same as the Fabric OS user name. If the SNMPv3 and Fabric OS user names do not match, data is not collected for the virtual switches with the non-default VF ID.
Port Fencing troubleshooting G Port Fencing troubleshooting The following section states a possible issue and the recommended solution for Port Fencing errors. Problem Resolution If you segment a switch from a fabric then rediscover the switch without accepting changes, the Port Fencing dialog box displays the switch twice and the port count is doubled. Right-click on the fabric that the segmented switch (with red minus icon) is part of and select Accept Changes.
G Server Management Console troubleshooting Server Management Console troubleshooting The following section states a possible issue and the recommended solution for server management console errors. Problem Resolution Unable to launch the SMC on a Windows Vista,Windows 7 , or Windows 2008 R2 system The Windows Vista,Windows 7,or Windows 2008 R2 system enables the User Access Control (UAC) option by default. When the UAC option is enabled, the SMC cannot launch.
Supportsave troubleshooting G Problem Resolution Unable to launch the SMC on a Windows Vista or Windows 7 system continued Disable using the Group Policy by completing the following steps. You can perform this procedure on you local machine using Local Group Policy editor or for many computers at the same time using the Active Directory-based Group Policy Object (GPO) editor. To disable using the Local Group Policy editor, complete the following steps.
G Technical support data collection troubleshooting Technical support data collection troubleshooting The following section states a possible issue and the recommended solution for technical support data collection errors.
Wireless troubleshooting G Wireless troubleshooting After discovery, the Management application inspects the trap listener and syslog recipient configuration on wireless controllers. If there is a problem with the registration, the Management application changes the “registration success” master log event to a warning event with additional message text.
G Zoning troubleshooting Problem Resolution Zoning activation message displays for a long time, but zone configuration is not activated. Telnet zoning can take a long time. To improve speed, open the Discover Setup dialog box (Discover > Setup) and add the IP address for the device to the Selected Individual Addresses list. Out of memory error caused by running a zoning report for a large zone configuration (1 MB) in a medium-sized SAN due to a third party tool.
Appendix H Database Fields In this appendix • Database tables and fields. . . . . . . . . . . . . . . . . . . . . . . . . . . . . . . . . . . . . 1157 • Views . . . . . . . . . . . . . . . . . . . . . . . . . . . . . . . . . . . . . . . . . . . . . . . . . . . . . 1360 Database tables and fields NOTE The primary keys are marked by an asterisk (*) TABLE 17 ACH_CALL_CENTER Field Definition Format ID * Unique generated database identifier. int NAME Name of the Call Center.
H Database tables and fields TABLE 20 Field Definition Format FILTER_ID * ID of the event filter. int EVENT_ID * Event ID which needs to be associated with the filter. int Field Definition Format ID* Unique generated database identifier. int NAME Name of the event filter. varchar 256 DESCRIPTION Description of the event filter. varchar 256 Field Definition Format Size ID* Unique generated database identifier. int SWITCH_WWN WWN of the switch.
H Database tables and fields TABLE 24 ADAPTER_DRIVER_FILE_DETAILS (Continued) Field Definition Format Size OS_ARCHITECTURE Supported OS architecture varchar 32 IMPORTED DATE Imported date of the driver file timestamp with time zone RELEASE DATE Release date of the driver file timestamp with time zone LOCATION Location of the adapter driver file in the repository varchar TABLE 25 1024 ADAPTER_PORT_CONFIG_DETAILS Field Definition Format CONFIG_ID Configuration ID int PROPERTY_ID
H Database tables and fields TABLE 31 Field Definition Format AOR_ID The column holds ID of an AOR. It is Foreign Key and refers to ID column of AOR table int VIP_SERVER_ID The column holds ID of VIP Server. It is Foreign Key and refers to ID column of VIP_SERVER table int TABLE 32 Size AVAILABLE_FLYOVER_PROPERTY Field Definition Format ID* Unique generated database identifier. int NAME Name of the available property to be included in the flyover display.
H Database tables and fields TABLE 35 BOOT_LUN_SEQUENCE_DETAIL (Continued) Field Definition Format LUN_NUM LUN number of the port in the Boot LUN Sequence int SEQUENCE_NUM Sequence number of the port in the Boot LUN Sequence TABLE 36 Size CAPABILITY_ Field Definition Format Size NAME * Name of the capability. varchar 256 DESCRIPTION Optional detailed description about the capability. varchar 512 TABLE 37 CARD Field Definition Format ID * Unique generated database identifier.
H Database tables and fields TABLE 37 CARD (Continued) Field Definition Format FCIP Advanced Extension Licensing is available. 1 = available. 0 = not licensed. -1 = not supported. Default value is -1. smallint MAX_FCIP_TUNNELS The maximum number of tunnels that can be created in this slot. • -1 = not supported. • Default value is -1. int MAX_FCIP_CIRCUITS Describes the maximum number of circuits that can be created in this slot. • -1 = not supported. • Default value is -1.
H Database tables and fields TABLE 40 CED_APPLICATION_MEMBER Field Definition Format APPLICATION_ID* Auto-generated DB CED_Application table ID. int ZONE_ID* Auto-generated DB Zone table ID which joins as a member of the application. int TABLE 41 Size CED_USER_PREFERENCE Field Definition Format Size USER_NAME* User Name carried from _USER table. varchar 128 FABRIC_ID* Fabric ID carried from Fabric table.
H Database tables and fields TABLE 42 Definition Format DOT1X_ENABLED Indicate if 802.1x authentication is enabled on this port. The default value is 0. smallint PORT_ROLE Thisfield is used to store the port role value. The value will be populated by the NosSwitchAssetCollector. This field valid values include ISL or Edge. Default value is empty string. varchar 32 Size TABLE 43 Size CLIENT_VIEW Field Definition Format ID * Unique generated database identifier.
H Database tables and fields TABLE 46 CLIENT_VIEW_MEMBER_HOST Field Definition Format CLIENT_VIEW_ID Primary key of CLIENT_VIEW table int HOST_ID Primary key of DEVICE_ENCLOSURE table int Field Definition Format ID * Arbitrary integer to identify the cluster. int NAME User-assigned name to identify the cluster. Names should be unique to avoid user confusion, but the database does not enforce uniqueness.
H Database tables and fields TABLE 49 Definition Format MAX_PCIF Maximum number of Pci functions. smallint MIN_BANDWIDTH Minimum guaranteed bandwidth. Value will be in Gbps (0 to 10). int MTU Maximum transmission unit in bytes int TABLE 50 Size CNA_PRODUCT_CONNECTIVITY Field Definition Format CNA_PORT_ID CNA Port identifier. int INTERFACE_ID Interface Identifier. int TABLE 51 Size CNA_ETH_PORT_CONFIG Field Definition Format ID Unique autogenerated db id.
H Database tables and fields TABLE 52 CNA_PORT (Continued) Field Definition Format Size NAME Name of the port varchar 256 MAC_ADDRESS MAC address of the port. varchar 64 MEDIA Media of the port varchar 64 CEE_STATE State of the port. varchar 64 HBA_ID ID of the port. int CREATION_TIME CNA port record creation time. This tells when this port was first discovered.
H Database tables and fields TABLE 56 Definition Format TARGET_ID Target ID of the SNMP collector data. For device level collector it will use deviceId, and for port level it will use interfaceId. int PROP_STR Property string of the PERF_COLLECTOR. varchar COLLECTOR_TARGET_ENTR Y_TYPE Target type of the SNMP collector data. for device int level collector the target type is 0, for port level it is 1.
H Database tables and fields TABLE 57 CORE_SWITCH (Continued) Field Definition Format SNMP_REGISTERED Determines whether the switch is registered for sending SNMP traps . • 1 is registered • 0 is not registered. smallint USER_IP_ADDRESS Only for McData switches, this column is used to store the IP address which user provides for those M-model switches for which seed switch is unable to return IP address.
H Database tables and fields TABLE 58 Field Definition Format CORE_SWITCH_ID * DB ID. int CAPABILITY_ * Name of the capability detected on the core switch. varchar ENABLED 1 = the capability is enabled on the core switch. Default value is 0. int TABLE 59 Size 256 CORE_SWITCH_CHECKSUM Field Definition Format CORE_SWITCH_ID * DB ID. int CHECKSUM_KEY * Checksum type. varchar 32 CHECKSUM Checksum value.
H Database tables and fields TABLE 61 CORE_SWITCH_DETAILS (Continued) Field Definition Format Size MODEL_NUMBER Model number is the same as the model number like Brocade 8000, Brocade VDX 6710. varchar 32 MANUFACTURER Manufacturer for the switch. varchar 32 PLANT_OF_MANUFACTURE R Plant of the manufacturer for the switch. varchar 32 SWITCH_SERIAL_NUMBER This is the factory serial number. varchar 32 ACT_CP_PRI_FW_VERSION Stores Active CP primary firmware version.
H Database tables and fields TABLE 61 Definition DOMAIN_NAME Denotes the domain name configured in switch. FRAME_LOG_SIZE The number of entries in the framelog. int FRAME_LOG_ENABLED Indicates if framelog is enabled on the switch. 0 = disabled, 1 = enabled. smallint MAPS_ENABLED Boolean flag to indicate if the switch is MAPS enabled or not. Enabled: 1, Disabled: 0. smallint TABLE 62 Format Size CRYPTO_HOST Field Definition Format ID Unique generated database identifier.
H Database tables and fields TABLE 63 CRYPTO_LUN (Continued) Field Definition Format LAST_REKEY_STATUS The success or failure of the most recent re-keying operation, if any. This field is not currently used, but is left in the hope that FOS will support it in the future. Only valid for disk LUNs. The default value is 0. smallint LAST_REKEY_PROGRESS Indicates whether a re-key operation is in progress. • 0 = no re-keying in progress. • > 0 = percentage done of re-keying operation in progress.
H Database tables and fields TABLE 63 1174 CRYPTO_LUN (Continued) Field Definition Format LUN_STATE LUN operational status, such as OK or disabled for various reasons. For possible values see the enum definition in CryptoClientConstants. The default value is 0. int LUN_FLAGS Bitmap of LUN options. The only option currently used is bit 0 (least significant) which indicates that the LUN must be manually enabled because it has been disabled due to inconsistent metadata detected.
H Database tables and fields TABLE 63 CRYPTO_LUN (Continued) Field Definition Format TIME_LEFT_FOR_AUTO_R EKEY The time left until next auto rekey, starts from the time last key for LUN was generated. This field is not updated every minute in DB. Its value is same as last_rekey_date + re_key_interval. As per current CAL implementation, will get only last_rekey_date when rekey is in progress. Otherwise it will be 0.
H Database tables and fields TABLE 64 Definition Format Size KAC_CERTIFICATE The public key certificate, in PEM format, of the switch''s Key Archive Client module. This certificate is installed on key vaults to establish secure communication between this switch and the key vault. For firmware versions below 7.1.0 it will be in PEM format (encoded) and for firmware versions 7.1.0 and above it will be in p12 format (encoded).
H Database tables and fields TABLE 65 CRYPTO_TARGET_CONTAINER (Continued) Field Definition Format Size TARGET_PORT_WWN The Port WWN of the physical target storage device associated with this container. char 23 TARGET_NODE_WWN The Node WWN of the physical target storage device associated with this container. char 23 CONTAINER_FIELD_DATA Container metadata information varchar 256 CONFIGURATION_STATUS Configuration status. Default value is 0.
H Database tables and fields TABLE 68 Definition Format Size UI_PANEL_CLASS_NAME Provides the mapping between widget and UI panel. Fully qualified class name of the dashboard widget user interface class. The class should extend from AbstractGadget. varchar 128 SUMMARY_CLASS_NAME Provides the mapping between widget and the summary. Fully qualified class name of the summary implementation for the widget. The class should implement Summary interface.
H Database tables and fields TABLE 70 DEFAULT_FAVORITES (Continued) Field Definition Format THRESHOLD The measure Tx MBps or Rx MBps based on DEFAULT_FAVORITES.NAME int MAIN_MEASURE The Additional measures based on the FAVORITE.MAIN_MEASURE varchar ADDITIONAL_MEASURE The Additional measures based on the FAVORITE.MAIN_MEASURE int TABLE 71 Size 40 DEPLOYMENT_CONFIGURATION Field Definition Format ID Unique generated database identifier.
H Database tables and fields TABLE 71 Definition Format MANAGEMENT_FLAG True if deployment should be managed by Deployment Manager Module and this will be displayed in Deployment Manager UI smallint DESCRIPTION Used to describe the deployment configuration varchar TABLE 72 Size 255 DEPLOYMENT_HANDLER Field Definition Format ID Unique generated database identifier.
H Database tables and fields TABLE 74 DEPLOYMENT_STATUS Field Definition Format ID Unique generated database identifier. serial DEPLOYMENT_CONFIGU RATION_ID Foreign Key References DEPLOYMENT_CONFIGURATION(id). Identifies the deployment configuration int DEPLOYMENT_TIME Start Time of the deployment (UTC) timestamp with time zone STATUS Overall status of the deployment.
H Database tables and fields TABLE 76 DEVICE (Continued) Field Definition Format Size SYS_CONTACT The textual identification of the contact person for this device, together with information on how to contact this person. varchar 255 DESCRIPTION A textual description of the device. varchar 512 SYS_LOCATION The physical location of this device. varchar 255 COMMUNITY_STR_GET SNMP GET community string to query the device.
H Database tables and fields TABLE 76 DEVICE (Continued) Field Definition Format Size SNMPV3_RW_AUTH_TYPE SNMP V3 read write authentication type. varchar 1 SNMPV3_RW_AUTH_USERNAME SNMP V3 read write authentication user name. varchar 512 SNMPV3_RW_AUTH_PASSWORD SNMP V3 read write authentication password. varchar 512 SNMPV3_RW_PRIV_PROTOCOL SNMP V3 read write privacy protocol. varchar 1 SNMPV3_RW_PRIV_PASSWORD SNMP V3 read write privacy password.
H Database tables and fields TABLE 76 Definition Format Size TACPLUS_ENABLE_PASSWORD TACACS+ enable password. varchar 512 OPER_STATUS Device operational status. smallint OPER_STATUS_LAST_UPDATED Time when the device operational status got updated recently. bigint LLDP_CHASSIS_ID_SUBTYPE Chassis ID subtype returned by lldp MIB. smallint LLDP_CHASSIS_ID Chassis ID returned by lldp MIB. bytea IS_FDP_ENABLED Flag to identify whether Foundry Discovery Protocol is enabled or not.
H Database tables and fields TABLE 76 DEVICE (Continued) Field Definition Format MPLS_MANAGE_STATE This flag is to classify the device mpls managing state • 0 indicates unknown state for catching all • 1 indicates not applicable; if the IP Product is not XMR/MLX, it will be set to this value. • 2 indicates MPLS unmanaged state; in PP or PPE edition, XMR/MLX product will be set to this value. • 3 indicates MPLS managed state; only XMR/MLX product in EE edition will be set to this value.
H Database tables and fields TABLE 76 1186 DEVICE (Continued) Field Definition Format POE_CAPABLE The POE capability of device. Possible values are: • 0 = POE is not supported by this device • 1 = POE is supported with IEEE 802.3af standard by this device • 2 = POE plus is supported with IEEE 802.3at standard by this device smallint CLUSTER_MODE This column is used to determine whether VCS Cluster is in Standalone mode or Cluster mode.
H Database tables and fields TABLE 76 DEVICE (Continued) Field Definition Format IS_PRINCIPAL_SWITCH This column is used to determine whether VCS member is a Principal switch or not. Value 1 indicates that this is a principal switch and 0 indicates that this not a Principal switch. The values will be populated by the VCS collector during the discovery of the VCS switch. The default value of 0 means that its a principal switch.
H Database tables and fields TABLE 77 1188 DEVICE_ENCLOSURE (Continued) Field Definition Format Size DESCRIPTION Description if any. varchar 256 COMMENT_ Comments if any. varchar 256 IP_ADDRESS IP Address if assigned by user. varchar 128 VENDOR Vendor name. varchar 256 MODEL Device enclosure Model. varchar 256 SERIAL_NUMBER Serial Number given for the entity. varchar 256 FIRMWARE Firmware running on the device which is not applicable for device enclosure logical entity.
H Database tables and fields TABLE 77 DEVICE_ENCLOSURE (Continued) Field Definition Format MANAGED_BY 1 - Manual - (user created not managed condition) Default. 2 - Host Adapter 3 - VMM 4.Both Host Adapter and VMM'; smallint QUEUE_DEPTH Queue Depth can be used to control FCP exchange resource allocation. Queue depth can range from 0 to 254 and default value is 32. int TABLE 78 DEVICE_ENCLOSURE_MEMBER Field Definition Format ENCLOSURE_ID* DEVICE_ENCLOSURE table ID.
H Database tables and fields TABLE 80 DEVICE_GROUP (Continued) Field Definition Format Size DESCRIPTION Device group description. varchar 255 IS_PUBLIC Flag to identify whether this group is shared across users. num (1,0) IS_INTERNAL Flag to identify this group is internal. num (1,0) TABLE_SUBTYPE Table subtype defined by BizObject framework varchar 32 IS_AP_GROUP Flag to identify whether this group is access point device group.
H Database tables and fields TABLE 82 DEVICE_NODE (Continued) Field Definition Format TRUSTED 1 = the node is trusted for "fabric tracking. Default value is 0. smallint CREATION_TIME Timestamp when the record is created by the Management application server. timestamp MISSING 1 = the device node is missing from the fabric. Default value is 0. smallint MISSING_TIME Time when the device node missed. timestamp PROXY_DEVICE One of the device ports of this device node has translated domain.
H Database tables and fields TABLE 83 Definition Format MISSING Denotes if this device port is missing or not. smallint MISSING_TIME Denotes the time from which the device port is missing. Applicable only if the device is missing. timestamp NPV_PHYSICAL Denotes if this is physical device port or a logical NPIV port. smallint EDGE_SWITCH_PORT_WWN EDGE_SWITCH_PORT_WWN will be the same as the SWITCH_PORT_WWN except in the case of devices behind the AG.
H Database tables and fields TABLE 86 EE_MONITOR Field Definition Format ID* Unique generated database identifier. int MONITOR_ID The Number (Index) given by the switch when user creates End-End monitor on the switch. int SWITCH_PORT_ID References the ID in SWITCH_PORT table. int SOURCE_PORT_ID References the ID in DEVICE_PORT table and this is an initiator for EE monitor. int DEST_PORT_ID References the ID in DEVICE_PORT table and this is a target for EE monitor.
H Database tables and fields TABLE 89 Field Definition Format ID* Unique generated database identifier. int EE_MONITOR_ID int CREATION_TIME timestamp ACTIVE_STATE smallint TX double precision RX double precision CRCERRORS double precision TABLE 90 Size EE_MONITOR_STATS_30MIN Field Definition Format ID* Unique generated database identifier.
H Database tables and fields TABLE 91 ENCRYPTION_ENGINE (Continued) Field Definition Format WWN_POOLS_AVAILABLE Not used. Previously used to indicate the number of WWN pools remaining for allocation on this encryption engine. This feature is no longer supported. int STATE Administrative state for this engine. 0 = disabled, 1 = enabled. The default value is 0. smallint SP_CERTIFICATE The public key certificate, in PEM format, for the Security Processor within the Encryption Engine.
H Database tables and fields TABLE 92 ENCRYPTION_GROUP (Continued) Field Definition Format LEADER_SWITCH_ID 'Foreign key reference to both the VIRTUAL_SWITCH table and the CRYPTO_SWITCH table (both switch tables use the same primary key values). Identifies the switch that currently provides central configuration and reporting capabilities for the encryption group. This column may be null if the group leader is not in a discovered fabric.
H Database tables and fields TABLE 92 ENCRYPTION_GROUP (Continued) Field Definition Format RECOVERY_SET_SIZE No longer used. Previously used to indicate the number of smart cards used to back up a Master Key. The number of cards is now specified when the backup is created, and not persisted in the database. The default value is 0. smallint KEY_VAULT_TYPE Indicates the type of key vault used by switches in this Encryption Group.
H Database tables and fields TABLE 94 Field Definition Format ENCRYPTION_GROUP_ID Foreign key reference to the ENCRYPTION_GROUP record that describes the group ID of this Encryption Group. int HA_MODE Indicates the configured High Availability mode for the encryption group. Possible values are noHA, opaque, transparent, and NA. varchar 32 AUTHENTICATION_MODE Indicates the configured User Authentication mode for the encryption group. Possible values are None, Username, UserPass, and NA.
H Database tables and fields TABLE 96 ETHERNET_CLOUD Field Definition Format ID Unique generated database identifier. int SWITCH_ID The unique id of the switch this cloud is associated to. int TABLE 97 ETHERNET_INTERFACE Field Definition INTERFACE_ID TABLE 98 Format Size int ETHERNET_ISL Field Definition Format ID Unique generated database identifier. int SOURCE_PORT_ID The unique id of the source port. int DEST_PORT_ID The unique id of the destination port.
H Database tables and fields TABLE 99 Definition Format EVENT_ORIGIN_ID Database ID of the event origin such as Trap, Syclog etc referring to EVENT_ORIGIN metadata. int EVENT_CATEGORY_ID Database ID of the event category referring to EVENT_CATEGORY metadata. int EVENT_MODULE_ID Database ID of the event module referring to EVENT_MODULE metadata. int EVENT_DESCRIPTION_ID Indicates the identifier of the event description in the EVENT_DESCRIPTION table.
H Database tables and fields TABLE 100 EVENT_CALL_HOME (Continued) Field Definition Format REASON_CODE Indicates the reason code of the Call Home event. int FRU_POSITION Indicates the FRU position of the Call Home event. int TABLE 101 Size EVENT_CATEGORY Field Definition Format ID Unique generated database identifier. int DESCRIPTION Holds the event categories.
H Database tables and fields TABLE 103 Definition Format PRODUCT_ADDRESS Indicates the IP Address of the Product from which the event is originated. varchar RAS_LOG_ID Indicates the RASLOG Id of the RASLOG event. varchar INTERFACE_TYPE Indicates the type of the interface – Possible Values: Ethernet Port-0, FC Port-1. smallint USER_NAME Captures the user information from audit Syslog messages. Varchar 512 PORT_NAME Shows the PortName for the corresponding port.
H Database tables and fields TABLE 105 EVENT_POLICY_SOURCE_ENTRY (Continued) Field Definition Format Size MANAGEMENT_ELEMENT_ID A soft reference key to the Management Element ID. Do not maintain it as a foreign key constraints. The default value is 0. int INTERFACE_ID A soft reference key to the Interface ID. Do not maintain it as a foreign key constraints. The default value is 0. int DEVICE_GROUP_ID A reference key to the Device Group Do not maintain it as a foreign key constraints.
H Database tables and fields TABLE 107 Definition Format Size OPERATOR2 AND operator used to append the rule. varchar 12 MESSAGE_ID Message ID provided by the user. varchar 20 OPERATOR3 AND operator used to append the rule. varchar 12 IP_ADDRESS Source IP Address. varchar 1024 OPERATOR4 AND operator used to append the rule. varchar 12 WWN Source WWN. varchar 1024 OPERATOR5 AND operator used to append the rule. varchar 12 COUNT Count of the specified event.
H Database tables and fields TABLE 108 FABRIC (Continued) Field Definition Format AD_ENVIRONMENT 1 = there are user-defined ADs in this fabric. Default value is 0. smallint MANAGED 1 = it is an actively "monitored" fabric; otherwise, it is an "unmonitored" fabric. Default value is 1. smallint MANAGEMENT_STATE Bit map to indicate various management indications for the fabric. Default value is 0. smallint TRACK_CHANGES 1 = changes (member switches, ISL and devices) in the fabric are tracked.
H Database tables and fields TABLE 108 Definition Format TRACKING_STATUS This represents bitmask as an integer value which represents missing or untrusted state of fabric members, ISLs, SANConnections, device Nodes and device ports. 1 is missing switch/ISL in fabric, 2 is untrusted switch or ISL in fabric, 4 is missing initiator or port in fabric, 8 is untrusted initiator or port in fabric, 16 is missing target or port in fabric, 32 is untrusted target or port in fabric.
H Database tables and fields TABLE 111 FABRIC_MEMBER (Continued) Field Definition Format TRUSTED 1 = the switch is a trusted member of the fabric. Either found in the initial discovery or user subsequently entrusted the switch by user action. Default Value is 0. smallint CREATION_TIME When the switch became a member. Default Value is ’now()’. timestamp MISSING 1 = it is missing from the fabric. Default Value is 0.
H Database tables and fields TABLE 115 Definition Format Size FROM_TIME The time interval in which the graph is shown. Time interval can be predefined or custom. If FROM_TIME is Custom, the user can choose the number of minutes/hours/days or specify the time interval. varchar 40 CUSTOM_LAST_VALUE The number of minutes/hours/days. It becomes null in two cases. 1. When the value of FROM_TIME is not Custom. 2.
H Database tables and fields TABLE 116 FC_PORT_STATS (Continued) Field Definition Format CREATION_TIME The polling time. timestamp ACTIVE_STATE State of collection: 0 = failed 1 = success smallint LINKFAILURES Number of link failures. double precision. TXLINKRESETS Number of transmit link failures. double precision. RXLINKRESETS Number of receive link failures. double precision. SYNCLOSSES Number of sync losses. double precision. SIGNALLOSSES Number of signal losses.
H Database tables and fields TABLE 117 FC_PORT_STATS_1DAY (Continued) Field Definition TXLINKRESETS double precision. RXLINKRESETS double precision. SYNCLOSSES double precision. SIGNALLOSSES double precision. SEQUENCEERRORS double precision. INVALIDTRANSMISSIONS double precision. CRCERRORS double precision.
H Database tables and fields TABLE 118 FC_PORT_STATS_2HOUR (Continued) Field Definition Format RXLINKRESETS double precision. SYNCLOSSES double precision. SIGNALLOSSES double precision. SEQUENCEERRORS double precision. INVALIDTRANSMISSIONS double precision. CRCERRORS double precision. DATA_GAPS_IN5MIN smallint DATA_GAPS_IN30MIN smallint C3_DISCARD TABLE 119 Count of Class 3 Frames that were discarded upon reception at this port. There is no FBSY or FRJT generated for Class 3 Frames.
H Database tables and fields TABLE 119 FC_PORT_STATS_30MIN (Continued) Field Definition Format SIGNALLOSSES double precision. SEQUENCEERRORS double precision. INVALIDTRANSMISSIONS double precision. CRCERRORS double precision. DATA_GAPS_IN5MIN smallint C3_DISCARD TABLE 120 Count of Class 3 Frames that were discarded upon reception at this port. There is no FBSY or FRJT generated for Class 3 Frames. They are simply discarded if they cannot be delivered.
H Database tables and fields TABLE 122 FCIP_TUNNEL (Continued) Field Definition Format MAX_RETRANSMISSION FCIP Tunnel Parameter. int WAN_TOV_ENABLED Is WAN TOV enabled. Default value is 0. smallint TUNNEL_STATUS Tunnel Status (Active/Inactive). int DESCRIPTION Description for the created tunnel. varchar FICON_TRB_ID_ENABLED Whether Ficon_Tape_Read_Block is enabled on that tunnel. Default value is 0.
H Database tables and fields TABLE 122 1214 FCIP_TUNNEL (Continued) Field Definition Format Size REMOTE_WWN Configured WWN of the Remote Node. char 64 CDC CDC Flag. Default value is 0. smallint ADMIN_STATUS Admin Status of the Tunnel. Default value is 0. smallint CONTROL_L2_COS Class of service as defined by IEEE 802.1p for tunnel. int Default value is -1. DSCP_CONTROL DiffServe marking for control frame. Default value is -1. int TRUNKING_ALGORITHM Trunking Algorithm.
H Database tables and fields TABLE 122 FCIP_TUNNEL (Continued) Field Definition Format Size PRESHARED_KEY The preshared key on tunnel. char 32 QOS_HIGH QoS high value. smallint QOS_MEDIUM QoS medium value. smallint QOS_LOW QoS low value. smallint BACKWARD_COMPATIBLE Whether the 10G tunnel is backward compatible with previous FOS versions. smallint FICON_TERADATA_READ_E NABLED Whether Ficon_Teradata_Read_Pipelining is enabled on that tunnel.
H Database tables and fields TABLE 123 1216 FCIP_TUNNEL_CIRCUIT (Continued) Field Definition Format MIN_COMM_RATE Minimum communication int Speed. The default value is 0. MAX_COMM_RATE Maximum communication int Speed. The default value is 0. MIN_RETRANSMIT_TIME Minimum Retransmission Time. The default value is -1 int MAX_RETRANSMIT_TIME Maximum retransmission time. The default value is -1 int KEEP_ALIVE_TIMEOUT Keep Alive timeout.
H Database tables and fields TABLE 123 FCIP_TUNNEL_CIRCUIT (Continued) Field Definition Format Size CIRCUIT_STATUS_STRING Circuit Status string value from switch for the tunnel varchar 256 L2COS_F_CLASS The default value is 0. smallint L2_COS_HIGH The default value is 0. smallint L2_COS_MEDIUM The default value is 0. smallint L2_COS_LOW The default value is 0. smallint DSCP_F_CLASS The default value is 0. smallint DSCP_HIGH The default value is 0.
H Database tables and fields TABLE 124 FCIP_TUNNEL_PERFORMANCE (Continued) Field Definition Format RTT_BY_TIME_OUT Counter of retransmit packets due to timeout double precision RTT_BY_DUP_ACK Counter of retransmit packets due to duplicate acknowledgement' double precision DUPLICATE_ACK Counter of duplicate acknowledgement packets double precision ROUND_TRIP_TIME Round trip time in milliseconds double precision TCP_OUT_OF_ORDER Counter of TCP out-of-order.
H Database tables and fields TABLE 126 FCIP_TUNNEL_STATS_1DAY Field Definition Format ID* int TUNNEL_DBID int SWITCH_ID int CREATION_TIME timestamp TX double precision RX double precision TX_UTILIZATION double precision RX_UTILIZATION double precision DROPPED_PACKETS double precision COMPRESSION double precision LATENCY double precision LINK_RETRANSMITS double precision ACTIVE_STATE smallint RTT_BY_TO Counter of retransmit packet by timeout.
H Database tables and fields TABLE 127 FCIP_TUNNEL_STATS_2HOUR (Continued) Field Definition Format RTT_BY_DUP_ACK Counter of retransmit packet by duplicate Ack.
H Database tables and fields TABLE 130 FCR_ROUTE Field Definition Format ID* Unique generated database identifier. int BB_FABRIC_ID Backbone fabric DB ID. int FCR_FABRIC_ID FID assigned to edge fabric. int SWITCH_WWN WWN of the router switch. varchar NR_PORT_ID Route parameter. int FCRP_COST Route parameter. int EX_PORT_WWN Ex_port WWN. varchar 128 Field Definition Format Size FEATURE_ID* ID used to uniquely identify the feature. int 6 NAME Name of the feature.
H Database tables and fields TABLE 134 Definition Format Size MANUFACTURER Manufacturer of the device, typically IBM. varchar 64 MANUFACTURER_PLANT Plant number where the device is manufactured. varchar 64 SEQUENCE_NUMBER Device sequence number. varchar 32 TAG FICON device property, e.g., 809a or 809b. varchar 16 FLAG FICON device property, e.g., 0x10 (hex). varchar 8 PARAMS FICON device property string, e.g., Valid channel port.
H Database tables and fields TABLE 137 FOUNDRY_DEVICE Field Definition Format DEVICE_ID Database ID of the DEVICE instance. int IMAGE_VERSION Firmware image version currently running in the device. varchar 128 PRODUCT_TYPE Product type of the device computed based on sysoid and version of main board. To get the main board version for devices, refer octet 28 of snChasMainBrdId MIB in foundry.mib.
H Database tables and fields TABLE 139 FOUNDRY_PHYSICAL_DEVICE (Continued) Field Definition Format Size SERIAL_NUMBER The serial number of the chassis. varchar 32 PRODUCT_TYPE Product type based on sysoid or architecture type and management module main board id. varchar 32 Size TABLE 140 FOUNDRY_PHYSICAL_PORT Field Definition Format PHYSICAL_PORT_ID Database ID of PHYSICAL_PORT instance. int CONNECTOR_TYPE The type of connector that the port offers.
H Database tables and fields TABLE 143 FRU (Continued) Field Definition Format Size PART_NUMBER provides the part number of the FRU element, requested by SMIA and values filled in by Switch Asset Collector.
H Database tables and fields TABLE 143 FRU (Continued) Field Definition Format CREATION_TIME provides the record creation time, standard columns for Management applciation and values filled in by Switch Asset Collector timestamp LAST_UPDATE_TIME provides the record creation time, standard columns for Management applciation and values filled in by Switch Asset Collector timestamp PREVIOUS_OP_STATUS provides the previous operational status of FRU element, requested by SMIA and values filled in b
H Database tables and fields TABLE 146 GIGE_PORT (Continued) Field Definition Format MAX_SPEED Port maximum speed supported. bigint MAC_ADDRESS MAC Address of that port. varchar 64 PORT_NAME GigE Port Name. varchar 64 OPERATIONAL_STATUS LED status. int LED_STATE LED status. smallint SPEED_LED_STATE GigE Port type details. smallint PORT_TYPE Port type for the GigE Port. varchar PERSISTENTLY_DISABLED Whether the GigE Port is persistently disabled.
H Database tables and fields TABLE 148 Definition Format TX Transmit (TX) value in bytes. double precision RX Receive (RX) value in bytes. double precision TX_UTILIZATION Transmit utilization (TX%) value in percentage. double precision RX_UTILIZATION Receive utilization (RX%) value in percentage. double precision DROPPED_PACKETS Number of dropped packets. double precision COMPRESSION The compression value. double precision LATENCY The latency value.
Database tables and fields TABLE 152 H HBA (Continued) Field Definition Format Size POWER_MODE Power mode of the HBA varchar 256 MODEL Model code of the HBA varchar 256 MODEL_DESCRIPTION Model description for the HBA varchar 256 OPERATING_STATUS Current operating status of the HBA: 1: Enabled/0: Disabled. The default value is 0. smallint CHIP_REVISION Revision level of the chip used in the HBA varchar 64 HARDWARE_PATH Hardware path for the HBA.
H Database tables and fields TABLE 152 1230 HBA (Continued) Field Definition Format Size TRUSTED Denotes whether HBA is trusted by user or not. When the host first time discovered, all the HBAs will be trusted by default. If any HBA added later, then it will be in untrusted stated. 0 denotes untrusted and 1 is for trusted. smallint CREATION_TIME HBA record creation time. This tells us when this HBA was first discovered. timestamp MISSING Denotes whether HBA is missing or not.
H Database tables and fields TABLE 152 HBA (Continued) Field Definition Format MAX_PCIF Maximum number of Pci functions. smallint CARD_MODE The mode that the card is operating on. smallint DRIVER_CARD_MODE It is the same as card type but uses new values applicable for 3.0 and later driver versions. Deprecates the card type field. Possible values are: • HBA/CNA/AnyIO/Mezzanine • HBA/Mezzanine CNA/Mezzanine AnyIO varchar 32 VENDOR Adapter vendor name.
H Database tables and fields TABLE 154 HBA_PORT (Continued) Field Definition Format CNA_PORT_ID Nullable foreign key, related FC pot with the CNA port int PORT_NWWN Node WWN for the HBA port varchar 23 PHYSICAL_PORT_WWN Physical Ports WWN in case of V port varchar 128 SWITCH_IP IP of the switch, HBA port is connected to varchar 23 PRINCIPAL_SWITCH_WWN WWN of the principal switch of the fabric, HBA is connected to varchar 128 HBA_ID HBA ID of the HBA this port belongs to int PORT
H Database tables and fields TABLE 155 HBA_PORT_DETAIL (Continued) Field Definition Format BOOT_TOPOLOGY Boot topology for the port. Possible values are 0 Point to Point , 1 - Loop. The default value is 1. int BOOTUP_DELAY On starting system how long system needs to wait for user action. Configured value ranges 0,1,2,5 and 10 minutes. Default value is 0. int BB_CREDIT The maximum number of receive buffer. The default value is 8. int FRAME_DATA_FIELD_SIZE The default value is 512.
H Database tables and fields TABLE 155 HBA_PORT_DETAIL (Continued) Field Definition Format Size TRANSMIT_BUFFER_CREDI T Transmitting buffer-to-buffer credits (BB_credits) for the port. varchar 64 FCSP_AUTH_STATE Indicates whether FC-SP authentication is on or off. The default value is 0. smallint FCSP_STATUS The status of FC-SP authentication. The default value is 'Disabled'. varchar 32 FCSP_ALGORITHM The configured authentication algorithm. The default value is 'MD5'.
H Database tables and fields TABLE 155 HBA_PORT_DETAIL (Continued) Field Definition Format Size FEC_STATE State of FEC. The FEC (Forward Error Correction) is an error recovery mechanism that allows the receiver of the corrupted frame to correct the error without referring back to the port which transmitted the frame. Supported on prowler card in FC mode. Applicable values are Online, Offline and Not Supported. Note : Not Supported on (PORT_MEDIA_MEZZANINE_CARD).
H Database tables and fields TABLE 157 HBA_PORT_FCOE_DETAILS (Continued) Field Definition Format MTU Maximum transmission unit in bytes of the FCoE port. Default - 2112, 0 - auto int PATH_TOV The value between 0 and 60 that specifies the time-out session.
H Database tables and fields TABLE 158 HBA_REMOTE_PORT (Continued) Field Definition Format Size STATE Indicates whether the device is online or offline. The default value is ‘Offline’. varchar 64 SUPPORTED_COS The types of classes that are supported on the remote port; for example, Class-3 varchar 32 DEVICE_TYPE The type of the device; for example, Disk or Tape. varchar 64 BIND_TYPE The persistent bind type. The default value is 0.
H Database tables and fields TABLE 158 HBA_REMOTE_PORT (Continued) Field TASK_RENTRY_IDENT_SUP PORT CONFIRMED_COMPLETION S_SUPPORT TABLE 159 Format The number of PRLI responses from the target to the initiator and begins when HBA Port starts FCP exchanges.Zero would mean unsupported and nonzero value implies supported. The default value is 0. int The number of confirmed completions on the remote port and begins when HBA Port starts FCP exchanges.
H Database tables and fields TABLE 160 HBA_TARGET (Continued) Field Definition Format TRUSTED Denotes whether target is trusted or not. 0 denotes untrusted and 1 is for trusted. smallint CREATION_TIME Creation time of the entry timestamp MISSING Flag to indicate if the remote LUN is missing. The default value is 0. smallint MISSING_TIME Time at which the LUN is marked missing. timestamp TARGET_ID The identifier of the target device as reported by each HBA port. The default value is 0.
H Database tables and fields TABLE 162 HOST_DISCOVERY_REQ_GROUP Field Definition Format ID Auto generated primary key int NAME Unique name for the host request. The default value is ‘ New Host Group'. varchar( Primary key from the host discovery options table. Points to the associated discovery options int Reflects the status of the request E.g. 0-> Completed, 1->Delete Pending. The default value is 0.
H Database tables and fields TABLE 165 INM_IP_INTERFACE (Continued) Field Definition SUBNET_MASK PRIMARY_IP TABLE 166 Format Size varchar 40 Indicates if the IP address is the primary IP address of the Interface. 1 - Primary 0 - Secondary.
H Database tables and fields TABLE 167 Field Definition Format ID Unique generated database identifier. serial DEPLOYMENT_ID Deployment configuration ID. Foreign Key for DEPLOYMENT table. int CLEAR_CONFIGURATION 1/0 corresponding to ''Clear Assignment'' / ''Assign Configuration'' for interface level configuration. smallint WRITE_TO_DEVICE 1/0 corresponding to Write to device/not write to device for outbound traffic. smallint BINDING_DIRECTION Represents the binding direction.
H Database tables and fields TABLE 170 IP_ROUTE (Continued) Field Definition Format Size NET_MASK Subnet Mask for the Route. varchar 64 GATEWAY Gateway for the Route. varchar 64 IP_ADDRESS IP Address created after ''”&”'' operation of gateway. varchar 64 METRIC Metric. int FLAG Flag. int CHECKSUM Check Sum. varchar GIGE_PORT_TYPE Whether the IP interface is created on a 10G cross port or not. Non-zero value denotes a cross port.
H Database tables and fields TABLE 173 Definition Format MISSING Denotes whether ISL link is missing or not. • 0 denotes present • 1 states that ISL is missing smallint MISSING_TIME States the missing time of the this ISL. timestamp TRUNKED Determines whether the isl is part of a trunk or not. The value of 0 means not trunked, 1 means this isl is part of a trunk and -1 means not applicable status. Default value is -1. smallint TABLE 174 Definition Format ID* Primary key for the table.
Database tables and fields TABLE 177 L2_ACL_DEVICE_DEPLOY_MAP Field Definition Format DEPLOYMENT_ID Deployment configuration ID. Foreign Key for DEPLOYMENT table. int L2_ACCESS_CONTROL_LIST_ID L2 Access control List ID for reference to the L2_ACCESS_CONTROL_LIST. Foreign Key for L2_ACCESS_CONTROL_LIST table. int TABLE 178 Size L2_ACL_INTERFACE_DEPLOY_MAP Field Definition Format ID Unique generated database identifier. serial DEPLOYMENT_ID Deployment configuration ID.
H Database tables and fields TABLE 180 Field Definition Format ID DB ID of LAG(Port-Channel).
H Database tables and fields TABLE 182 LAST_CONFIG_UPDATE_TIME Field Definition ID Primary key. MANAGED_ELEMENT_ID The managed element id of the device. This is the foreign key to MANAGED_ELEMENT table. int CONFIG_XPATH The xpath string. varchar LAST_UPDATE_TIME Timestamp returned by the device for this particular xpath. bigint TABLE 183 Format Size 1024 LAUNCH_IN_CONTEXT_MODULE Field Definition Format Size NAME Unique dialog name used as a module name when launching in context.
H Database tables and fields TABLE 184 Field Definition Format ID Unique Number assigned for the license information. int LICENSE_KEY License key string which has encoded value of number of products, ports licensed and package which this license isapplicable, etc. varchar 1024 SERIAL_NO Unique serial number string that helps to identify the customer or organization which this license is issued for.
H Database tables and fields TABLE 187 LICENSE_RULE Field Definition Format ID Unique generated database identifier. int NAME Name of the license rule varchar DESCRIPTION Description of the rule varchar SCOPE Scope of the rule - is it applicable to Fabric, switch or ports varchar CATEGORY Category of the rule - is it used by unknown - 0, asset collection - 1, or 2 - the license manager service smallint ENABLE Whether the rule needs to be considered or not.
H Database tables and fields TABLE 191 Field Definition Format ID* Unique generated database identifier. int BB_FABRIC_ID Backbone fabric DB ID. int FCR_FABRIC_ID FID assigned to edge fabric. int DEVICE_PORT_WWN Device port WWN of physical device. char 23 PHYSICAL_PID PID of physical device.
H Database tables and fields TABLE 196 MCT_CLIENT Field Definition Format MCT_CLIENT_ID MCT Client db ID. int RBRIDGE_ID MCT Client rbridge ID. int CLIENT_NAME MCT Client name. varchar PORT_ID MCT Client port foreign key. int OPER_STATE MCT Client operational state. smallint DEPLOY_STATE MCT Client deployment state: • Deployed(0) • Undeployed(1) smallint VCN_MEMBER_ID Virtual Cluster Node member Cluster id foreign key.
H Database tables and fields TABLE 201 Definition Format VIOLATION_TYPE The type of the violation. i.e. CRC, ITW. int MANAGED_ELEMENT_ID The managed element corresponding to this event. int ORIGIN_FABRIC_ID The fabric from which the event originated. Retaining this id as historical data. int SWITCH_PORT_ID Nullable foreign key. The FC port for which the event occurred. This will only be populated for port events. int FCIP_CIRCUIT_ID Nullable foreign key.
H Database tables and fields TABLE 204 MARCHING_ANTS Field Definition Format ID* Unique generated database identifier. int THRESHOLD1_VALUE The marching ants low boundary threshold value (T1). int THRESHOLD2_VALUE The marching ants high boundary threshold value (T2). int TABLE 205 Size MESSAGE_RECIPIENT Field Definition Format ID* Unique generated database identifier. int DESCRIPTION Description about recipient. varchar 256 IP_ADDRESS IP Address of the recipient.
H Database tables and fields TABLE 206 MODULE (Continued) Field Definition Format Size FW_REVISION The vendor-specific firmware revision string. Refer entPhysicalFirmwareRev of RFC4133-ENTITY-MIB.mib for more details. varchar 64 SW_REVISION The vendor-specific software revision string. Refer entPhysicalSoftwareRev of RFC4133-ENTITY-MIB.mib for more details.
Database tables and fields TABLE 211 H MPLS_LSP Field Definition Format MPLS_LSP_DB_ID Unique database generated identifier. int TABLE_SUBTYPE Refers to the subtype of the LSP where additional attributes/properties of different type of LSP stored. The possible values are MPLS_RSVP_LSP, MPLS_LSP. varchar 32 NAME Name of the Label Switched Path. varchar 255 DESTINATION_IP_ADDRESS Destination IP Address of the egress LSR associated with this tunnel instance.
H Database tables and fields TABLE 214 Definition Format METRIC Represents the metric of the LSP used by the routing protocols to determine the relative preference among several LSPs towards a given destination. Accepts a range of 1 - 65535. int PATH_SELECT_MODE Specifies the path selection mode to use. Refer mplsLspPathSelectMode MIB of foundry.mib for more details and possible values.
Database tables and fields TABLE 216 MPLS_RSVP_LSP_ADMIN_GROUP Field Definition Format MPLS_RSVP_LSP_ADMIN_GROUP Unique database generated identifier. _DB_ID int AFFINITY_TYPE Represents the affinity type of the MPLS Admin Group. Possible values are Unknown-0, Include Any-1, Include All-2 and Exclude Any-3. smallint MPLS_ADMIN_GROUP_DB_ID Database ID of the MPLS_ADMIN_GROUP Instance. int MPLS_RSVP_LSP_ADMIN_GROUP Database ID of the _CONTAINER_DB_ID MPLS_RSVP_LSP_ADMIN_GROUP_CONTAINER instance.
H Database tables and fields TABLE 219 Definition Format BFD_TRANSMIT This object specifies the minimum interval, in milliseconds, that the local system would like to use when transmitting The Bidirectional Forwarding Detection(BFD) Control packets. Accepts a range of 50-30000. int BFD_RECEIVE This object specifies the minimum interval, in milliseconds, between received Bidirectional Forwarding Detection (BFD) Control packets the local system is capable of supporting. Accepts a range of 50-30000.
H Database tables and fields TABLE 220 MPLS_RSVP_LSP_PATH (Continued) Field Definition Format MPLS_LSP_DB_ID Database ID of the MPLS_RSVP_LSP instance. int MPLS_PATH_DB_ID Database ID of the MPLS_PATH instance. int TABLE 221 MPLS_RSVP_LSP_TUNNEL_RESOURCE Field Definition Format MPLS_RSVP_LSP_TUNNEL_ Unique database generated identifier. RESOURCE_DB_ID int MAX_RATE Specifies the maximum data rate (kilo bits/secs) of the packet travelling over the LSP.
H Database tables and fields TABLE 223 Definition Format Size TABLE_SUBTYPE Specifies the type of MPLS Service Relation with Device. Possible values are VLL_DEVICE_RELATION and VPLS_DEVICE_RELATION. varchar 32 NAME Name of the MPLS Service. varchar 255 COS This value indicates the Class Of Service for this endpoint (VLL/VPLS). Allowed range is 0-7 and 255. 255 means COS is not explicitly configured. smallint MTU Represents the maximum packet size configured on the VLL/VPLS instance.
H Database tables and fields TABLE 225 MPLS_SERVICE_PEER_RELATION (Continued) Field Definition Format Size PEER_IP The IP of the Peer Device of the PW/PE maintenance protocol entity. varchar 255 OPER_STATUS Operational Status of the peer with the MPLS Service. Refer PwOperStatus MIB of foundry.mib for more details and possible values. smallint Field Definition Format MRP_RING_ID Auto generated database ID for MRP ring.
H Database tables and fields TABLE 227 Definition Format PRI_PORT_STATE State of device’s primary port. Other-1, Pre-Forwarding- 2, Forwarding-3, Blocking-4, Disabled-5. smallint PRI_PORT_TYPE Type of device’s primary port. Other-1, Regular port-2, Tunnel port-3. smallint PRI_PORT_ACTIVE_INTERFA CE_ID Interface database ID of an primary active port, which is sending RHPs. int SEC_PORT_INTERFACE_ID Interface database ID for the Secondary port of the device.
H Database tables and fields TABLE 230 NPORT_WWN_MAP Field Definition Format ID Unique generated database identifier. int VIRTUAL_SWITCH_ID AG switch reference on which the Nport wwn mapping resides. int N_PORT N Port through which AG is connected to the edge switch smallint DEVICE_PORT_WWN Device Port which is mapped to the N port. This device could be offline device as well. char 23 TABLE 231 Size OUI_GUESSED_DEVICE_MAP Field Definition Format Size OUI* Vendor OUI.
H Database tables and fields TABLE 233 Definition Format PHANTOM_TYPE The phantom type of the port, either front or xlate int BB_FABRIC_ID Denotes the Backbone Fabric ID. int TABLE 234 Size PHYSICAL_DEVICE Field Definition Format PHYSICAL_DEVICE_ID Unique generated database identifier. int DEVICE_ID Database identifier of the DEVICE instance. int DESCRIPTION System description of the device. varchar 255 NUM_SLOTS Number of slots present in the device.
H Database tables and fields TABLE 235 PHYSICAL_INTERFACE (Continued) Field Definition Format UNIT_NUMBER This is the unit number of which the interface is located for IP stacking products. If it is not applicable, the value is -1. int SLOT_NUMBER This is the slot number of which the interface is located for the devices and switches. If it is not applicable, the value is -1. int PORT_NUMBER This is the port number of the interface.
H Database tables and fields TABLE 238 Definition Format ME_ID ME_ID of the target. int INDEX_MAP Stores the index_map value in case of an expression. varchar TABLE 239 Size 8192 PM_COLLECTOR_TIME_SERIES_MAPPING Field Definition Format COLLECTOR_ID DB ID of the pm_data_collector. int TARGET_NAME Time series data master table name. It could be either TIME_SERIES_DATA_1 or TIME_SERIES_DATA_2.
H Database tables and fields TABLE 240 PM_DASHBOARD_WIDGET (Continued) Field Definition Format LEVEL3_ENABLED Enable / disable the third threshold check. This value is applicable only for Top N, Top Flow widgets. Default is 0. smallint LEVEL3_VALUE Limit value for the third percentage band. Default is 0. double precision LEVEL3_COLOR Limit value for the third percentage band. int LEVEL4_ENABLED Enable / disable the fourth threshold check.
H Database tables and fields TABLE 241 Definition Format POLLING_INTERVAL Time interval in seconds; indicates the frequency with which the collector will poll the device to get the data. int CREATED_TIME Collector created time. timestamp CREATE_USER_ID The user id who has created this collector. int ENABLE_THRESHOLD Widget definition created server time. smallint THRESHOLD Stores the threshold value. double precision REARM Stores the rearm value.
H Database tables and fields TABLE 243 PM_STATS_AGING_POLICY (Continued) Field Definition Format ONE_DAY_SAMPLE_AGE The maximum time in seconds for retaining records in the PM stats 1day sample tables (TIME_SERIES_DATA_1_1DAY, TIME_SERIES_DATA_2_1DAY) in database. int POLICY_TYPE Type of the aging policy. 100 is Default aging; 101 is Raw samples to 1 day. int ACTIVE State of the aging policy. 1 is Active, 0 is Inactive.
H Database tables and fields TABLE 248 Field Definition Format WIDGET_ID The ID of the widget definition. int COLLECTOR_ID ID of the PERF_COLLECTOR. int MEASURE_ID Measure table DB ID. int DIRECTION The direction of the port measure. 0 - default (not used) 1 - receiving 2 -transmitting smallint TABLE 249 Size PM_WIDGET_USER_ENTRY Field Definition Format WIDGET_ID The ID of the widget definition. int USER_ID ID of the user who is using the widget definition.
H Database tables and fields TABLE 251 POE_THRESHOLD_EVENT Field Definition Format ID Unique generated database identifier. serial TIME_STAMP This field indicates the time at which a particular threshold was triggered. bigint THRESHOLD_ID This is the foreign key reference key to the POE_THRESHOLD Table. int EVENT_VALUE Value of the measure at which threshold was triggered.
H Database tables and fields TABLE 254 Field Definition Format ID Primary key for the table. int DESCRIPTION User defined description of the CIMOM Server. varchar NETWORK_ADDRESS IPv4 or IPv6 address or Host name of the CIMOM server. varchar 64 CIM_NAMESPACE Name of the namespace where this CIM_FCPort CIM Class is located. varchar 256 PORT Port number which CIMOM server is listening. int SSL_ENABLED Protocol used for connecting CIMOM server. Default protocol will be HTTPS.
H Database tables and fields TABLE 256 PORT_FENCING_POLICY_MAP Field Definition Format ID* Unique generated database identifier. int POLICY_ID Foreign key to ID column of PORT_FENCING_POLICY table. int LEVEL • • • • • • • • • 0 = All Fabric 1 = Fabric 2 = Core Switch Group 3 = Switch 4 = Port Type 5 = Port List smallint 1 = E_Port 2 = F_Port 3 = FL_Port, Fabric WWN, Switch WWN char 23 WWN of Node which policy assigned. char 23 Directly assigned or inherited from root level.
H Database tables and fields TABLE 258 Field Definition Format ID Auto generated ID for the created profile int PROFILE_ID DB id of the port profile int SWITCH_ME_ID Managed element id of the cluster and its cluster members and a stand alone calisto int INTERFACE_ID ID of the interface table int SWITCH_PORT_ID Db id of the Switch port with matching interface int TABLE 259 Size PORT_PROFILE_MAC_MAP Field Definition Format ID Auto generated ID for the created profile int PROFILE_I
H Database tables and fields TABLE 261 PORT_PROFILE_QOS_PFC_MAP Field Definition Format COS1_RX RX setting for this cos field 0: NO 1: YES smallint COS2_TX TX setting for this cos field 0: NO 1: YES smallint COS3_TX TX setting for this cos field 0: NO 1: YES smallint COS3_RX RX setting for this cos field 0: NO 1: YES smallint COS4_TX TX setting for this cos field 0: NO 1: YES smallint COS4_RX RX setting for this cos field 0: NO 1: YES smallint COS5_TX TX setting for this cos field
H Database tables and fields TABLE 263 Definition Format ADMIN_STATUS • • smallint FCOE_ENABLED Signifies whether this VLAN is the default FCoE VLAN on the DCB switch. smallint Field Definition Format ID* Unique generated database identifier. int NAME Privilege Name. varchar AREA Privilege Area. 0= Application 1= SAN 2= IP smallint Field Definition Format ID* Unique generated database identifier. int MENU_TEXT Name of the product menu.
H Database tables and fields TABLE 267 QRTZ_BLOB_TRIGGERS Field Definition Format Size TRIGGER_NAME* Name of the trigger. varchar 80 TRIGGER_GROUP* Name of the trigger group. varchar 80 BLOB_DATA The Scheduler info. bytea TABLE 268 QRTZ_CALENDARS Field Definition Format Size CALENDAR_NAME* Name of the Calendar. varchar 80 CALENDAR Calendar object. bytea TABLE 269 QRTZ_CRON_TRIGGERS Field Definition Format Size TRIGGER_NAME* Name of the trigger.
H Database tables and fields TABLE 271 Definition Format Size JOB_CLASS_NAME The instance of the job that will be executed. varchar 128 IS_DURABLE Whether the job should remain stored after it is orphaned. boolean IS_VOLATILE Whether the job should not be persisted in the JobStore for re-use after program restarts. boolean IS_STATEFUL Whether the job implements the interface StatefulJob.
H Database tables and fields TABLE 276 QRTZ_SIMPLE_TRIGGERS (Continued) Field Definition Format size REPEAT_INTERVAL interval for first and second job num (13,0) TIMES_TRIGGERED Number of times the corresponding trigger fired num (13,0) TABLE 277 QRTZ_JTRIGGER_LISTENERS Field Definition Format Size TRIGGER_NAME* Name of the trigger. varchar 80 TRIGGER_GROUP* Name of the trigger group. varchar 80 TRIGGER_LISTENER* The listener action.
H Database tables and fields TABLE 281 Definition Format Size NAME Report name. varchar 128 DESCRIPTION Report type description. varchar 256 Size TABLE 282 RESOURCE_FABRIC_MAP Field Definition Format RESOURCE_GROUP_ID* Resource group ID. int FABRIC_ID* Fabric ID, which is in the resource group. int TABLE 283 RESOURCE_GROUP Field Definition Format ID* Unique generated database identifier. int NAME Resource group name. varchar 128 DESCRIPTION Resource group description.
H Database tables and fields TABLE 286 ROLE_PRIVILEGE_MAP (Continued) Field Definition Format PRIVILEGE_ID* Privilege ID. int PERMISSION Privilege permission: 1 = RO 2 = RW 0 = No privilege Default value is 0. smallint TABLE 287 Size SAN Field Definition Format ID* Unique generated database identifier. int NAME Name of this SAN. varchar 256 CONTACT Contact person for this SAN. varchar 256 LOCATION Location of this SAN. varchar 256 DESCRIPTION Description.
H Database tables and fields TABLE 288 Definition Format TRUSTED Indicates if the connection is trusted smallint MISSING Indicates if the connection is missing smallint MISSING_TIME Timestamp when the connection went missing timestamp LAST_UPDATE_TIME Last update time for this record timestamp CREATION_TIME Creation timestamp timestamp Field Definition Format ID Unique generated database identifier.
H Database tables and fields TABLE 290 SECURITY_POLICY (Continued) Field Definition Format SECURITY_ASSOC_LIFE Association lifetime in seconds. double precision SECURITY_ASSOC_LIFE_ IN_MB Security association lifetime in megabytes. double precision TABLE 291 SELECTED_FLYOVER_PROPERTY Field Definition Format PROPERTY_ID* Refers to Flyover_Property ID from AVAILABLE_FLYOVER_PROPERTY table. int USER_NAME* The name of the user who selected the property to be shown on flyover.
H Database tables and fields TABLE 292 Definition Format Size SERIAL_NUMBER provides the serial number of the sensor, requested by SMIA and values filled in by Switch Asset Collector will be available only from FOS 6.4 switches and above varchar 64 VERSION provides the version of the sensor, requested by SMIA and values filled in by Switch Asset Collector will be available only from FOS 6.
H Database tables and fields TABLE 294 SFLOW_HOUR_SUMMARY Field Definition Format IN_PORT Port number of the incoming traffic interface. smallint OUT_UNIT Unit number of the outgoing traffic interface. Default value is 0. smallint OUT_SLOT Slot number of the outgoing traffic interface. smallint OUT_PORT Port number of the outgoing traffic interface. smallint IN_VLAN Vlan ID of the incoming traffic interface. smallint OUT_VLAN Vlan ID of the outgoing traffic interface.
H Database tables and fields TABLE 294 Definition Format FRAMES Number of frames transmitted through the sFlow sample collected. bigint BYTES Number of bytes transmitted through the sFlow sample collected. bigint TCP_FLAGS TCP flag value of the received sFlow packet. smallint IN_PORT_TYPE smallint This column is used to store the port type of the incoming traffic interface. For VCS switch the value of • 0 means its edge port. • 1 means its trill port. For other devices Default value is 0.
H Database tables and fields TABLE 296 SFLOW_MINUTE_BGP (Continued) Field Definition Format IN_PORT_TYPE Port type of the incoming traffic interface. For VCS member the value of, • 0 means its edge port. • 1 means its fabric port. For other devices Default value is 0. smallint OUT_PORT_TYPE Port type of the outgoing traffic interface. For VCS member the value of, • 0 means its edge port • 1 means its fabric port. For other devices Default value is 0.
H Database tables and fields TABLE 298 Definition Format SRC_MAC MAC address of the Source in the received sFlow packet. bytea DEST_MAC MAC address of the destination in the received sFlow packet. bytea TABLE 299 Definition Format MAX_SLNUM Maximum row count. bigint Size SFLOW_MINUTE_MAC Field Definition Format SLNUM This column is used to store a counter value to identify the total row count. bigserial TIME_IN_SECONDS Data collection time in seconds.
H Database tables and fields TABLE 302 SFLOW_MINUTE_SUMMARY Field Definition Format SLNUM This column is used to store a counter value to identify the total row count. bigserial TIME_IN_SECONDS Data collection time in seconds. int DEVICE_ID ID of the product which sends the sflow traffic. int FRAMES Number of frames transmitted through the sflow sample collected. bigint BYTES Number of bytes transmitted through the sflow sample collected.
H Database tables and fields TABLE 304 Field Definition Format MAX_SLNUM Maximum row count. bigint TABLE 305 Definition Format SFLOW_REPORT_L3_SOURCE_ID Primary key autogenerated ID. int REPORT_DEFINITION_ID Report definition ID. int ADDRESS_GROUP_ID ACL network group IDs mapped with a report definition. int IP_SUBNET_DEFINITION_ID Subnet IDs mapped with a Report definition.
H Database tables and fields TABLE 307 SFLOW_STAGING (Continued) Field Definition Format L3_SRC_ADDR L3 address of the source in the received sFlow packet. bytea L3_DEST_ADDR L3 address of the destination in the received sFlow packet. bytea L3_PROTOCOL L3 protocol value in the received sFlow packet. For example, ARP. int IP_TOS Type of service ID in the received sFlow packet. smallint L4_PROTOCOL L4 protocol value in the received sFlow packet. For example, IGP.
H Database tables and fields TABLE 308 SFLOW_STAGING_SLNUM Field Definition Format MIN_SLNUM Maximum row count. bigint Definition Format TABLE 309 SLOT Field Size SLOT_ID int PHYSICAL_DEVICE_ID int CORE_SWITCH_ID int SLOT_NUM num (4,0) Size TABLE 310 1292 Size SMART_CARD Field Definition Format ID Unique generated database identifier. int CARD_TYPE Indicates how this smart card is configured: 0 = authorization card. The default value is 0.
H Database tables and fields TABLE 311 SMIA_SAN_NAME Field Definition Format Size NAME 'This will be the principal switch WWN of the fabric.'; varchar 24 ELEMENT_NAME User friendly name to identify the SAN varchar 32 IS_PRIMARY_FABRIC This value will indicate whether principal switch WWN has primary ownership or not. In case of simple FC fabric, the value will be always 1.
H Database tables and fields TABLE 313 Definition Format Size WRITE_COMMUNITY_ STRING The SNMP Write-Only Community String is like a password. It is sent along with each SNMP Set-Request and allows (or denies) access to a device. The default value is "private". This is applicable if the agent is configured to operate in SNMPv1. varchar 64 USER_NAME A human readable string representing the name of the user. This is applicable if the agent is configured to operate in SNMPv3.
H Database tables and fields TABLE 314 SNMP_DATA (Continued) Field Definition Format COLLECTOR_ID Correspoding collector table ID. int MIB_INDEX Index value for a MIB varaible. For scalar value it will be empty. varchar 256 Size TABLE 315 Size SNMP_DATA_1DAY Field Definition Format ID Primary key autogenerated ID. int MIB_OBJECT_ID The DB ID of MIB_OBJECT.
H Database tables and fields TABLE 317 SNMP_DATA_30MIN (Continued) Field Definition Format VALUE Value collected by the engine double precision TIME_IN_SECONDS Time at which collection occured in seconds int COLLECTOR_ID DB Id of the collector object used for collection int MIB_INDEX MIB index used for collection if applicable char 256 Size TABLE 318 SNMP_EXPR_DATA Field Definition Format ID Primary key column. serial EXPRESSION_ID MIB object ID.
H Database tables and fields TABLE 320 SNMP_EXPR_DATA_2HOUR (Continued) Field Definition Format TARGET_TYPE smallint TARGET_ID int VALUE double precision TIME_IN_SECONDS int COLLECTOR_ID int TABLE 321 SNMP_EXPR_DATA_30MIN Field Definition Format ID Primary key autogenerated ID int EXPRESSION_ID DB ID of the expression object used for collection int TARGET_TYPE Target/Source type can be device:0 or interface/ports:1' smallint TARGET_ID DB Id of the target which can be device o
H Database tables and fields TABLE 323 1298 SNMP_PROFILE (Continued) Field Definition Format Size RETRY_COUNT Number of times to retry if get/set request to the SNMP agent times out. Default value is 3. smallint TIMEOUT Timeout value in seconds before for a get/set request to the SNMP agent. Default value is 5. smallint VERSION SNMP agent version running on the switch as in SNMPv1 and SNMPv3 varchar 6 READ_COMMUNITY_STRING The SNMP Read-Only Community String is like a password.
H Database tables and fields TABLE 324 SOURCE_OBJECT_TYPE Field Definition Format ID* Unique generated database identifier. int TYPE_NAME Type of the object to which the event applies, such as Fabric, Switch or Port. char 64 DESCRIPTION Description of the object varchar 255 Size TABLE 325 SSL_CERTIFICATE_VIP_SERVER_MAP Field Definition Format SSL_CERTIFICATE_ID Foreign key to SSL_CERTIFICATE_ID in ssl_certificate table int VIP_SERVER_ID The column holds ID of VIP Server.
H Database tables and fields TABLE 327 STATS_AGING (Continued) Field Definition Format POLICY_TYPE The type of the aging ploicy. • 100 - Default aging (1 day 5 mins samples, 3 days 30 mins samples,7 days 2 hrs sample and 2 years 1 day samples) • 101 - 5 mins to 1 day aging(8 days 5 mins samples and 90 days of 1 day samples) smallint ACTIVE The active state of the policy.
H Database tables and fields TABLE 330 SWITCH_BOTTLENECK_CONFIG Field Definition Format LATENCY_SEVERITY The factor by which throughput must drop in a second in order for that second to be considered affected by latency bottlenecking. Range (1 to 1000). int LATENCY_TIME The minimum fraction of a second that must be affected by latency in order for that second to be considered affected by latency bottlenecking. Range (0 to 1).
H Database tables and fields TABLE 333 Definition Format Size PRODUCT_FAMILY This represents the product family that each OID belongs to. varchar 128 BRIEF_PRODUCT_FAMILY Shorter name for the product family. varchar 32 SPEED Switch max speed. Value 0 represents NotAvailable. smallint MULTI_CP_CAPABLE Switch is multi cp cabable or not. 0 means single CP and 1 means multi. smallint MIN_IMAGE_VERSION Supported min firmware version.
H Database tables and fields TABLE 334 SWITCH_PORT (Continued) Field Definition Format Size LOCKED_PORT_TYPE Indicates the locked port type of the port. Ports can be locked down so that they can come up only in that mode. varchar 16 CATEGORY Denotes the category of the switch. 1 denotes FC port and 2 denotes gige port. smallint PROTOCOL The protocol used by the port. FC, FCIP etc. varchar 16 SPEED Actual speed at which the port is currently operating.
H Database tables and fields TABLE 334 1304 SWITCH_PORT (Continued) Field Definition Format Size RATE_LIMITED Denotes if the port has Rate Limiting Enabled. smallint QOS_CAPABLE Indicates if the port is QOS capable. smallint QOS_ENABLED Indicates if the port is QOS enabled. smallint TUNNEL_CONFIGURED Denotes if the port has a fcip tunnel configured. smallint FCIP_TUNNEL_UP Denotes if the fcip tunnel that is configured is up. smallint FCR_FABRIC_ID Stores the FCR fabric ID.
H Database tables and fields TABLE 334 SWITCH_PORT (Continued) Field Definition Format LATENCY_DETECT_SUPPOR TED Whether the port supports latency detection. 1 means true and 0 means false smallint PREVIOUS_STATE Fields copies the old state of the port . The field could be used to track the state change information for the switch port . SwitchAssetCollector sets this field during the collection time.
H Database tables and fields TABLE 334 Definition Format FEATURES_ENABLED Holds as a bit mask the features that are enabled . Refer FEATURES_ACTIVE for the active/inactive status of a feature. Each bit would represent features like Encryption, compression etc.' The bit mask and their corresponding Features are defined as an enum in the domain model class - SwitchPort.java. int FEATURES_ACTIVE Holds as a bit mask the features that are active.
H Database tables and fields TABLE 335 SWITCH_TE_PORT_PERFORMANCE (Continued) Field Definition CRC_ERRORS double The total number of packets received that had a precision length (excluding framing bits, but including FCS octets) of between 64 and 1518 octets, inclusive, but had either a bad Frame Check Sequence (FCS) with an integral number of octets (FCS Error) or a bad FCS with a non-integral number of octets (Alignment Error) ALIGNMENT_ERRORS 'The number of frames detected that contain partial o
H Database tables and fields TABLE 336 SWITCH_TE_PORT_STATS (Continued) Field Definition Format ACTIVE_STATE Used for error scenario. smallint RECEIVE_EOF Total number of frames received at this port double precision UNDERFLOW_ERRORS Internal error. A normal ratio of this counter to the Transmit OK counter is 1% or less. double precision OVERFLOW_ERRORS Internal error. A normal ratio of this counter to the Transmit OK counter is 1% or less.
H Database tables and fields TABLE 337 SWITCH_TE_PORT_STATS_2HR (Continued) Field Definition Format double precision RECEIVE_OK_PERCENT_UTI L CREATION_TIME timestamp ACTIVE_STATE smallint RECEIVE_EOF double precision UNDERFLOW_ERRORS double precision OVERFLOW_ERRORS double precision CRC_ERRORS double precision ALIGNMENT_ERRORS double precision RUNT_ERRORS double precision EXCESS_COLL_ERRORS double precision EXCESS_FCTRL_ERRORS double precision LOST_FCTRL_ERRORS double precision
H Database tables and fields TABLE 338 SWITCH_TE_PORT_STATS_30MIN (Continued) Field Format ACTIVE_STATE smallint RECEIVE_EOF double precision UNDERFLOW_ERRORS double precision OVERFLOW_ERRORS double precision CRC_ERRORS double precision ALIGNMENT_ERRORS double precision RUNT_ERRORS double precision EXCESS_COLL_ERRORS double precision EXCESS_FCTRL_ERRORS double precision LOST_FCTRL_ERRORS double precision TOO_LONG_ERRORS double precision DATA_GAPS_IN_5MIN smallint TABLE 339 Siz
H Database tables and fields TABLE 341 SYSTEM_PROPERTY Field Definition Format Size NAME* The name of the property. char 64 VALUE The value for the property. varchar 2048 Field Definition Format Size ID Unique generated database identifier. serial TYPE Type of the target device.
H Database tables and fields TABLE 345 Definition Format TARGET_ID Target ID of the PM collector data. For device level collector it will use deviceId, for port level it will use interfaceId. int COLLECTOR_ID ID of the data_collector. int MEASURE_INDEX 'Stores the index_map value in case of anexpression. varchar ME_ID ME_ID of the target. int VALUE 30 mins aggregated data.
H Database tables and fields TABLE 348 \ TIME_SERIES_DATA_30MIN Field Definition Format TIME_IN_SECONDS Time when the record is inserted. int TARGET_TYPE Target type of the PM collector data. For device level collector the target type is 0, for port level it is 1. smallint MEASURE_ID ID of the measure. int TARGET_ID Target ID of the PM collector data. For device level collector it will use deviceId, for port level it will use interfaceId. int COLLECTOR_ID ID of the data_collector.
H Database tables and fields TABLE 350 Field Definition Format TIME_IN_SECONDS Time when value of the measure retrieved from the corresponding target. int TARGET_TYPE Target type of the PM collector data. For IP_DEVICE(0), IP_PORT(1), IP_TRUNK(2), FOS_DEVICE(3), FC_PORT(4), GE_PORT(5), TE_PORT(6), HBA_PORT(7), CNA_PORT(8), VIRTUAL_FCOE_PORT(9), FCIP_TUNNEL(10), EE_MONITOR(11), IP_DEVICE_GROUP(12), IP_PORT_GROUP(13), VIRTUAL_GROUP(14), TRILL_TRUNK(15), ALL_SAN_PRODUCTS(16).
H Database tables and fields TABLE 351 TIME_SERIES_DATA_1_2HOUR (Continued) Field Definition Format VALUE Stores the 2 hours aggregated data. double precision MIN_VALUE Minimum value in 30 min table while aggregating 2 hours of data. double precision MAX_VALUE Maximum value in 30 min table while aggregating 2 hours of data.
H Database tables and fields TABLE 353 Field Definition Format TIME_IN_SECONDS Time when value of the measure retrieved from the corresponding target. int TARGET_TYPE Target type of the PM collector data. For IP_DEVICE(0), IP_PORT(1), IP_TRUNK(2), FOS_DEVICE(3), FC_PORT(4), GE_PORT(5), TE_PORT(6), HBA_PORT(7), CNA_PORT(8), VIRTUAL_FCOE_PORT(9), FCIP_TUNNEL(10), EE_MONITOR(11), IP_DEVICE_GROUP(12), IP_PORT_GROUP(13), VIRTUAL_GROUP(14), TRILL_TRUNK(15), ALL_SAN_PRODUCTS(16).
H Database tables and fields TABLE 354 TIME_SERIES_DATA_2_1DAY (Continued) Field Definition Format MIN_VALUE Minimum value in 2 hour table while aggregating 1 day data. double precision MAX_VALUE Maximum value in 2 hour table while aggregating 1 day data. double precision TABLE 355 Size TIME_SERIES_DATA_2_2HOUR Field Definition Format TIME_IN_SECONDS Time when value of the measure retrieved from the corresponding target. int TARGET_TYPE Target type of the PM collector data.
H Database tables and fields TABLE 356 Field Definition Format TIME_IN_SECONDS Time when value of the measure retrieved from the corresponding target. int TARGET_TYPE Target type of the PM collector data. For IP_DEVICE(0), IP_PORT(1), IP_TRUNK(2), FOS_DEVICE(3), FC_PORT(4), GE_PORT(5), TE_PORT(6), HBA_PORT(7), CNA_PORT(8), VIRTUAL_FCOE_PORT(9), FCIP_TUNNEL(10), EE_MONITOR(11), IP_DEVICE_GROUP(12), IP_PORT_GROUP(13), VIRTUAL_GROUP(14), TRILL_TRUNK(15), ALL_SAN_PRODUCTS(16).
H Database tables and fields TABLE 359 TOPO_MAP_IMAGE Field Definition Format ID Unique generated database identifier. int NAME Image name in the foo.png format varchar IMAGE_OBJECT 'Image Object BLOB bytea Field Definition Format ID Unique generated database identifier. int CLUSTER_ME_ID The Management Element ID of the VCS Cluster in the VirtualSwitch int SOURCE_ME_ID The Management Element ID of the source VirtualSwitch.
H Database tables and fields TABLE 361 TRILL_TRUNK_GROUP (Continued) Field Definition Format ME_ID The Management Element ID of the VCS member in the VirtualSwitch int MASTER_PORT_NUMBER The master port represented as a tuple of member/slot/port varchar 30 Format Size TABLE 362 TRILL_TRUNK_MEMBER Field Definition GROUP_ID int PORT_NUMBER TABLE 363 The source port represented as a tuple of member/slot/port varchar 30 TRUNK_GROUP_INTERFACE Field Definition Format INTERFACE_ID VL
H Database tables and fields TABLE 365 USER_ (Continued) Field Definition Format LOCKED_OUT_DATETIME The date time stamp when a user got locked out because of exceeding max number of invalid login attempts. timestamp STATUS User’s account status: • 0=Disabled • 1=Enabled Default value is 1. smallint To identify the source for creating the user account. 0= User created through Management applciation Client • 1= User created when authenticated through external server.
H Database tables and fields TABLE 367 Field Definition Format Size USER_NAME * User name whose preferences are saved. It corresponds to user_name in USER_table. varchar 128 CATEGORY * The name for a set of related preferences. varchar 128 CONTENT The set of preferences saved as name-value pairs.
H Database tables and fields TABLE 372 VCN_ICL Field Definition Format VCN_ICL_ID Virtual Cluster Node ICL DB ID. int ICL_NAME ICL name. varchar ICL_PORT_ID ICL port foreign key. int VCN_MEMBER_ID Virtual Cluster Node member id foreign key. int Field Definition Format VCN_MEMBER_ID Virtual Cluster Node member db id. int CLUSTER_ID Cluster id. int CLUSTER_NAME Cluster name. varchar CLUSTER_RBRIDGE_ID Cluster rbridge id. int SESSION_VLAN Session VLAN id.
H Database tables and fields TABLE 374 VCN_PEER Field Definition Format Size ACTIVE_MEMBER_VLAN_RA Cluster Peer Active member VLAN range. NGE varchar 256 PEER_OPER_STATE Cluster Peer operational state. smallint PEER_DOWN_REASON Cluster Peer down reason. int PEER_UP_TIME Cluster Peer up time. int VCN_MEMBER_ID Virtual Cluster Node member id foreign key. int PEER_DEVICE_ID Peer device id.
H Database tables and fields TABLE 377 VIP_SERVER Field Definition Format ID Primary Key field for the VIP_SERVER int TYPE Even Policy Type smallint • • Size 0? Virtual Server 1 ? Real Server DEVICE_ID This is the foreign key reference key to the Device Table int IP_ADDRESS The IP Address for the Virtual Server or Real Server varchar 128 NAME The Name of Virtual Server or Real Server varchar 256 TABLE 378 VIP_SERVER_BINDING Field Definition Format ID Primary Key field for th
H Database tables and fields TABLE 379 Definition Format DEVICE_COUNT The number of devices associated with this Virtual FCoE Port. The default value is 0. smallint PEER_MAC The Peer FCF MAC if this Virtual FCoE Port is a FCoE VE-port varchar TABLE 380 Size VIRTUAL_FCOE_PORT_MAC_MEMBER Field Definition Format VIRTUAL_FCOE_PORT_ID The unique id of virtual fcoe port the member belongs to int MAC_ADDRESS Mac address of member.
H Database tables and fields TABLE 381 VIRTUAL_FCOE_PORT_STAT (Continued) Field Definition Format INVALID_TX Invalid transmissions double precision CRC_ERRORS Cyclic Redundancy check error double precision TABLE 382 Size VIRTUAL_FCOE_PORT_STAT_2HR Field Definition Format ID Unique generated database identifier.
H Database tables and fields TABLE 382 VIRTUAL_FCOE_PORT_STAT_2HR (Continued) Field Definition DATA_GAPS_5MIN DATA_GAPS_30MIN TABLE 383 Size smallint Data gap in 30 minutes table smallint VIRTUAL_FCOE_PORT_STAT_30M Field Definition Format ID Unique generated database identifier.
H Database tables and fields TABLE 384 VIRTUAL_PORT_WWN_DETAILS Field Definition ID Unique generated database identifier. SWITCH_ID If the VPWWN is constructed based on AG Node WWN and AG_Port_Index then this is id of connected switch. int SWITCH_PORT_NUMBER If the VPWWN is configured for AG , this value will have the default value(-1). smallint AG_NODE_WWN If the VPWWN is configured for Switch Port , this value will have the default value.
H Database tables and fields TABLE 385 VIRTUAL_SWITCH (Continued) Field Definition Format Stores the switch capability for Admin domain. 1 is capable 0 is not capable. smallint FABRIC_IDID_MODE Denotes if Insistent Domain ID mode is enabled. smallint OPERATIONAL_STATUS Stores the operational status of the switch. varchar MAX_ZONE_CONFIG_SIZE Denotes the maximum supported zone DB size in bytes. int CREATION_TIME Creation time of the record.
H Database tables and fields TABLE 385 VIRTUAL_SWITCH (Continued) Field Definition Format L3_CAPABLE If the switch supports L3. smallint LF_ENABLED Logical Fabric Enabled/Disabled for a Virtual Switch. Default value is 0. smallint DEFAULT_LOGICAL_SWITCH Check to see whether virtual switch is a default logical switch or not. 1 is true and 0 is false. Default value is 0. smallint FEATURES_SUPPORTED Contains the features supported as a bit mask. Default value is 0.
H Database tables and fields TABLE 385 1332 VIRTUAL_SWITCH (Continued) Field Definition Format MAX_FCIP_TUNNELS The maximun number of tunnels that can be created in this switch,-1 means not supported. Default value is -1. int MAX_FCIP_CIRCUITS The maximun number of circuits that can be created in this switch, -1 means not supported. Default value is -1. int FCIP_LICENSED FCIP Advanced Extension Licensing is available. 1 means licensed and 0 means not licensed, -1 means not supported.
H Database tables and fields TABLE 385 VIRTUAL_SWITCH (Continued) Field Definition CLUSTER_TYPE smallint This column is used to determine whether VCS is in Fabric Cluster or Management Cluster. The values will be populated by the VCS collector during the discovery of the VCS switch. The default value of -1 means that its a non VCS device.
H Database tables and fields TABLE 389 Field Definition Format VLAN_DB_ID Unique database generated identifier. int DEVICE_ID Database ID of the DEVICE instance which is associated with the vlan. int NAME Name for vlan. varchar 32 TABLE_SUBTYPE Table subtype possible value is VLAN. varchar 32 Size TABLE 390 Definition Format VLAN_INTERFACE_RELATION_ID Database ID of the VLAN_INTERFACE_RELATION instance which is associated with the dynamic interface member.
H Database tables and fields TABLE 395 VLL_DEVICE_RELATION Field Definition Format MPLS_SERVICE_DEVICE_RELATI ON_DB_ID Database ID inherited from MPLS_SERVICE_DEVICE_RELATION. int VLL_DEVICE_RELATION.VLL_MO DE Represents the VLL mode. Possible values are Unknown-0, Raw-1 and Taggged-2. int TABLE 396 VLL_ENDPOINT_RELATION Field Definition Format MPLS_SERVICE_ENDPOINT_REL ATION_DB_ID Database ID inherited from MPLS_SERVICE_ENDPOINT_RELATION.
H Database tables and fields TABLE 397 Definition Format Size VCENTER_HOST The FQDN or the ip address of the vcenter. varchar 256 VNIC_MACS Comma separated vnic mac addresses. varchar 256 START_TIME Start time of the vmotion event. timestamp END_TIME End time of the vmotion event, could be null cause of a failed vmotion. timestamp STATUS VMotion event status. 0 = info, 1 = warning, 2 = failed. smallint DRS_TRIGGERED Identifies whether the events was due to DRS. 0 = No, 1 = Yes.
H Database tables and fields TABLE 400 VM_DATASTORE_DETAILS Field Definition Format ID Primary key. int DATACENTER_ID Foreign to vm_data_center. int NAME Name of the datastore. varchar ACCESSIBLE The connectivity status of this datastore. If this is set to false, meaning the datastore is not accessible, this datastores capacity and freespace properties cannot be validated. 0 = no 1 = yes. smallint STATUS Status of the datastore could be normal, enteringMaintenance, inMaintenance.
H Database tables and fields TABLE 401 Definition Format CONFLICT Whether the port is a conflict port. A port could be marked as conflict if an entity is discovered connecting to a port that is already occupied, or if the port is created by the host without conferring with Virtual Center Server. A conflict port will not have its runtime state persisted and the port can''t move away from the host, i.
H Database tables and fields TABLE 402 VM_DV_PORT_GROUP (Continued) Field Definition Format Size DESCRIPTION A description string of the portgroup varchar 256 UPLINK_PORT_GROUP Whether this portgroup is an uplink portgroup smallint KEY The key for the port group varchar MOR_ID The managed object reference number assigned by the hypervisor int TABLE 403 64 VM_DV_SWITCH Field Definition Format ID Unique generated database identifier. serial UUID The generated UUID of the switch.
H Database tables and fields TABLE 403 Definition Format DVS_OPER_SUPPORTED Whether this switch allow Virtual Center users to modify DVS configuration at switch level, except for host memeber, policy and scope operations smallint CREATION_TIME The create time of the switch timestamp UPLINK_PORT_NAME The uniform name of uplink ports on each host varchar VM_DATA_CENTER_ID A foreign key referencing VM_DATACENTER table instance to which this host is associated with int MOR_ID The managed objec
H Database tables and fields TABLE 405 VM_FC_HBA (Continued) Field Definition Format The type of the fiber channel port. One of : Fabric Loop Point to point Unknown smallint SPEED The current operating speed of the adapter in bits per second.
H Database tables and fields TABLE 407 VM_HOST (Continued) Field Definition Format Size CPU_TYPE Text summary of CPU hardware, such as: Intel(R) Xeon(TM) CPU 2.6 GHz varchar 64 CPU_RESOURCES Text summary of CPU resources, such as "20 GHz total, 15 GHz reserved". May be a different format for different VM vendors varchar 64 MEM_RESOURCES Text summary of memory resources, such as "7 GB total, 5 GB reserved".
H Database tables and fields TABLE 409 VM_HOST_PROXY_SWITCH (Continued) Field Definition Format Size DVS_NAME The name of the DistributedVirtualSwitch that the HostProxySwitch is part of varchar 256 DVS_UUID The uuid of the DistributedVirtualSwitch that the HostProxySwitch is a part of varchar 256 KEY_ The proxy switch key varchar 256 NUM_PORTS The number of ports that this switch currently has int NUM_PORTS_AVAILABLE The number of ports that are available on this virtual switch int
H Database tables and fields TABLE 411 Definition Format VM_DV_PORT_ID Foreign key to the vm_dv_port table. DV Port with which this vmknic is associated int MTU The MTU of the port int VM_HOST_ID FOREIGN KEY to the vm_host table int MOR_ID The managed object reference number assigned by the hypervisor int PORT_GROUP_KEY The key for the port group varchar BINARY_MAC MAC address in binary format. bytea BINARY_IP IP address in binary format.
H Database tables and fields TABLE 413 VM_NIC_TEAMING_POLICY (Continued) Field Definition Format REVERSE_POLICY The flag to indicate whether or not the teaming policy is applied to inbound frames as well. For example, if the policy is explicit failover, a broadcast request goes through uplink1 and comes back through uplink2. Then if the reverse policy is set, the frame is dropped when it is received from uplink2. This reverse policy is useful to prevent the virtual machine from getting reflections.
H Database tables and fields TABLE 414 Definition Format FABRIC_ID Identifies the fabric that contains this path. Not a foreign key reference. Copied here for convenience. Determined by locating the HBA port WWN or target port WWN in the DEVICE_PORT table. Zero if the fabric is not managed. The default value is 0. int HBA_PORT The HBAs physical port WWN for this path char 23 VM_PORT_WWN The initiator port WWN used by the VM.
H Database tables and fields TABLE 415 VM_PHYSICAL_NIC (Continued) Field Definition Format DUPLEX The flag to indicate whether or not the link is capable of full-duplex ("true") or only half-duplex ("false"). smallint MAC_ADDRESS The media access control (MAC) address of the physical network adapter. varchar 17 PCI Device hash of the PCI device corresponding to this physical network adapter. varchar 256 WAKE_ON_LAN_SUPPO RTED Flag indicating whether the NIC is wake-on-LAN capable.
H Database tables and fields TABLE 417 Field Definition Format ID Unique generated database identifier. serial NAME The name of the virtual switch. varchar PORTS_COUNT The number of ports that this virtual switch currently has. int PORTS_AVAILABLE The number of ports that are available on this virtual switch. int MTU The maximum transmission unit (MTU) associated with this virtual switch in bytes.
Database tables and fields TABLE 419 VM_STD_VSWITCH_PORT_GROUP (Continued) Field Definition Format VM_STANDARD_VIRTUA L__SWITCH_ID Foreign Key to the vm_standard_virtual_switch table. The standard virtual swtich on which this port group exists. int MOR_ID The managed object reference number assigned by the hypervisor. int TABLE 420 H Size VM_STORAGE Field Definition Format ID Uniquely identifies this LUN. serial HOST_ID Identifies the server that accesses this LUN.
H Database tables and fields TABLE 421 Field Definition Format VM_STORAGE_ID A foreign key referencing VM_STORAGE (ID). int HBA_REMOTE_PORT_ID A foreign key referencing HBA_REMOTE_PORT (ID). int TABLE 422 Size VM_TRAFFIC_SHAPING_POLICY Field Definition Format ID Unique generated database identifier. serial ENABLED 'The flag to indicate whether or not traffic shaper is enabled on the port.
H Database tables and fields TABLE 423 VM_VCENTER (Continued) Field Definition Format Size MANAGED_ELEMENT_ID A foreign key referencing MANAGED_ELEMENT(ID). int FAULT_MONITORING_ST ATE Flag to indicate whether fault monitoring is registered or not for a VM Host. Possible values are: 1.Not registered 2.Registered (Default) smallint NAME The name of the VCenter. varchar 64 UUID Unique identifier for vCenter server instance.
H Database tables and fields TABLE 425 1352 VM_VIRTUAL_ETHERNET_ADAPTER (Continued) Field Definition Format ADDRESS_TYPE MAC address type. Valid values for address type are: • Manual • Statically assigned MAC address. • Generated • Automatically generated MAC address. • Assigned • MAC address assigned by VirtualCenter. smallint MAC_ADDRESS MAC address assigned to the virtual network adapter. Clients can set this property to any of the allowed address types.
H Database tables and fields TABLE 426 VM_VIRTUAL_MACHINE Field Definition Format ID Uniquely identifies the virtual machine serial HOST_ID Identifies the server that contains this VM int HYPERVISOR_VM_ID The VM number assigned by the hypervisor. Some hypervisors identify VMs by number as well as by name int NAME User-assigned name for the VM varchar 80 DESCRIPTION Optional user-entered notes describing the VM. (Annotation in VMware terminology.
H Database tables and fields TABLE 426 Definition Format Size UNCOMMITTED_STORA GE Additional Provisioned storage for a particular virtual machine. varchar 64 UNSHARED_STORAGE Exclusive storage for a particular virtual machine. varchar 64 Size TABLE 427 VM_VIRTUAL_MACHINE_DATASTORE_MAP Field Definition Format VM_DATASTORE_DETAIL S_ID A foreign key referencing VM_DATASTORE_DETAILS(ID). int VIRTUAL_MACHINE_ID A foreign key referencing VM_VIRTUAL_MACHINE(ID).
Database tables and fields TABLE 430 H VR_CONN_DOMAIN Field Definition Format ID Unique generated database identifier. serial VCEM_PROFILE_ID Foreign key references the ID of the VCEM server that the domain belongs to. int VR_CONN_DOMAIN_GROUP_I D Nullable foreign key references the ID of the domain group that the domain may belong to. int VCEM_ASSIGNED_ID The ID assigned by the VCEM server.
H Database tables and fields TABLE 433 VR_CONN_MODULE Field Definition Format ID Unique generated database identifier. serial VR_CONN_DOMAIN_ID Foreign key references the domain ID that the module belongs to. int VCEM_ASSIGNED_ID The ID assigned by VCEM. varchar 256 WWN The WWN of the module. char 23 PRODUCT_NAME The product name of the module. varchar 256 SERIAL_NUMBER The serial number of the module. varchar 32 STATUS The current status of the module.
H Database tables and fields TABLE 435 VR_CONN_SERVER_PROFILE Field Definition Format ID Unique generated database identifier. serial VCEM_PROFILE_ID Foreign key references the ID of the VCEM server that the server profile belongs to. int VR_CONN_DOMAIN_GROUP_I D Nullable foreign key references the ID of the domain group that the server profile may belong to. int VCEM_ASSIGNED_ID The ID assigned by the VCEM server.
H Database tables and fields TABLE 438 Definition Format TYPE The zone type. int SUB_TYPE The zone subtype. int ACTIVATE For TI zones only, zone is activated. Default value is 0. smallint CONFIGURED_FAILOVER Configured Failover state of the TI Zone. smallint CONFIGURED_ACTIVATE Configured active state of the TI Zone. smallint ENABLED_FAILOVER Enabled Failover state of the TI Zone. smallint ENABLED_ACTIVATE Enabled Active state of the TI Zone.
H Database tables and fields TABLE 442 ZONE_DB (Continued) Field Definition Format Size CREATED_BY Created by user name. varchar 128 LAST_MODIFIED_BY Last modified by user name. varchar 128 LAST_APPLIED_BY Last saved to switch user name. varchar 128 DEFAULT_ZONE_STATUS All access or no access when no active zone configuration. smallint ZONE_TXN_SUPPORTED Zoning commands support transaction. smallint MCDATA_DEFAULT_ZONE McData switch default zoning mode.
H Views TABLE 446 ZONE_MEMBER (Continued) Field Definition Format Size VALUE Member value (D,P or WWN). varchar 256 ZONE_ID PK of owning zone. int Field Definition Format ID* Unique generated database identifier. int ZONE_DB_ID PK of owning zone DB. int NAME Zone set name. varchar ACTIVE 1 = active zone set 0 = otherwise. smallint TABLE 447 ZONE_SET Size 64 Views ADAPTER_PORT_CONFIG_INFO create or replace view ADAPTER_PORT_CONFIG_INFO as select ADAPTER_PORT_CONFIG.
Views H where ((AG_N_PORT.REMOTE_PORT_WWN = EDGE_F_PORT.WWN) or (AG_N_PORT.REMOTE_PORT_WWN = EDGE_F_PORT.LOGICAL_PORT_WWN and EDGE_F_PORT.TRUNK_MASTER = 1)) and AG_N_PORT.TYPE = 'N-Port'; BOOT_IMAGE_FILE_DETAILS_INFO create or replace view BOOT_IMAGE_FILE_DETAILS_INFO as select BOOT_IMAGE_FILE_DETAILS.BOOT_IMAGE_NAME, BOOT_IMAGE_FILE_DETAILS.MAJOR_VERSION, BOOT_IMAGE_FILE_DETAILS.MINOR_VERSION, BOOT_IMAGE_FILE_DETAILS.MAINTENANCE, BOOT_IMAGE_FILE_DETAILS.PATCH, BOOT_IMAGE_FILE_DETAILS.
H Views CNA_PORT_DETAILS_INFO create or replace view CNA_PORT_DETAILS_INFO as select CNA_PORT.ID, CNA_PORT.PORT_NUMBER, CNA_PORT.PORT_WWN, CNA_PORT.NODE_WWN, CNA_PORT.PHYSICAL_PORT_TYPE, CNA_PORT.NAME, CNA_PORT.MAC_ADDRESS, CNA_PORT.MEDIA, CNA_PORT.CEE_STATE, CNA_PORT.HBA_ID, CNA_PORT.CREATION_TIME as CNA_PORT_CREATION_TIME, CNA_ETH_PORT.ID as ETH_PORT_ID, CNA_ETH_PORT.ETH_DEV, CNA_ETH_PORT.ETH_LOG_LEVEL, CNA_ETH_PORT.NAME as ETH_PORT_NAME, CNA_ETH_PORT.MAC_ADDRESS as ETH_MAC_ADDRESS, CNA_ETH_PORT.
Views H CNA_ETH_PORT.CREATION_TIME as ETH_PORT_CREATION_TIME, HBA_PORT.DEVICE_PORT_ID, CNA_ETH_PORT.MTU, CNA_PORT.ALARM_WARNING from CNA_PORT left outer join HBA_PORT on CNA_PORT.ID = HBA_PORT.CNA_PORT_ID left outer join CNA_ETH_PORT on CNA_PORT.ID = CNA_ETH_PORT.CNA_PORT_ID; CORE_SWITCH_DETAILS_INFO create or replace view CORE_SWITCH_DETAILS_INFO as select CORE_SWITCH.ID, CORE_SWITCH.IP_ADDRESS, CORE_SWITCH.WWN, CORE_SWITCH.NAME, CORE_SWITCH.TYPE, CORE_SWITCH.MODEL, CORE_SWITCH.
H Views CORE_SWITCH_DETAILS.EGM_CAPABLE, CORE_SWITCH_DETAILS.SUB_TYPE, CORE_SWITCH_DETAILS.PARTITION, CORE_SWITCH_DETAILS.MAX_NUM_OF_BLADES, CORE_SWITCH_DETAILS.VENDOR_VERSION, CORE_SWITCH_DETAILS.VENDOR_PART_NUMBER, CORE_SWITCH_DETAILS.RNID_SEQUENCE_NUMBER, CORE_SWITCH_DETAILS.CONTACT, CORE_SWITCH_DETAILS.LOCATION, CORE_SWITCH_DETAILS.DESCRIPTION, CORE_SWITCH_DETAILS.IP_ADDRESS_PREFIX, CORE_SWITCH_DETAILS.DOMAIN_NAME, CORE_SWITCH_DETAILS.FRAME_LOG_SIZE, CORE_SWITCH_DETAILS.
Views H LUN.THIN_PROVISION_LUN from CRYPTO_LUN LUN, CRYPTO_HOST where LUN.CRYPTO_HOST_ID = CRYPTO_HOST.ID; CRYPTO_TARGET_ENGINE_INFO create or replace view CRYPTO_TARGET_ENGINE_INFO as select CRYPTO_TARGET_CONTAINER.ID TARGET_CONTAINER_ID, CRYPTO_TARGET_CONTAINER.NAME, CRYPTO_TARGET_CONTAINER.VT_NODE_WWN, CRYPTO_TARGET_CONTAINER.VT_PORT_WWN, CRYPTO_TARGET_CONTAINER.FAILOVER_STATUS, CRYPTO_TARGET_CONTAINER.FAILOVER_STATUS_2, CRYPTO_TARGET_CONTAINER.DEVICE_STATUS, CRYPTO_TARGET_CONTAINER.
H Views DEPLOYMENT_HANDLER.PRIVILEGE_ID, DEPLOYMENT_HANDLER.HANDLER_CLASS, DEPLOYMENT_HANDLER.CLIENT_ACTION_HANDLER_CLASS, DEPLOYMENT_STATUS.ID as STATUS_ID, DEPLOYMENT_HANDLER.MODULE_DISPLAYNAME, DEPLOYMENT_REPORT_TEMPLATE.HEADER, DEPLOYMENT_REPORT_TEMPLATE.FOOTER from DEPLOYMENT_CONFIGURATION join DEPLOYMENT_HANDLER on DEPLOYMENT_CONFIGURATION.DEPLOYMENT_HANDLER_ID = DEPLOYMENT_HANDLER.ID left outer join DEPLOYMENT_STATUS on (DEPLOYMENT_STATUS.DEPLOYMENT_TIME = (select max(DEPLOYMENT_STATUS.
Views H left outer join DEPLOYMENT_REPORT_TEMPLATE on DEPLOYMENT_REPORT_TEMPLATE.DEPLOYMENT_HANDLER_ID = DEPLOYMENT_HANDLER.ID; DEVICE_CONNECTION_INFO create or replace view DEVICE_CONNECTION_INFO as SELECT device_connection.id, device_connection.fabric_id, device_connection.device_port_id, device_connection.switch_port_id, device_connection.ag_port_id, COALESCE(device_enclosure_member.enclosure_id, hba.host_id) AS device_enclosure_id, device_connection.creation_time, device_connection.
H Views VIRTUAL_SWITCH.SWITCH_MODE, VIRTUAL_SWITCH.AD_CAPABLE, VIRTUAL_SWITCH.WWN, VIRTUAL_SWITCH.ROLE, VIRTUAL_SWITCH.FCS_ROLE, VIRTUAL_SWITCH.DOMAIN_ID, VIRTUAL_SWITCH.VIRTUAL_FABRIC_ID, VIRTUAL_SWITCH.BASE_SWITCH, VIRTUAL_SWITCH.MAX_ZONE_CONFIG_SIZE, VIRTUAL_SWITCH.CREATION_TIME, VIRTUAL_SWITCH.LAST_UPDATE_TIME, VIRTUAL_SWITCH.USER_NAME, VIRTUAL_SWITCH.PASSWORD, VIRTUAL_SWITCH.MANAGEMENT_STATE, VIRTUAL_SWITCH.STATE, VIRTUAL_SWITCH.STATUS, VIRTUAL_SWITCH.STATUS_REASON, VIRTUAL_SWITCH.
Views H VIRTUAL_SWITCH.FEATURES_ENABLED, VIRTUAL_SWITCH.MAPS_ENABLED_ACTIONS, FABRIC_MEMBER.FABRIC_ID, FABRIC_MEMBER.TRUSTED, FABRIC_MEMBER.MISSING, FABRIC_MEMBER.MISSING_TIME, FABRIC.MANAGED as FABRIC_MANAGED, FABRIC.PRINCIPAL_SWITCH_WWN, FABRIC.SEED_SWITCH_WWN, FABRIC.TYPE as FABRIC_TYPE from CORE_SWITCH, VIRTUAL_SWITCH, FABRIC_MEMBER, FABRIC where VIRTUAL_SWITCH.CORE_SWITCH_ID = CORE_SWITCH.ID and FABRIC_MEMBER.VIRTUAL_SWITCH_ID = VIRTUAL_SWITCH.ID and FABRIC_MEMBER.FABRIC_ID = FABRIC.
H Views SWITCH_PORT.NPIV, SWITCH_PORT.NPIV_CAPABLE, SWITCH_PORT.CALCULATED_STATUS, SWITCH_PORT.AREA_ID, SWITCH_PORT.PHYSICAL_PORT, SWITCH_PORT.CATEGORY, SWITCH_PORT.PERSISTENT_DISABLE, SWITCH_PORT.BLOCKED, SWITCH_PORT.FCR_INTEROP_MODE, SWITCH_INFO.IP_ADDRESS, SWITCH_INFO.PHYSICAL_SWITCH_WWN, SWITCH_INFO.FIRMWARE_VERSION, SWITCH_INFO.REACHABLE, SWITCH_INFO.SYSLOG_REGISTERED, SWITCH_INFO.SNMP_REGISTERED, SWITCH_INFO.ID as VIRTUAL_SWITCH_ID, SWITCH_INFO.NAME as VIRTUAL_SWITCH_NAME, SWITCH_INFO.
Views H and AG_SWITCH.MONITORED = 1; DEVICE_NODE_INFO create or replace view DEVICE_NODE_INFO as select DEVICE_NODE.ID, DEVICE_NODE.FABRIC_ID, DEVICE_NODE.WWN, DEVICE_NODE.TYPE, DEVICE_NODE.DEVICE_TYPE, DEVICE_NODE.SYMBOLIC_NAME, DEVICE_NODE.FDMI_HOST_NAME, DEVICE_NODE.VENDOR, DEVICE_NODE.CAPABILITY_, DEVICE_NODE.TRUSTED, DEVICE_NODE.CREATION_TIME, DEVICE_NODE.MISSING, DEVICE_NODE.MISSING_TIME, DEVICE_NODE.PROXY_DEVICE, DEVICE_NODE.AG, DEVICE_NODE.PREVIOUS_MISSING_STATE, USER_DEFINED_DEVICE_DETAIL.
H Views DEVICE_PORT.NUMBER, DEVICE_PORT.PORT_ID, DEVICE_PORT.TYPE, DEVICE_PORT.SYMBOLIC_NAME, DEVICE_PORT.FC4_TYPE, DEVICE_PORT.COS, DEVICE_PORT.IP_PORT, DEVICE_PORT.HARDWARE_ADDRESS, DEVICE_PORT.TRUSTED, DEVICE_PORT.CREATION_TIME, DEVICE_PORT.MISSING, DEVICE_PORT.MISSING_TIME, DEVICE_PORT.NPV_PHYSICAL, DEVICE_PORT.EDGE_SWITCH_PORT_WWN, DEVICE_PORT.LOGGED_TO_AG, DEVICE_PORT.AG_NODE_WWN, DEVICE_PORT.AG_N_PORT_WWN, FICON_DEVICE_PORT.TYPE_NUMBER, FICON_DEVICE_PORT.MODEL_NUMBER, FICON_DEVICE_PORT.
Views H left outer join VIRTUAL_SWITCH VS2 on VIRTUAL_FCOE_PORT.VIRTUAL_SWITCH_ID = VS2.ID left outer join FABRIC on DEVICE_NODE.FABRIC_ID = FABRIC.ID; DEV_PORT_GIGE_PORT_LINK_INFO create or replace view DEV_PORT_GIGE_PORT_LINK_INFO as select DEVICE_PORT_GIGE_PORT_LINK.DEVICE_PORT_ID, DEVICE_PORT_GIGE_PORT_LINK.GIGE_PORT_ID, DEVICE_PORT_GIGE_PORT_LINK.DIRECT_ATTACH, DEVICE_PORT_GIGE_PORT_LINK.VIRTUAL_FCOE_PORT_ID, DEVICE_PORT.TRUSTED, DEVICE_PORT.CREATION_TIME, DEVICE_PORT.MISSING, DEVICE_PORT.
H Views SOURCE_SWITCH_PORT.USER_PORT_NUMBER as SOURCE_PORT_NUMBER, SOURCE_SWITCH_PORT.TYPE as SOURCE_PORT_TYPE, SOURCE_VIRTUAL_SWITCH.VIRTUAL_FABRIC_ID as SOURCE_VIRTUAL_FABRIC_ID, DEST_SWITCH_PORT.VIRTUAL_SWITCH_ID as DEST_SWITCH_ID, DEST_SWITCH_PORT.USER_PORT_NUMBER as DEST_PORT_NUMBER, DEST_SWITCH_PORT.TYPE as DEST_PORT_TYPE, DEST_VIRTUAL_SWITCH.
Views H EVENT_DETAILS.CONTRIBUTORS as CONTRIBUTORS, EVENT_DETAILS.NODE_WWN as NODE_WWN, EVENT_DETAILS.PORT_WWN as PORT_WWN, EVENT_DETAILS.OPERATIONAL_STATUS as OPERATIONAL_STATUS, EVENT_DETAILS.FIRST_OCCURRENCE_SWITCH_TIME as FIRST_OCCURRENCE_SWITCH_TIME, EVENT_DETAILS.LAST_OCCURRENCE_SWITCH_TIME as LAST_OCCURRENCE_SWITCH_TIME, EVENT_DETAILS.VIRTUAL_FABRIC_ID as VIRTUAL_FABRIC_ID, EVENT_DETAILS.UNIT as UNIT, EVENT_DETAILS.SLOT as SLOT, EVENT_DETAILS.PORT as PORT, EVENT_DETAILS.OID, EVENT_DETAILS.
H Views EVENT_DETAILS.USER_NAME as USER_NAME, EVENT_DETAILS.PORT_NAME as PORT_NAME, EVENT_DETAILS.MAC_ADDRESS from EVENT left join EVENT_DETAILS on EVENT.ID = EVENT_DETAILS.EVENT_ID, EVENT_ORIGIN, EVENT_CATEGORY, EVENT_MODULE, EVENT_DESCRIPTION where EVENT.EVENT_ORIGIN_ID = EVENT_ORIGIN.ID and EVENT.EVENT_CATEGORY_ID = EVENT_CATEGORY.ID and EVENT.EVENT_MODULE_ID = EVENT_MODULE.ID and EVENT.EVENT_DESCRIPTION_ID = EVENT_DESCRIPTION.ID; FABRIC_INFO create or replace view FABRIC_INFO as select FABRIC.
Views H FCIP_TUNNEL_CIRCUIT.ID, FCIP_TUNNEL_CIRCUIT.TUNNEL_ID, FCIP_TUNNEL_CIRCUIT.CIRCUIT_NUMBER, FCIP_TUNNEL_CIRCUIT.COMPRESSION_ENABLED, FCIP_TUNNEL_CIRCUIT.TURBO_WRITE_ENABLED, FCIP_TUNNEL_CIRCUIT.TAPE_ACCELERATION_ENABLED, FCIP_TUNNEL_CIRCUIT.IKE_POLICY_NUM, FCIP_TUNNEL_CIRCUIT.IPSEC_POLICY_NUM, FCIP_TUNNEL_CIRCUIT.PRESHARED_KEY, FCIP_TUNNEL_CIRCUIT.SOURCE_IP, FCIP_TUNNEL_CIRCUIT.DEST_IP, FCIP_TUNNEL_CIRCUIT.VLAN_TAG, FCIP_TUNNEL_CIRCUIT.SELECTIVE_ACK, FCIP_TUNNEL_CIRCUIT.
H Views select FCIP_TUNNEL.ID, FCIP_TUNNEL.TUNNEL_ID, FCIP_TUNNEL.VLAN_TAG, FCIP_TUNNEL.SOURCE_IP, FCIP_TUNNEL.DEST_IP, FCIP_TUNNEL.LOCAL_WWN, FCIP_TUNNEL.REMOTE_WWN_RESTRICT, FCIP_TUNNEL.COMMUNICATION_RATE, FCIP_TUNNEL.MIN_RETRANSMIT_TIME, FCIP_TUNNEL.SELECTIVE_ACK_ENABLED, FCIP_TUNNEL.KEEP_ALIVE_TIMEOUT, FCIP_TUNNEL.MAX_RETRANSMISSION, FCIP_TUNNEL.WAN_TOV_ENABLED, FCIP_TUNNEL.TUNNEL_STATUS, FCIP_TUNNEL.DESCRIPTION, FCIP_TUNNEL.FICON_TRB_ID_ENABLED, FCIP_TUNNEL.FICON_TT_EMUL_ENABLED, FCIP_TUNNEL.
Views H PORT.ID as SWITCH_PORT_ID, PORT.PORT_NUMBER as SWITCH_PORT_NUMBER, PORT.USER_PORT_NUMBER as USER_PORT_NUMBER, PORT.PORT_INDEX, PORT.STATUS_MESSAGE from FCIP_TUNNEL left outer join FCIP_PORT_TUNNEL_MAP on FCIP_PORT_TUNNEL_MAP.TUNNEL_ID = FCIP_TUNNEL.ID left outer join SWITCH_PORT PORT on FCIP_PORT_TUNNEL_MAP.SWITCHPORT_ID = PORT.ID; FCOE_DEVICE_INFO create or replace view FCOE_DEVICE_INFO as select FCOE_DEVICE.DEVICE_NODE_ID, FCOE_DEVICE.DIRECT_ATTACH, FCOE_DEVICE.ATTACH_ID, FCOE_DEVICE.
H Views VIRTUAL_SWITCH.MANAGEMENT_STATE, VIRTUAL_SWITCH.MONITORED from FRU, CORE_SWITCH, VIRTUAL_SWITCH where FRU.CORE_SWITCH_ID = CORE_SWITCH.ID and FRU.CORE_SWITCH_ID = VIRTUAL_SWITCH.CORE_SWITCH_ID; GIGE_PORT_ECLOUD_LINK_INFO create or replace view GIGE_PORT_ECLOUD_LINK_INFO as select GIGE_PORT_ETHERNET_CLOUD_LINK.ID, GIGE_PORT_ETHERNET_CLOUD_LINK.SWITCH_PORT_ID as GIGE_PORT_ID, GIGE_PORT_ETHERNET_CLOUD_LINK.CLOUD_ID, GIGE_PORT_ETHERNET_CLOUD_LINK.TRUSTED, GIGE_PORT_ETHERNET_CLOUD_LINK.
Views H coalesce(CARD.FCIP_CIRCUIT_CAPABLE, VIRTUAL_SWITCH.FCIP_CIRCUIT_CAPABLE) as FCIP_CIRCUIT_CAPABLE, GIGE_PORT.ISCSI_CAPABLE, GIGE_PORT.REMOTE_MAC_ADDRESS, GIGE_PORT.INBAND_MANAGEMENT_STATUS, GIGE_PORT.LAST_UPDATE, SWITCH_PORT.VIRTUAL_SWITCH_ID, SWITCH_PORT.USER_PORT_NUMBER, SWITCH_PORT.PORT_INDEX, VIRTUAL_SWITCH.WWN as VIRTUAL_SWITCH_WWN, VIRTUAL_SWITCH.MANAGEMENT_STATE, VIRTUAL_SWITCH.MONITORED, CORE_SWITCH.
H Views HBA_PORT_DETAIL.BOOT_OVER_SAN, HBA_PORT_DETAIL.BOOT_OPTION, HBA_PORT_DETAIL.BOOT_SPEED, HBA_PORT_DETAIL.BOOT_TOPOLOGY, HBA_PORT_DETAIL.BB_CREDIT, HBA_PORT_DETAIL.FRAME_DATA_FIELD_SIZE, HBA_PORT_DETAIL.HARDWARE_PATH, HBA_PORT_DETAIL.V_PORT_COUNT, HBA_PORT_DETAIL.QUEUE_DEPTH, HBA_PORT_DETAIL.INTERRUPT_CONTROL_COALESCE, HBA_PORT_DETAIL.INTERRUPT_CONTROL_LATENCY, HBA_PORT_DETAIL.INTERRUPT_CONTROL_DELAY, HBA_PORT_DETAIL.BEACON_STATE, HBA_PORT_DETAIL.LINK_BEACON_STATE, HBA_PORT_DETAIL.
Views H HBA_PORT_DETAIL.IO_EXEC_THROTTLE_MAX, HBA_PORT_DETAIL.IO_EXEC_THROTTLE_OPERATIONAL, HBA_PORT_DETAIL.IO_EXEC_THROTTLE_CONFIGURED, HBA_PORT_DETAIL.BOOTUP_DELAY, HBA_PORT_DETAIL.FEC_STATE, HBA_PORT_DETAIL.BB_CREDIT_RECOVERY_STATUS, HBA_PORT_DETAIL.CONFIGURED_BB_SCN_COUNT, HBA_PORT_DETAIL.NEGOTIATED_BB_SCN_COUNT from HBA_PORT left outer join HBA_PORT_DETAIL on HBA_PORT.DEVICE_PORT_ID = HBA_PORT_DETAIL.DEVICE_PORT_ID left outer join HBA_PORT_FCOE_DETAILS on HBA_PORT.
H Views HBA_REMOTE_PORT.FCP_IM_STATE, HBA_REMOTE_PORT.IO_LATENCY_MIN, HBA_REMOTE_PORT.IO_LATENCY_MAX, HBA_REMOTE_PORT.IO_LATENCY_AVERAGE, HBA_REMOTE_PORT.DATA_RETRANSMISSION_SUPPORT, HBA_REMOTE_PORT.REC_SUPPORT, HBA_REMOTE_PORT.TASK_RENTRY_IDENT_SUPPORT, HBA_REMOTE_PORT.CONFIRMED_COMPLETIONS_SUPPORT from HBA_TARGET, HBA_REMOTE_PORT, HBA_REMOTE_PORT_LUN where HBA_TARGET.HBA_REMOTE_PORT_LUN_ID = HBA_REMOTE_PORT_LUN.ID and HBA_REMOTE_PORT.ID = HBA_REMOTE_PORT_LUN.
Views H HOST_DISCOVERY_OPTION.CIM_USERNAME, HOST_DISCOVERY_OPTION.CIM_PASSWORD, HOST_DISCOVERY_OPTION.CIM_NAMESPACE, HOST_DISCOVERY_OPTION.CIM_PORT, HOST_DISCOVERY_OPTION.DISCOVER_VM, HOST_DISCOVERY_OPTION.VM_USERNAME, HOST_DISCOVERY_OPTION.VM_PASSWORD, HOST_DISCOVERY_OPTION.JSON_PORT, HOST_DISCOVERY_OPTION.VM_PORT, HOST_DISCOVERY_OPTION.Application_Name_USER_NAME, HOST_DISCOVERY_OPTION.Application_Name_SERVER_ADDRESS, DEVICE_ENCLOSURE.NAME, DEVICE_ENCLOSURE.TYPE, DEVICE_ENCLOSURE.ICON, DEVICE_ENCLOSURE.
H Views where FCR_PORT.WWN = IFL.BB_PORT_WWN) as FCR_SWITCH_ID, IFL.EDGE_PORT_WWN, IFL.BB_FABRIC_ID, IFL.BB_PORT_WWN , IFL.BB_RA_TOV, IFL.BB_ED_TOV, IFL.BB_PID_FORMAT, SWITCH_PORT.VIRTUAL_SWITCH_ID as EDGE_SWITCH_ID, SWITCH_PORT.ID as EDGE_PORT_ID, SWITCH_PORT.USER_PORT_NUMBER as EDGE_PORT_NUMBER, SWITCH_PORT.TYPE as EDGE_PORT_TYPE from IFL left outer join SWITCH_PORT on IFL.EDGE_PORT_WWN = SWITCH_PORT.WWN; ISL_INFO create or replace view ISL_INFO as select distinct ISL.ID, ISL.FABRIC_ID, ISL.COST, ISL.
Views H ISL, FABRIC_MEMBER SOURCE_FABRIC_MEMBER, VIRTUAL_SWITCH SOURCE_VIRTUAL_SWITCH, SWITCH_PORT SOURCE_SWITCH_PORT, FABRIC_MEMBER DEST_FABRIC_MEMBER, VIRTUAL_SWITCH DEST_VIRTUAL_SWITCH, SWITCH_PORT DEST_SWITCH_PORT, FABRIC where SOURCE_FABRIC_MEMBER.FABRIC_ID = ISL.FABRIC_ID and SOURCE_VIRTUAL_SWITCH.ID = SOURCE_FABRIC_MEMBER.VIRTUAL_SWITCH_ID and SOURCE_VIRTUAL_SWITCH.DOMAIN_ID = ISL.SOURCE_DOMAIN_ID and SOURCE_SWITCH_PORT.VIRTUAL_SWITCH_ID = SOURCE_VIRTUAL_SWITCH.ID and SOURCE_SWITCH_PORT.
H Views DEVICE VCS_DEVICE, VCS_CLUSTER_MEMBER SOURCE_CLUSTER_MEMBER, VCS_CLUSTER_MEMBER DEST_CLUSTER_MEMBER, DEVICE SOURCE_DEVICE, SWITCH_PORT SOURCE_SWITCH_PORT, FABRIC_MEMBER SOURCE_FABRIC_MEMBER, VIRTUAL_SWITCH SOURCE_VIRTUAL_SWITCH, DEVICE DEST_DEVICE, SWITCH_PORT DEST_SWITCH_PORT, FABRIC_MEMBER DEST_FABRIC_MEMBER, VIRTUAL_SWITCH DEST_VIRTUAL_SWITCH, FABRIC where SOURCE_FABRIC_MEMBER.FABRIC_ID = ISL.FABRIC_ID and SOURCE_VIRTUAL_SWITCH.ID = SOURCE_FABRIC_MEMBER.
Views H ISL_TRUNK_GROUP.ID, ISL_INFO.COST, ISL_INFO.TYPE, ISL_INFO.SOURCE_PORT_NUMBER, ISL_INFO.SOURCE_SWITCH_ID, SOURCE_CORE_SWITCH.IP_ADDRESS as SOURCE_SWITCH_IP_ADDRESS, SOURCE_VIRTUAL_SWITCH.WWN as SOURCE_SWITCH_WWN, SOURCE_VIRTUAL_SWITCH.MANAGEMENT_STATE as SOURCE_SWITCH_MANAGEMENT_STATE, SOURCE_VIRTUAL_SWITCH.MONITORED as SOURCE_SWITCH_MONITORED, ISL_INFO.SOURCE_DOMAIN_ID as MASTER_PORT, ISL_INFO.SOURCE_SWITCH_NAME, ISL_INFO.SOURCE_SWITCH_PORT_ID, ISL_INFO.DEST_PORT_NUMBER, ISL_INFO.
H Views and PHY_INTF.interface_id = LLDP_DATA.INTERFACE_ID; MAPS_EVENT_DETAILS_INFO create or replace view MAPS_EVENT_DETAILS_INFO as select MAPS_EVENT.ID, MAPS_EVENT.HOST_TIME, MAPS_EVENT.CATEGORY, MAPS_EVENT.VIOLATION_TYPE, MAPS_EVENT.MANAGED_ELEMENT_ID, MAPS_EVENT.ORIGIN_FABRIC_ID, MAPS_EVENT.SWITCH_PORT_ID, MAPS_EVENT.FCIP_CIRCUIT_ID, MAPS_EVENT.FRU_NAME, MAPS_EVENT.VM_ID, MAPS_EVENT_DETAILS.SWITCH_TIME, MAPS_EVENT_DETAILS.RULE_NAME, MAPS_EVENT_DETAILS.RULE_CONDITION, MAPS_EVENT_DETAILS.
Views H NPORT_WWN_MAP.VIRTUAL_SWITCH_ID, NPORT_WWN_MAP.N_PORT, NPORT_WWN_MAP.DEVICE_PORT_WWN, AG_N_PORT.REMOTE_PORT_WWN as EDGE_SWITCH_PORT_WWN, AG_N_PORT.WWN as AG_N_PORT_WWN, AG_F_PORT.USER_PORT_NUMBER as F_PORT, AG_F_PORT.WWN as AG_F_PORT_WWN, AG_F_PORT.REMOTE_NODE_WWN from NPORT_WWN_MAP, SWITCH_PORT AG_N_PORT, SWITCH_PORT AG_F_PORT, VIRTUAL_SWITCH AG_SWITCH where NPORT_WWN_MAP.VIRTUAL_SWITCH_ID = AG_N_PORT.VIRTUAL_SWITCH_ID and NPORT_WWN_MAP.N_PORT = AG_N_PORT.USER_PORT_NUMBER and NPORT_WWN_MAP.
H Views PORT_BOTTLENECK_CONFIG.WINDOW_, PORT_BOTTLENECK_CONFIG.QUIET_TIME, PORT_BOTTLENECK_CONFIG.CREATION_TIME, PORT_BOTTLENECK_CONFIG.LAST_UPDATE_TIME, PORT_BOTTLENECK_CONFIG.LATENCY_SEVERITY, PORT_BOTTLENECK_CONFIG.LATENCY_TIME, SWITCH_PORT.VIRTUAL_SWITCH_ID, SWITCH_PORT.USER_PORT_NUMBER, SWITCH_PORT.TYPE, SWITCH_PORT.WWN from PORT_BOTTLENECK_CONFIG left outer join SWITCH_PORT on PORT_BOTTLENECK_CONFIG.SWITCH_PORT_ID = SWITCH_PORT.
Views H SWITCH_PORT, VIRTUAL_SWITCH, FABRIC, FABRIC_MEMBER, PORT_GROUP_MEMBER, PORT_GROUP where VIRTUAL_SWITCH .ID = SWITCH_PORT.VIRTUAL_SWITCH_ID and FABRIC_MEMBER.VIRTUAL_SWITCH_ID = SWITCH_PORT.VIRTUAL_SWITCH_ID and FABRIC_MEMBER.FABRIC_ID = FABRIC.ID and SWITCH_PORT.ID = PORT_GROUP_MEMBER.SWITCH_PORT_ID and PORT_GROUP_MEMBER.PORT_GROUP_ID = PORT_GROUP.ID; ROLE_PRIVILEGE_INFO create or replace view ROLE_PRIVILEGE_INFO as select ROLE.ID, ROLE.NAME as ROLE_NAME, ROLE.
H Views PORT_PROFILE_QOS_PFC_MAP.COS1_RX, PORT_PROFILE_QOS_PFC_MAP.COS2_TX, PORT_PROFILE_QOS_PFC_MAP.COS2_RX, PORT_PROFILE_QOS_PFC_MAP.COS3_TX, PORT_PROFILE_QOS_PFC_MAP.COS3_RX, PORT_PROFILE_QOS_PFC_MAP.COS4_TX, PORT_PROFILE_QOS_PFC_MAP.COS4_RX, PORT_PROFILE_QOS_PFC_MAP.COS5_TX, PORT_PROFILE_QOS_PFC_MAP.COS5_RX, PORT_PROFILE_QOS_PFC_MAP.COS6_TX, PORT_PROFILE_QOS_PFC_MAP.COS6_RX, PORT_PROFILE_QOS_PFC_MAP.COS7_TX, PORT_PROFILE_QOS_PFC_MAP.COS7_RX, PORT_PROFILE_QOS_MAP.
Views H left outer join VM_VIRTUAL_ETHERNET_ADAPTER on PORT_PROFILE_MAC_MAP.MAC = VM_VIRTUAL_ETHERNET_ADAPTER.MAC_ADDRESS left outer join VM_VIRTUAL_MACHINE on VM_VIRTUAL_ETHERNET_ADAPTER.VIRTUAL_MACHINE_ID = VM_VIRTUAL_MACHINE.ID left outer join VM_VCENTER_MEMBER on VM_VIRTUAL_MACHINE.HOST_ID = VM_VCENTER_MEMBER.VM_HOST_ID left outer join VM_VCENTER on VM_VCENTER_MEMBER.VM_VCENTER_ID = VM_VCENTER.ID left outer join L2_NEIGHBOR on PORT_PROFILE_MAC_MAP.MAC = encode(L2_NEIGHBOR.
H Views sflow_staging.out_priority, sflow_staging.in_vlan, sflow_staging.out_vlan, sflow_staging.l3_protocol, sflow_staging.l4_src_port, sflow_staging.l4_dest_port, sflow_staging.time_in_seconds, sflow_staging.src_mac, sflow_staging.dest_mac, sflow_staging.l3_src_addr, sflow_staging.l3_dest_addr, sflow_staging.tcp_flags, sflow_staging.local_as, sflow_staging.src_as, sflow_staging.src_peer_as, sflow_staging.sflow_ip_route_info_id, sflow_staging.ip_flow_label, sflow_staging.src_user, sflow_staging.
Views H where SFLOW_MINUTE_L3.SLNUM <= (( SELECT SFLOW_MINUTE_L3_SLNUM.MAX_SLNUM FROM SFLOW_MINUTE_L3_SLNUM LIMIT 1)) union all select SFLOW_STAGING.DEVICE_ID, SFLOW_STAGING.TIME_IN_SECONDS, SFLOW_STAGING.L3_SRC_ADDR, SFLOW_STAGING.L3_DEST_ADDR, SFLOW_STAGING.L3_PROTOCOL, SFLOW_STAGING.L4_PROTOCOL, SFLOW_STAGING.TCP_FLAGS, SFLOW_STAGING.IN_VLAN, SFLOW_STAGING.OUT_VLAN, SFLOW_STAGING.FRAMES, SFLOW_STAGING.BYTES, VM1.VM_NAME AS SRC_VM_NAME, VM2.VM_NAME AS DEST_VM_NAME, VM1.VM_ADDRESS AS SRC_VM_ADDRESS, VM2.
H Views LEFT JOIN VM_ADDRESS_INFO VM2 ON SFLOW_MINUTE_MAC.DEST_MAC = VM2.MAC_ADDRESS WHERE SFLOW_MINUTE_MAC.SLNUM <= (( SELECT SFLOW_MINUTE_MAC_SLNUM.MAX_SLNUM FROM SFLOW_MINUTE_MAC_SLNUM LIMIT 1)) union all select SFLOW_STAGING.DEVICE_ID, SFLOW_STAGING.TIME_IN_SECONDS, SFLOW_STAGING.SRC_MAC, SFLOW_STAGING.DEST_MAC, SFLOW_STAGING.IN_VLAN, SFLOW_STAGING.OUT_VLAN, SFLOW_STAGING.FRAMES, SFLOW_STAGING.BYTES, VM1.VM_NAME AS SRC_VM_NAME, VM2.VM_NAME AS DEST_VM_NAME, VM1.VM_ADDRESS AS SRC_VM_ADDRESS, VM2.
Views H DEST_PORT.DOMAIN_ID as DEST_SWITCH_DOMAIN_ID from DEVICE_PORT as SOURCE_PORT, DEVICE_PORT as DEST_PORT, DEVICE_NODE as DEST_NODE, DEVICE_NODE as SOURCE_NODE, EE_MONITOR, EE_MONITOR_STATS where SOURCE_PORT.ID = EE_MONITOR.SOURCE_PORT_ID and EE_MONITOR.ID = EE_MONITOR_STATS.EE_MONITOR_ID and SOURCE_PORT.NODE_ID = SOURCE_NODE.ID and DEST_PORT.ID = EE_MONITOR.DEST_PORT_ID and DEST_PORT.NODE_ID = DEST_NODE.ID and EE_MONITOR_STATS.
H Views SC.CARD_INFO, SC.CARDCN_ID, SC.FIRST_NAME, SC.LAST_NAME, SC.NOTES, SC.CREATION_TIME, -1 ENGINE_ID, EG.ID ENCRYPTION_GROUP_ID, EG.NAME GROUP_NAME, -1 CARD_POSITION, -1 CRYPTO_SWITCH_ID, -1 SLOT_NUMBER from SMART_CARD SC, ENCRYPTION_GROUP EG, QUORUM_CARD_GROUP_MAPPING QCGM where QCGM.SMART_CARD_ID = SC.ID and EG.ID = QCGM.ENCRYPTION_GROUP_ID and SC.CARD_TYPE = 0 union select SC.ID SMART_CARD_ID, SC.CARD_TYPE, SC.CARD_INFO, SC.CARDCN_ID, SC.FIRST_NAME, SC.LAST_NAME, SC.NOTES, SC.
Views H from SMART_CARD SC, ENCRYPTION_ENGINE EE, SYSTEM_CARD_ENGINE_MAPPING SCEM where SC.ID = SCEM.SMART_CARD_ID and EE.ID = SCEM.ENCRYPTION_ENGINE_ID and SC.CARD_TYPE = 2; SWITCH_CONFIG_INFO create or replace view SWITCH_CONFIG_INFO as select SWITCH_CONFIG.ID, SWITCH_CONFIG.NAME, SWITCH_CONFIG.SWITCH_ID, SWITCH_CONFIG.CORE_SWITCH_ID, SWITCH_CONFIG.BACKUP_DATE_TIME, SWITCH_CONFIG.CONFIG_DATA, SWITCH_CONFIG.CEE_CONFIG_DATA, SWITCH_CONFIG.KEEP_COPY, SWITCH_CONFIG.CREATED_BY, SWITCH_CONFIG.
H Views CORE_SWITCH.VF_SUPPORTED, CORE_SWITCH.CALL_HOME_ENABLED, CORE_SWITCH.MANAGED_ELEMENT_ID as CORE_MANAGED_ELEMENT_ID, CORE_SWITCH.NAT_PRIVATE_IP_ADDRESS, CORE_SWITCH.ALTERNATE_IP_ADDRESS, CORE_SWITCH.MAC_ADDRESS, VIRTUAL_SWITCH.ID, VIRTUAL_SWITCH.NAME, VIRTUAL_SWITCH.OPERATIONAL_STATUS, VIRTUAL_SWITCH.SWITCH_MODE, VIRTUAL_SWITCH.AD_CAPABLE, VIRTUAL_SWITCH.WWN, VIRTUAL_SWITCH.ROLE, VIRTUAL_SWITCH.FCS_ROLE, VIRTUAL_SWITCH.DOMAIN_ID, VIRTUAL_SWITCH.VIRTUAL_FABRIC_ID, VIRTUAL_SWITCH.
Views H CORE_SWITCH_DETAILS.SW_LICENSE_ID, CORE_SWITCH_DETAILS.SUPPLIER_SERIAL_NUMBER, CORE_SWITCH_DETAILS.PART_NUMBER, CORE_SWITCH_DETAILS.CHECK_BEACON, CORE_SWITCH_DETAILS.TIMEZONE, CORE_SWITCH_DETAILS.MAX_PORT, CORE_SWITCH_DETAILS.CHASSIS_SERVICE_TAG, CORE_SWITCH_DETAILS.BAY_ID, CORE_SWITCH_DETAILS.TYPE_NUMBER, CORE_SWITCH_DETAILS.MODEL_NUMBER, CORE_SWITCH_DETAILS.MANUFACTURER, CORE_SWITCH_DETAILS.PLANT_OF_MANUFACTURER, CORE_SWITCH_DETAILS.SWITCH_SERIAL_NUMBER, CORE_SWITCH_DETAILS.
H Views where L2_NEIGHBOR.LLDP_REM_CHASSIS_ID_SUBTYPE = 4 and L2_NEIGHBOR.INTERFACE_ID = INTERFACE.INTERFACE_ID and INTERFACE.DEVICE_ID = DEVICE.DEVICE_ID; SWITCH_PORT_INFO create or replace view SWITCH_PORT_INFO as select SWITCH_PORT.ID, SWITCH_PORT.VIRTUAL_SWITCH_ID, SWITCH_PORT.WWN, SWITCH_PORT.NAME, SWITCH_PORT.SLOT_NUMBER, SWITCH_PORT.PORT_NUMBER, SWITCH_PORT.USER_PORT_NUMBER, SWITCH_PORT.PORT_ID, SWITCH_PORT.PORT_INDEX, SWITCH_PORT.AREA_ID, SWITCH_PORT.MAC_ADDRESS, SWITCH_PORT.
Views H SWITCH_PORT.TUNNEL_CONFIGURED, SWITCH_PORT.FCIP_TUNNEL_UP, SWITCH_PORT.FCR_FABRIC_ID, SWITCH_PORT.FCR_INTEROP_MODE, SWITCH_PORT.CALCULATED_STATUS, SWITCH_PORT.USER_DEFINED_VALUE1, SWITCH_PORT.USER_DEFINED_VALUE2, SWITCH_PORT.USER_DEFINED_VALUE3, SWITCH_PORT.KIND, SWITCH_PORT.STATE, SWITCH_PORT.PREVIOUS_STATUS, SWITCH_PORT.LAST_UPDATE, SWITCH_PORT.OCCUPIED, SWITCH_PORT.PORT_BIT_MASK, SWITCH_PORT.LOGICAL_PORT_NUMBER, SWITCH_PORT.DEFAULT_AREA_ID, SWITCH_PORT.LOGICAL_PORT_WWN, SWITCH_PORT.
H Views CORE_SWITCH.VENDOR, CORE_SWITCH.REACHABLE, CORE_SWITCH.UNREACHABLE_TIME, CORE_SWITCH.MODEL, CORE_SWITCH_DETAILS.CONTACT, CORE_SWITCH_DETAILS.LOCATION, CORE_SWITCH_DETAILS.DESCRIPTION, VIRTUAL_SWITCH.ID, VIRTUAL_SWITCH.NAME, VIRTUAL_SWITCH.OPERATIONAL_STATUS, VIRTUAL_SWITCH.SWITCH_MODE, VIRTUAL_SWITCH.AD_CAPABLE, VIRTUAL_SWITCH.FCIP_CAPABLE, VIRTUAL_SWITCH.WWN, VIRTUAL_SWITCH.ROLE, VIRTUAL_SWITCH.FCS_ROLE, VIRTUAL_SWITCH.DOMAIN_ID, VIRTUAL_SWITCH.VIRTUAL_FABRIC_ID, VIRTUAL_SWITCH.
Views H coalesce(SNMP_CREDENTIALS.PRIV_PASSWORD, (select SNMP_PROFILE.PRIV_PASSWORD from SNMP_PROFILE where SNMP_PROFILE.NAME='default')) as SNMP_PRIV_PASSWORD, coalesce(SNMP_CREDENTIALS.SNMP_INFORMS_ENABLED, (select SNMP_PROFILE.SNMP_INFORMS_ENABLED from SNMP_PROFILE where SNMP_PROFILE.NAME='default')) as SNMP_INFORMS_ENABLED from VIRTUAL_SWITCH left outer join CORE_SWITCH on VIRTUAL_SWITCH.CORE_SWITCH_ID = CORE_SWITCH.ID left outer join CORE_SWITCH_DETAILS on CORE_SWITCH.ID = CORE_SWITCH_DETAILS.
H Views TIME_SERIES_DATA_2_30MIN.MEASURE_INDEX, TIME_SERIES_DATA_2_30MIN.ME_ID, TIME_SERIES_DATA_2_30MIN.VALUE from TIME_SERIES_DATA_2_30MIN) union all select TIME_SERIES_DATA_2_2HOUR.TIME_IN_SECONDS, TIME_SERIES_DATA_2_2HOUR.TARGET_TYPE, TIME_SERIES_DATA_2_2HOUR.MEASURE_ID, TIME_SERIES_DATA_2_2HOUR.TARGET_ID, TIME_SERIES_DATA_2_2HOUR.COLLECTOR_ID, TIME_SERIES_DATA_2_2HOUR.MEASURE_INDEX, TIME_SERIES_DATA_2_2HOUR.ME_ID, TIME_SERIES_DATA_2_2HOUR.
Views H JOIN device de ON ifs.device_id = de.device_id JOIN pm_data_collector ON pm_data_collector.id = tsd.collector_id JOIN measure ON measure.id = tsd.measure_id) UNION ALL SELECT de.device_id, cast (de.ip_address as varchar(255)) AS device_ip, tsd.target_type, sp.id AS target_id, sp.name AS target_name, measure.measure_type AS collectible_type, tsd.measure_id AS collectible_id, tsd.collector_id, pm_data_collector.name AS collector_name, (measure.name::text || '.'::text) || tsd.
H Views VCS_DEVICE.DEVICE_ID as VCS_DEVICE_ID, TRILL.CLUSTER_ME_ID, TRILL.COST, TRILL.MISSING, TRILL.TRUNKED, TRILL.SOURCE_DOMAIN_ID, TRILL.SOURCE_PORT_NUMBER, TRILL.SOURCE_ME_ID, TRILL.SOURCE_SWITCH_PORT_ID, SOURCE_DEVICE.DEVICE_ID AS SOURCE_DEVICE_ID, SOURCE_SWITCH_PORT.TYPE as PORT_TYPE, SOURCE_SWITCH_PORT.NAME as SOURCE_SWITCH_PORT_NAME, SOURCE_SWITCH_PORT.KIND as SOURCE_SWITCH_PORT_KIND, SOURCE_SWITCH_PORT.PHYSICAL_PORT as SOURCE_PHYSICAL_PORT, TRILL.DEST_DOMAIN_ID, TRILL.DEST_PORT_NUMBER, TRILL.
Views H inner join TRILL_TRUNK_MEMBER on TRILL_TRUNK_MEMBER.GROUP_ID = TRILL_TRUNK_GROUP.ID inner join DEVICE as MEMBER_DEVICE on MEMBER_DEVICE.MANAGED_ELEMENT_ID = TRILL_TRUNK_GROUP.ME_ID left outer join INTERFACE on INTERFACE.DEVICE_ID = MEMBER_DEVICE.DEVICE_ID and INTERFACE.IDENTIFIER = TRILL_TRUNK_MEMBER.PORT_NUMBER left outer join VCS_CLUSTER_MEMBER on VCS_CLUSTER_MEMBER.MEMBER_ME_ID = TRILL_TRUNK_GROUP.ME_ID left outer join DEVICE as CLUSTER_DEVICE on CLUSTER_DEVICE.
H Views VIRTUAL_SWITCH.VIRTUAL_FABRIC_ID as VIRTUAL_FABRIC_ID, VIRTUAL_SWITCH.DOMAIN_ID as DOMAIN_ID, VIRTUAL_SWITCH.INTEROP_MODE as INTEROP_MODE, VIRTUAL_SWITCH.MANAGEMENT_STATE, VIRTUAL_SWITCH.MONITORED, CORE_SWITCH.TYPE as SWITCH_TYPE, CORE_SWITCH.FIRMWARE_VERSION as FIRMWARE_VERSION, CORE_SWITCH.IP_ADDRESS as IP_ADDRESS, CORE_SWITCH.WWN as PHYSICAL_SWITCH_WWN, CORE_SWITCH.MODEL as SWITCH_MODEL, CORE_SWITCH_DETAILS.
Views H left outer join USER_DEFINED_DEVICE_DETAIL UDDD on VIRTUAL_PORT_WWN_DETAILS.AG_NODE_WWN = UDDD.WWN; VM_ADDRESS_INFO create or replace view VM_ADDRESS_INFO AS select DECODE(VM_VIRTUAL_ETHERNET_ADAPTER.MAC_ADDRESS::TEXT, 'HEX'::TEXT) AS MAC_ADDRESS, VM_VIRTUAL_MACHINE.NAME AS VM_NAME, DECODE(VM_VIRTUAL_MACHINE.IP_ADDRESS::TEXT, 'HEX'::TEXT) AS VM_ADDRESS, VM_VCENTER_MEMBER.HOST_NAME AS VM_HOST_NAME, DECODE(VM_VIRTUAL_MACHINE.
H Views SWITCH_PORT.STATUS AS SWITCH_PORT_STATUS, SWITCH_PORT.ID as SWITCH_PORT_ID, SWITCH_PORT.PORT_ID, SWITCH_PORT.PORT_NUMBER, SWITCH_PORT.SLOT_NUMBER, USER_DEFINED_DEVICE_DETAIL.NAME AS ADAPTER_PORT_NAME, VM_PATH.FABRIC_ID, VM_PATH.VM_PORT_WWN, VM_STORAGE.MODEL, VM_STORAGE.VENDOR from DEVICE_PORT left join USER_DEFINED_DEVICE_DETAIL on DEVICE_PORT.WWN = USER_DEFINED_DEVICE_DETAIL.
Views H VM_PATH.HBA_PORT as ADAPTER_PORT_WWN, VM_PATH.TARGET_PORT as TARGET_PORT_WWN, VM_STORAGE.NAME as LUN_CAN_NAME, VM_PATH.FS_TYPE, VM_VIRTUAL_MACHINE.HYPERVISOR_VM_ID, DEVICE_ENCLOSURE.MANAGED_ELEMENT_ID AS HOST_ME_ID, DEVICE_ENCLOSURE.IP_ADDRESS AS HOST_IP_ADDRESS, DEVICE_ENCLOSURE.HOST_NAME AS HYPERVISOR_HOST_NAME, FABRIC.NAME as FABRIC_NAME, VIRTUAL_SWITCH.NAME as VIRTUAL_NAME, SWITCH_PORT.STATUS as SWITCH_PORT_STATUS, SWITCH_PORT.ID as SWITCH_PORT_ID, SWITCH_PORT.PORT_ID, SWITCH_PORT.
H Views VM_DATASTORE_DETAILS_INFO create or replace view VM_DATASTORE_DETAILS_INFO as select vm_virtual_machine_datastore_map.virtual_machine_id, vm_virtual_machine_datastore_map.vm_datastore_details_id, vm_datastore_details.datacenter_id, vm_virtual_machine_datastore_map.provisioned_storage, vm_virtual_machine_datastore_map.not_shared_storage, vm_virtual_machine_datastore_map.used_storage, vm_datastore_details.name, vm_datastore_details.accessible, vm_datastore_details.status, vm_datastore_details.
Views H and VM_PATH.VM_ID = VM_VIRTUAL_MACHINE.ID and SOURCE_PORT.ID = EE_MONITOR.SOURCE_PORT_ID and EE_MONITOR.ID = EE_MONITOR_STATS.EE_MONITOR_ID and SOURCE_PORT.NODE_ID = SOURCE_NODE.ID and DEST_PORT.ID = EE_MONITOR.DEST_PORT_ID and DEST_PORT.NODE_ID = DEST_NODE.ID and EE_MONITOR_STATS.
H Views VM_STORAGE.HOST_ID, VM_STORAGE.ID as LUN_ID, VM_STORAGE.NAME as LUN_NAME, VM_STORAGE.TARGET_NODE, VM_STORAGE.VENDOR, VM_STORAGE.MODEL, VM_STORAGE.SERIAL_NUMBER, VM_STORAGE.TYPE, VM_STORAGE.CAPACITY, VM_STORAGE.STATUS as LUN_STATUS, VM_STORAGE.PATH_POLICY, VM_STORAGE.ISCSI_TARGET_ADDRESS, VM_STORAGE.ISCSI_TARGET_PORT, VM_STORAGE.NAS_REMOTE_HOST, VM_STORAGE.NAS_REMOTE_PATH, VM_PATH.FS_TYPE, VM_PATH.ID as PATH_ID, VM_PATH.VM_ID as PATH_VM_ID, VM_PATH.NAME as PATH_NAME, VM_PATH.FABRIC_ID, VM_PATH.
Views H SWITCH_PORT.STATUS as SWITCH_PORT_STATUS, SWITCH_PORT.PORT_ID, SWITCH_PORT.PORT_NUMBER from VM_STORAGE, VM_HOST, DEVICE_ENCLOSURE, VM_VIRTUAL_MACHINE, VM_PATH, DEVICE_PORT, SWITCH_PORT, CORE_SWITCH, FC_PORT_STATS, VIRTUAL_SWITCH where VM_PATH.HBA_PORT::BPCHAR = DEVICE_PORT.WWN and VM_PATH.VM_ID = VM_VIRTUAL_MACHINE.ID and VM_PATH.STORAGE_ID = VM_STORAGE.ID and VM_STORAGE.HOST_ID = DEVICE_ENCLOSURE.ID and DEVICE_ENCLOSURE.ID = VM_HOST.DEVICE_ENCLOSURE_ID and DEVICE_ENCLOSURE.
H Views SWITCH_PORT, CORE_SWITCH, SWITCH_TE_PORT_STATS, VIRTUAL_SWITCH, DEVICE_PORT_MAC_ADDRESS_MAP, DEVICE_PORT_GIGE_PORT_LINK, GIGE_PORT where VM_PATH.HBA_PORT::BPCHAR = DEVICE_PORT.WWN and VM_PATH.VM_ID = VM_VIRTUAL_MACHINE.ID and VM_PATH.STORAGE_ID = VM_STORAGE.ID and VM_STORAGE.HOST_ID = DEVICE_ENCLOSURE.ID and DEVICE_ENCLOSURE.ID = VM_HOST.DEVICE_ENCLOSURE_ID and DEVICE_ENCLOSURE.ID = VM_VIRTUAL_MACHINE.HOST_ID and DEVICE_PORT.ID = DEVICE_PORT_MAC_ADDRESS_MAP.
Views H VCEM_PROFILE.ID = VR_CONN_DOMAIN.VCEM_PROFILE_ID left outer join VR_CONN_DOMAIN_GROUP on VR_CONN_DOMAIN_GROUP.ID = VR_CONN_DOMAIN.VR_CONN_DOMAIN_GROUP_ID left outer join VIRTUAL_SWITCH on VIRTUAL_SWITCH.WWN = VR_CONN_MODULE.WWN left outer join CORE_SWITCH on CORE_SWITCH.ID = VIRTUAL_SWITCH.CORE_SWITCH_ID inner join FABRIC_MEMBER on FABRIC_MEMBER.VIRTUAL_SWITCH_ID = VIRTUAL_SWITCH.ID inner join FABRIC on FABRIC_MEMBER.FABRIC_ID = FABRIC.ID union select distinct VR_CONN_MODULE.ID, VR_CONN_MODULE.
H Views left outer join DEVICE_NODE on DEVICE_NODE.WWN = VR_CONN_MODULE.WWN left outer join FABRIC on DEVICE_NODE.FABRIC_ID = FABRIC.ID; VR_CONN_MODULE_PORT_INFO create or replace view VR_CONN_MODULE_PORT_INFO as select VR_CONN_MODULE_PORT.ID, VR_CONN_MODULE_PORT.VR_CONN_MODULE_ID, VR_CONN_MODULE_PORT.WWN, VR_CONN_MODULE_PORT.POSITION_, VR_CONN_MODULE_PORT.FABRIC_NAME, VR_CONN_MODULE_PORT.SPEED, VR_CONN_MODULE_PORT.STATUS, VR_CONN_MODULE_PORT.LAST_STATUS, VR_CONN_MODULE_PORT.
Views H VCEM_PROFILE.ID as VCEM_PROFILE_ID, VR_CONN_DOMAIN.ID as VIRTUAL_CONNECT_DOMAIN_ID, VR_CONN_MODULE.ID as VIRTUAL_CONNECT_MODULE_ID, VR_CONN_MODULE_PORT.ID as VIRTUAL_CONNECT_MODULE_PORT_ID, VIRTUAL_SWITCH.ID as VIRTUAL_SWITCH_ID, coalesce(SWITCH_PORT.WWN, VR_CONN_MODULE_PORT.WWN) as UPLINK_PORT_WWN, coalesce(SWITCH_PORT.PORT_NUMBER, VR_CONN_MODULE_PORT.POSITION_) as UPLINK_PORT_NUMBER, DEVICE_PORT.ID as DEVICE_PORT_ID, DEVICE_PORT.NUMBER as DEVICE_PORT_NUMBER, DEVICE_PORT.
H Views VM_VIRTUAL_ETHERNET_ADAPTER.PORT_GROUP_NAME, VM_VIRTUAL_MACHINE.NAME AS VIRTUAL_MACHINE_NAME, VM_VCENTER_MEMBER.HOST_NAME, VM_VCENTER.NAME AS VCENTER_NAME from VM_VIRTUAL_ETHERNET_ADAPTER, VM_VIRTUAL_MACHINE, VM_VCENTER_MEMBER, VM_VCENTER where VM_VIRTUAL_ETHERNET_ADAPTER.VIRTUAL_MACHINE_ID = VM_VIRTUAL_MACHINE.ID AND VM_VIRTUAL_MACHINE.HOST_ID = VM_VCENTER_MEMBER.VM_HOST_ID AND VM_VCENTER_MEMBER.VM_VCENTER_ID = VM_VCENTER.ID union all select VM_HOST_VIRTUAL_NIC.
Views H VM_VIRTUAL_ETHERNET_ADAPTER, VM_VIRTUAL_MACHINE, VM_VCENTER_MEMBER, VM_VCENTER Where VM_VIRTUAL_ETHERNET_ADAPTER.VIRTUAL_MACHINE_ID = VM_VIRTUAL_MACHINE.ID And VM_VIRTUAL_MACHINE.HOST_ID = VM_VCENTER_MEMBER.VM_HOST_ID And VM_VCENTER_MEMBER.VM_VCENTER_ID = VM_VCENTER.ID; ZONE_DB_INFO create or replace view ZONE_DB_INFO as select ZONE_DB.ID, ZONE_DB.FABRIC_ID, ZONE_DB.OFFLINE, ZONE_DB.NAME, ZONE_DB.CREATED, ZONE_DB.CREATED_BY, ZONE_DB.LAST_MODIFIED, ZONE_DB.LAST_MODIFIED_BY, ZONE_DB.
H Views select DEVICE_ID, IN_SLOT, IN_PORT, OUT_SLOT, OUT_PORT, L4_PROTOCOL, IP_TOS, SRC_SUBNET_BITS, DEST_SUBNET_BITS, IN_PRIORITY, OUT_PRIORITY, IN_VLAN, OUT_VLAN, L3_PROTOCOL, L4_SRC_PORT, L4_DEST_PORT, TIME_IN_SECONDS, SRC_MAC, DEST_MAC, L3_SRC_ADDR, L3_DEST_ADDR, TCP_FLAGS, LOCAL_AS, SRC_AS, SRC_PEER_AS, SFLOW_IP_ROUTE_INFO_ID, IP_FLOW_LABEL, SRC_USER, DEST_USER, FRAMES, BYTES, IN_UNIT, OUT_UNIT from SFLOW_HOUR_SUMMARY where SLNUM <= (select MAX_SLNUM from SFLOW_HOUR_SUMMARY_SLNUM fetch first 1 rows
Views H where SLNUM >= (select MIN_SLNUM from SFLOW_STAGING_SLNUM fetch first 1 rows only); -- Name: sflow_minute_vlan_view; Type: VIEW; Schema: dcm; Owner: dcmadmin create or replace view SFLOW_MINUTE_VLAN_VIEW as select DEVICE_ID, TIME_IN_SECONDS, IN_VLAN, OUT_VLAN, FRAMES, BYTES from SFLOW_MINUTE_VLAN where SLNUM <= (select MAX_SLNUM from SFLOW_MINUTE_VLAN_SLNUM fetch first 1 rows only) union all select DEVICE_ID, TIME_IN_SECONDS, IN_VLAN, OUT_VLAN, FRAMES, BYTES from SFLOW_STAGING where SLNUM >= (sele
H Views SELECT l2.device_id, l2.device_ip_address, l2.physical_device_id, l2.unit_number, l2.slot_id, l2.slot_num, l2.module_id, l2.physical_port_id, l2.port_num, l2.interface_id, l2.name, l2.if_name, l2.identifier, l2.speed_in_mb, l2.physical_address, l2.interface_id AS radioif_id, wireless.radio_type, wireless.is_enabled, wireless.is_auto_channel, wireless.tx_power, wireless.channel_number, wireless.max_data_rate, wireless.beacon_rate, wireless.dtim, wireless.rts_threshold, wireless.
Views H DEVICE.IP_ADDRESS from PHYSICAL_DEVICE, SLOT, DEVICE where DEVICE.DEVICE_ID = PHYSICAL_DEVICE.DEVICE_ID and SLOT.PHYSICAL_DEVICE_ID = PHYSICAL_DEVICE.PHYSICAL_DEVICE_ID; MANAGED_ELEMENT_INFO Common managed element data used by custom DTO methods to identify the managed element type, and provide a link to the details table for the managed element.
H Views select * from SNMP_EXPR_DATA_30MIN union all select * from SNMP_EXPR_DATA_2HOUR union all select * from SNMP_EXPR_DATA_1DAY; SNMP_DATA_VIEW create or replace view snmp_data_view as ( ( ( ( SELECT de.device_id, de.ip_address AS device_ip, se.target_type, de.device_id AS target_id, de.sys_name AS target_name, 1 AS collectible_type, se.expression_id AS collectible_id, se.collector_id, ( SELECT perf_collector.name AS collector_name FROM perf_collector WHERE perf_collector.collector_id = se.
Views H WHERE mib_object.mib_object_id = sd.mib_object_id) AS collectible_name, ( SELECT mib_object.oid AS collectible_detail FROM mib_object WHERE mib_object.mib_object_id = sd.mib_object_id) AS collectible_detail, sd.value, sd.time_in_seconds, sd.mib_index FROM snmp_data_info sd JOIN interface ifs ON sd.target_type = 1::numeric AND sd.target_id = ifs.interface_id JOIN device de ON ifs.device_id = de.device_id) UNION ALL SELECT de.device_id, de.ip_address AS device_ip, se.target_type, ifs.
H Views FROM snmp_expression WHERE snmp_expression.expression_id = se.expression_id) AS collectible_name, ( SELECT snmp_expression.equation AS collectible_detail FROM snmp_expression WHERE snmp_expression.expression_id = se.expression_id) AS collectible_detail, se.value, se.time_in_seconds, '' AS mib_index FROM snmp_expr_data_info se JOIN switch_port sp ON se.target_type = 4 AND se.target_id = sp.id JOIN device de ON (( SELECT sw.managed_element_id FROM virtual_switch sw WHERE sw.id = sp.
Views H VM_HOST_END_DEV_CONNECTIVITY.INTERFACE_ID = PHYSICAL_INTERFACE.INTERFACE_ID and PHYSICAL_INTERFACE.PHYSICAL_PORT_ID = PHYSICAL_PORT.PHYSICAL_PORT_ID union all select VM_HOST.HYPERVISOR_NAME as VHOST_NAME, VM_VIRTUAL_MACHINE.NAME as VM_NAME, VM_VIRTUAL_MACHINE.HYPERVISOR_VM_ID as VM_ID, VM_VIRTUAL_ETHERNET_ADAPTER.MAC_ADDRESS as VNIC_MAC, VM_STD_VSWITCH_PORT_GROUP.NAME as PGRP_NAME, VM_STANDARD_VIRTUAL_SWITCH.NAME as VSWITCH_NAME, null as DVPORT_NAME, VM_PHYSICAL_NIC.
H Views VCS_MEMBER.MISSING, VCS_MEMBER.MISSING_TIME from DEVICE VCS_DEVICE, DEVICE MEMBER_DEVICE, VCS_CLUSTER_MEMBER VCS_MEMBER where VCS_MEMBER.CLUSTER_ME_ID = VCS_DEVICE.MANAGED_ELEMENT_ID AND VCS_MEMBER.MEMBER_ME_ID = MEMBER_DEVICE.MANAGED_ELEMENT_ID; RESET_VCS_LICENSED CREATE OR REPLACE FUNCTION reset_vcs_licensed(no_of_licenses integer) RETURNS void AS $BODY$ begin UPDATE fabric set vcs_licensed = 0; UPDATE device set vcs_licensed = 0; UPDATE fabric set vcs_licensed = 1 WHERE fabric.
Views H left outer join VCS_CLUSTER_MEMBER on VCS_CLUSTER_MEMBER.MEMBER_ME_ID = TRILL_TRUNK_GROUP.ME_ID left outer join DEVICE CLUSTER_DEVICE on CLUSTER_DEVICE.MANAGED_ELEMENT_ID = VCS_CLUSTER_MEMBER.CLUSTER_ME_ID; WIRELESS_INTERFACE create or replace view wireless_interface as SELECT l2.device_id, l2.device_ip_address, l2.physical_device_id, l2.unit_number, l2.slot_id, l2.slot_num, l2.module_id, l2.physical_port_id, l2.port_num, l2.interface_id, l2.name, l2.if_name, l2.identifier, l2.speed_in_mb, l2.
H Views AS radioif_id, radio_interface.radio_type, radio_interface.is_enabled, radio_interface.is_auto_channel, radio_interface.tx_power, radio_interface.channel_number, radio_interface.max_data_rate, radio_interface.beacon_rate, radio_interface.dtim, radio_interface.rts_threshold, radio_interface.is_turbo_mode, radio_interface.radio_g_mode, radio_interface.max_associated_clients FROM radio_interface) wireless ON ((l2.interface_id = wireless.
Views H CEE_PORT_INFO create or replace view CEE_PORT_INFO as select GIGE_PORT.ID, GIGE_PORT.SWITCH_PORT_ID, GIGE_PORT.PORT_NUMBER, CEE_PORT.ID AS CEE_PORT_ID, CEE_PORT.VIRTUAL_SWITCH_ID, CEE_PORT.IF_INDEX, CEE_PORT.IF_NAME, CEE_PORT.IF_MODE, CEE_PORT.L2_MODE, CEE_PORT.VLAN_ID, CEE_PORT.LAG_ID, CEE_PORT.IP_ADDRESS, CEE_PORT.MAC_ADDRESS, CEE_PORT.PORT_SPEED, CEE_PORT.ENABLED, CEE_PORT.OCCUPIED, CEE_PORT.LAST_UPDATE, CEE_PORT.NET_MASK, CEE_PORT.PROTOCOL_DOWN_REASON, CEE_PORT.MAC_ACL_POLICY, CEE_PORT.
H 1438 Views Brocade Network Advisor SAN User Manual 53-1002696-01
Index A access levels defined, 1114 features, 1114–1115, 1116–?? roles, 1114 accessing FTP server folder, 124 ACK emulation, device level, 786 activating Allow/Prohibit Matrix configuration, 838 LSAN zones, 742 zone configuration, 729 active session management, roles and access levels, 1114 active sessions, viewing, 9 adapter software using to manage driver files, 412 adapters HBA models, 404 types of, 404 types of converged network adapters, 405 types of fabric adapters, 405 types of HBAs, 404 Adaptive Ra
reviewing events, 82 roles and access levels, 1115 starting, 82 status, determining, 247 switch configuration, 330 viewing status, 81 base switch, creating, 516 boot image repository and host adapters, 414 backing up files, 417 deleting image, 417 downloading an image to a selected host, 417 importing, 415 boot LUN zones about, 748 creating, 748 deleting, 749 modifying, 749 bottleneck detection, 922 C C3 Discard Frames threshold, 811 call home, 168 centers assigning a device, 183 assigning event filters, 1
comparing two side by side, 879 Configure menu, 1065 configuring allow/prohibit matrix, 832 asset polling, 120 bottleneck alert parameters, 924 call home, 168 cascaded FICON fabric, 841 client export port, 113 discovery, 41 e-mail notification, 974 encrypted storage in a multi-path environment, 646 explicit server IP address, 116 external FTP server, 127 FCIP advanced settings, 781 FCIP tunnels, 776 FICON emulation, 785 FTP server, 124 internal FTP server, 125 internal SCP server, 126 internal SFTP server,
database, restoring, 305 DCB switches, L2 mode compatibility, 861 deactivating zone configuration, 730 default background color, changing, 268 default community strings, 47 default desktop color, changing, 268 default zone (fabrics) disabling, 723 enabling, 723 defining, event filter, 184 delete switch configuration, 335 deleting Allow/Prohibit Matrix configuration, 839 end-to-end monitoring pairs, 917 fabrics, 48, 66 FCIP tunnels, 793, 794 historical performance graph, 914 hosts, 67, 72 logical switches, 5
firmware repository, 347 master log event details, 1034, 1035 downloading firmware, 344 dual network cards, configuration, 117 duplicate names,fixing, 94 duplicating zone alias, 727 zone configuration, 732 zones, 722 Dynamic Load Sharing (DLS), 805 E edge fabrics about, 506 Edit menu, 1062 editing property fields, 354 property labels, 257, 354 storage array properties, 398 thresholds, 823 views, 262 zone alias, 725 Element Manager, launching launching Element Manager, 275 e-mail event notification setup ro
CIM listener ports, 410 ESXi hosts updating drivers, 412 ESXi systems management application support for, 409 Ethernet events disabling, 87 enabling, 87 event action handling special events, 1004 event action definition creating, 996 deleting, 1008 event action definitions configuring e-mail settings, 1006 configuring varbind filters, 999 creating a new definition, 1007 modifying an existing definition, 1007 event actions, handling special events, 1005 event custom reports adding a report schedule, 1029 cop
fabric properties dialog boxes, customizing, 1118 fabric tracking roles and access levels, 1116 Fabric Watch, launching, 278 fabrics deleting from discovery, 48, 66 deleting permanently, 48 discovering, 39 IPv6 discovery, 39 monitoring, 52 status, determining, 247 zone database, clearing, 752 Fastwrite, 772 fault management roles and access levels, 1115 FC Address for inactive iSCSI devices, 365, 1126 FC routing module, 276 FC-FC routing about, 506 setting up, 507 supported switches, 505 FCIP advanced setti
zoning offline, 1115 zoning online, 1115 zoning set edit limits, 1115 feature-to-firmware requirements, 27 Fibre Channel over IP, 760 FICON cascaded fabrics, 831 configurations, 831 configuring emulation, 785 CUP, 831 display resetting, 85 setting, 84 FICON management roles and access levels, 1116 filtering events for users, 432 master log events, 1037 port connectivity view results, 359 real time performance data, 905 finding assigned thresholds, 827 firmware deleting files from repository, 349 downloading
host adapter discovery, 408 host adapters adding a port configuration, 419 and boot image repository, 414 and connectivity map, 411 and driver repository, 413 and fault management, 431 and performance management, 428 and port mapping, 411 and role-based access control, 427 and security authentication, 429 and supportSave, 431 and syslog forwarding, 432 and view management, 411 bulk port configuration, 418 configuring FAWWNs, 422 configuring ports, 418 deleting a driver file from the repository, 414 deleting
supported protocols, 541 supported servers, 541 TLS certificates, 542 L launch remote client, 4 launching Server Management Console, 289 SMIA Configuration Tool, 310 launching Fabric Watch, 278 launching FCR configuration, 276 launching HCM Agent, 278 launching Name Server, 277 launching Telnet, 274 launching Web Tools, 275 layout, changing, 266 layout, overview, 265 LDAP server configuring, 297 license update roles and access levels, 1115 licensing FCIP services, 760 Lifetime Key Manager (LKM) description
alternate, 670 backup, 670 create new master key, 670 creating a new, 669 description of, 669 reasons they are disabled, 670 restore master key, 670 saving to a file, 671 master log, 245 copying, 1036 copying parts, 1036 displaying, 1034, 1035 exporting, 1037 filtering events, 1037 membership list, fabric binding adding detached devices, 803 adding switches, 803 removing switches, 804 memory allocation configuration, 118 configuring asset polling, 120 viewing status, 122 menu bar Configure, 1065 Discover, 1
P PAP, 294 passwords database, changing, 19, 23 patch install, 35 uninstall, 36 performance clearing port counters, 906 roles and access levels, 1115 performance data real time, 903 performance graph generating, 903 saving historical configuration, 909 performance monitoring overview, 896 performance measures, 897 thresholds, 929 performance reports generating, 1057 physical map customizing views, 260 default background color, changing, 268 displaying connections, 267 group background color, changing, 267 l
iSCSI tab, 1124 Port tab, 1125 Storage tab, 1122 properties edit roles and access levels, 1115 property fields editing, 354 property labels adding, 257, 353 deleting, 257, 354 editing, 257, 354 pseudo event definitions, 1010 adding an escalation policy, 1015 adding on the flapping policy, 1018 copying an existing definition, 1014 creating, 1010 creating an event action on the flapping policy, 1019 creating an event action on the resolving policy, 1017 deleting, 1014 filtering traps, 1012 modifying an existi
role based access control. See RBAC.
spanning tree protocol configuration, 865 configuring on a port VLAN, 866 deploying a configuration on a port VLAN, 868 special events handling, 1004, 1005 start monitoring, 55 state change threshold, 812 status backup, 81 discovery, 49 host discovery, 67, 72 memory allocation, 122 status bar, 247 stop monitoring, 53 storage array adding storage ports to, 396 creating, 396 deleting, 398 reassigning storage ports to, 397 unassigning storage ports from, 397 storage array properties editing, 398 viewing, 399 s
config database fields, ??–1301 GigE port stats database fields, 1227–?? Meta SAN database fields, ??–1320 UI database fields, ??–1276 zoning 1 database fields, 1276–?? Tape Pipelining, 772 tape pipelining, 773 tape pools adding, 709 description of, 709 identifying using a name or a number, 710 modifying, 708 removing, 708 tape read and write acceleration, 772 tape write acceleration, 773 technical support data collection roles and access levels, 1115 technical support information copying to an external FTP
creating, 744 disabling, 746 disabling failover, 747 enabling, 746 enabling failover, 747 traffic isolation zoning, 742 configuring, 744 troubleshooting discovery, 49, 68, 73 FCIP Ethernet connections, 798 tunnels, configuring, 776 U unassigning storage ports from storage array, 397 unassociating, HBA to server, 392 uninstalling a patch, 36 UNIX authentication configuring, 304 unregistering an SNMP trap, 990 un-zoned members listing, 755 user privileges, 1097 User Administrator, 1097 user ID, determining,
displaying, 854 displaying by products, 857 displaying in the global view, 856 modifying port, 864 VLAN management in a VCS environment, 855 VLAN Manager configuration requirements, 854 default VLAN, 853 definition of, 853 super-aggregated VLAN, 853 using to display by products, 857 views, 855 VLAN routing, 871 managing IP addresses on an SVI, 872 VM Manager deleting, 409 discovery, 408 editing, 409 VM managers deleting from discovery, 71 VMware vSphere Update Manager, using to update drivers on ESXi hosts,
deleting, 722 duplicating, 722 finding in zone configuration, 754 removing from zone configuration, 729 renaming, 721 zoning configuration overview, 717 configuring, 717 invalid names, 716 LSAN, 738 naming conventions, 716 offline, 715 online, 715 overview, 713 traffic isolation, 742 traffic isolation, configuring, 744 zoning activation roles and access levels, 1115 zoning administration, 749 zoning configuration overview, 717 zoning offline roles and access levels, 1115 zoning online roles and access level