
Understanding endurance and performance characteristics of HP solid state drives

5
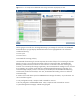
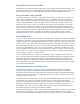
Figure 1: This is an example of the SMARTSSD Wear Gauge information displayed by the ACU.
The bar gauges on the left show the Usage Remaining in percentages for each SSD. The SMARTSSD
status table at the top right displays detailed information for the highlighted SSD. This information
includes the following:
Power cycles
Power-on hours
Estimated life remaining (in days)
The Estimated Life Remaining for the SSD represents the number of days of use remaining for the SSD
based on its time in service and the percentage of lifecycle consumed to date. The Estimated Life
Remaining number assumes that the server will continue to use the SSD in the same manner going
forward. If its workload profile changes significantly, then the Estimated Life reading won’t be accurate.
As an example, let’s consider an SSD that has a stated Estimated Life Remaining of 60 days. If its
workload changes abruptly so that its write activity has doubled, then the Estimated Life Remaining
would actually trend towards 30 days. Over time, the Estimated Life reading will start to reflect the
workload change.
A number of tools and utilities report the SMARTSSD Wear Gauge information, not just the ACU. You
can use the following tools:
Array Configuration Utility—Graphical and command line versions
HP Array Diagnostic and SMARTSSD Wear Utility—Graphical and command line versions
System Management Homepage—SNMP Storage Agents