HP 3PAR System Reporter 3.1 MU2 Software User Guide Abstract This guide provides information required to install and use HP 3PAR System Reporter Software to monitor performance, create charge back reports, and plan storage resources for HP 3PAR StoreServ Storage systems, and is intended for system and storage administrators who monitor and direct system configurations and resource allocation for HP 3PAR StoreServ Storage systems. For HP 3PAR OS 3.1.1 or OS 2.3.
© Copyright 2014 Hewlett-Packard Development Company, L.P. The information contained herein is subject to change without notice. The only warranties for HP products and services are set forth in the express warranty statements accompanying such products and services. Nothing herein should be construed as constituting an additional warranty. HP shall not be liable for technical or editorial errors or omissions contained herein.
TERMS AND CONDITIONS FOR USE, REPRODUCTION, AND DISTRIBUTION 1. Definitions. "License" shall mean the terms and conditions for use, reproduction, and distribution as defined by Sections 1 through 9 of this document. "Licensor" shall mean the copyright owner or entity authorized by the copyright owner that is granting the License. "Legal Entity" shall mean the union of the acting entity and all other entities that control, are controlled by, or are under common control with that entity.
modify the License. You may add Your own attribution notices within Derivative Works that You distribute, alongside or as an addendum to the NOTICE text from the Work, provided that such additional attribution notices cannot be construed as modifying the License.
To protect your rights, we need to make restrictions that forbid anyone to deny you these rights or to ask you to surrender the rights. These restrictions translate to certain responsibilities for you if you distribute copies of the software, or if you modify it. For example, if you distribute copies of such a program, whether gratis or for a fee, you must give the recipients all the rights that you have. You must make sure that they, too, receive or can get the source code.
Accompany it with the information you received as to the offer to distribute corresponding source code. (This alternative is allowed only for noncommercial distribution and only if you received the program in object code or executable form with such an offer, in accord with Subsection b above.) The source code for a work means the preferred form of the work for making modifications to it.
Contents 1 Overview and Features.............................................................................17 User Interfaces.......................................................................................................................17 About System Reporter............................................................................................................17 Configuring System Reporter Policy Settings................................................................................
Removing the System Reporter Components................................................................................52 Removing the System Reporter Tools on Windows..................................................................52 Removing the System Reporter Tools on Linux.........................................................................53 Removing the MySQL Database (Optional)............................................................................53 3 Getting Started......................
Select PDIDs.................................................................................................................88 Include Chunklets..........................................................................................................88 Select Cage IDs............................................................................................................88 Select Disk Types...........................................................................................................
CPU Performance Reports..................................................................................................113 Link Performance Reports..................................................................................................113 QoS Performance Reports.................................................................................................114 Adaptive Optimization Reports...............................................................................................
example:....................................................................................................................136 charttab..........................................................................................................................136 values:.......................................................................................................................136 example:................................................................................................................
selcpg............................................................................................................................148 value:........................................................................................................................148 example:....................................................................................................................148 selusrcpg...............................................................................................................
Report Types........................................................................................................................157 Summary Report...................................................................................................................158 summary........................................................................................................................158 example:........................................................................................................
example:....................................................................................................................164 vv_cmp_group.................................................................................................................164 example:....................................................................................................................164 cpu_perf_time.................................................................................................................
output:.......................................................................................................................179 objectpres= vv_name_nosnap............................................................................................180 example:....................................................................................................................180 output:.......................................................................................................................
Calculating Common Performance Metrics......................................................................210 Service Time Histogram Buckets....................................................................................211 IO Size Histogram Buckets............................................................................................211 The statpd Table..............................................................................................................211 The statpdinv Table............
1 Overview and Features This document provides the information you need to install and use HP 3PAR System Reporter to monitor performance, create charge back reports, and plan storage resources for HP 3PAR StoreServ Storage systems. For HP 3PAR OS 3.1.1 or OS 2.3.1, an optionally licensed component called Adaptive Optimization is also included with System Reporter that can be used to monitor and automatically optimize utilization of storage resources.
• Scheduling of reports with predefined parameters that are initiated at predetermined times and can then be accessed when needed. • Customization of reports using the standard web interface, (or through the provided Excel client), that provide specifically selected and formatted reports for specified systems.
Quick Reports -- Allows you to immediate access a variety of predefined reports (created through CGI programs) that are deemed useful for most installations. The reports are made available through a menu tree that you expand and collapse to select the systems and options of interest.
Table 1 Available Reports (continued) Report Name Description Report Metrics Cross Reference Node Cache Performance Displays Node Cache Performance. “Node Cache Performance Reports” (page 112) CPU Performance Displays CPU performance. “CPU Performance Reports” (page 113) Link Performance Displays performance of links between nodes.
Formatting Reports for Presentation When building customized reports, you can specify how the reporting data is formatted for viewing by selecting the appropriate table or type of chart.
Using the Database Schema to Build Custom Reports The databases used by System Reporter are standard relational databases capable of supporting SQL queries. The default (built-in) database is SQLite (see http://www.sqlite.org) but MySQL®, Microsoft SQL Server, and Oracle database servers can optionally be used instead. The database schema is documented so you can write your own reports by directly querying the System Reporter database.
2 Installation, Configuration, Update, and Removal Before You Begin Before installing HP 3PAR System Reporter components, select a system on which to run the System Reporter sampler and Web server. This system must use Windows® Server 2012, Windows® Server 2008, Red Hat® Enterprise Linux 5, or Red Hat® Enterprise Linux 6.
System Requirements HP 3PAR System Reporter supports HP 3PAR OS v2.3.1, v3.1.1, v3.1.2, and v3.1.3 versions. Observe the minimum system hardware requirements shown in Table 3 (page 24), and also use the sizing spreadsheet described in “Using the System Reporter Sizing Spreadsheet” (page 25).
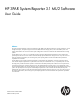
Using the System Reporter Sizing Spreadsheet Before installing System Reporter, you need to determine the system resources that are required to adequately run System Reporter and the selected data base server. The optimal computing power (CPU cores), memory and storage space needed to accommodate the data that is sampled by System Reporter and used to generate reports depends on the number of systems and the amount of storage that is being monitored for your particular installation.
Figure 1 System Reporter Sizing Spreadsheet 1. Click the appropriate type of database that you are using for System Reporter at your site. You will notice that SQlite only supports one HP 3PAR StoreServ Storage for use with System Reporter. Please consider another database if you plan on using System Reporter to monitor more than a single HP 3PAR StoreServ Storage. 2. Modify the Sampling Parameters in red to reflect the approximate values for your installation.
Storage System Components and Recommended High Resolution Sampling Interval Table 4 (page 27) gives an overview of the storage system components, example values (per system), and the recommended high resolution sampling intervals that add to the database space.
• Manage only one storage system in one instance of System Reporter when a storage system has more than 32000 VLUNs. • Update the max_allowed_packet parameter value to 128M in MySQL configuration file. For more information, see “Setting the max_allowed_packet parameter” (page 41). • Perform the following steps if the custom report generation fails or takes long time in a highly scaled environment: ◦ Reduce the period for the report generation.
supports limited concurrency, these functions are performed by the sampleloop process). These include: – The trimdb process removes samples that are older than the sample retention period specified in the sampling policies (see “Configuring Sampling Policies” (page 116)). – The dedupinv process removes duplicate entries from the inventory tables. – The compactdb process periodically compacts and optimizes the database when necessary. • Adaptive Optimization components.
Optional Components Installation of the following components are optional: • Excel client (optional). While the necessary Excel sheet is automatically included, Microsoft Excel is required by the machine accessing the Excel sheet from the System Reporter server. • The Microsoft SQL, MySQL or Oracle database (optional). Except for the SQLite database which is supplied with System Reporter, any other choice of database must be obtained from the respective vendor.
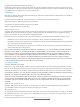
Figure 3 Installation Process Flowchart Installing the Web Server HP 3PAR System Reporter requires Apache HTTP Server, version 2.2 or later. A copy of the installer executable for Windows of Apache HTTP Server, version 2.2, is located on the HP 3PAR System Reporter CD or you can download the most recent version from www.apache.org. Red Hat Linux typically includes the Apache Web Server.
NOTE: System Reporter 2.9 and beyond supports secure connections on Apache servers using the SSL protocol. For details on implementing the SSL protocol on Apache servers, please consult the following links: http://httpd.apache.org/docs/2.2/ssl/ssl_intro.HTML http://httpd.apache.org/docs/2.2/ssl/ssl_howto.HTML http://httpd.apache.org/docs/2.1/ssl/ssl_faq.
installation or configuration, it is very simple to use but it has several limitations that make it only suitable for small database sizes and limited concurrency. SQLite supports only limited database concurrency because it relies on a single file lock for the entire database. The sampling process needs exclusive access to the database when inserting new samples. If the database is very large or if there are a large number of concurrent web requests, the sampler or the Web server can time out.
Table 6 Database Comparison (continued) Comment SQLite Microsoft SQL MySQL Oracle Scale to large database No, recommend size? less than 1 GB Yes Yes Yes Scale to large number of No concurrent users? Yes Yes Yes Performance for sample insertion and deletion? Good High Good Adequate for small databases Installing and Setting Up the Microsoft SQL Server Database (Optional) To install the Microsoft SQL Server Database, you must create the database and then set up a valid login and user.
Figure 4 Selecting Data Sources (ODBC) On the System Reporter host create a System ODBC DSN as follows: 1. Select Administrative Tools→Data Sources (ODBC). The ODBC Data Source Administrator screen appears: Figure 5 ODBC Data Source Administrator Screen 2. 3. Select the System DSN tab. Click Add.
Figure 6 Selecting the data source for the SQL driver 4. Choose SQL Server Native Client 10.0. Any SQL server ODBC driver will work. However, the SQL Server Native Client ODBC is supplied with the Microsoft SQL Server client and is considered to be the most efficient. NOTE: Although you have the option of using the default SQL Server ODBC, if the SQL Server client is already installed on the machine, choose the latest ODBC. 5. Click Finish.
6. Click Next. Figure 8 Entering the Login ID and Password 7. Enter the user's log in and password information, then click Next. Figure 9 Specifying the MSSQL Database Name 8. Check the Change the default database check box, and enter the name of the MSSQL database that has been created for System Reporter.
9. Click Next. Figure 10 Checking the Details for the Database 10. Click Finish. Figure 11 ODBC Microsoft SQL Server Setup Screen.
11. Check the details for the selected database, then click Test Data Source. The screen must show the following (Figure 12 (page 39)): Figure 12 SQL Server ODBC Data Source Test Screen If the screen does not show the appropriate information, please run the configuration again. Installing and Setting Up the MySQL Database (Optional) To use MySQL, you must install MySQL Database Server by following the instructions provided in this section.
6. Make sure that Configure MySQL Server now is checked and then click Finish. The MySQL Server Instance ConfigurationWizard appears. NOTE: When installing on a Red Hat Linux server where the MySQL server is running locally on the same server, you must complete one of the following procedures: Create a symbolic link using the following command: ln -s /var/lib/mysql/mysql.sock /var/run/mysqld/mysqld.sock Or, make the following change in the /etc/my.cnf file: socket=/var/run/mysqld/mysqld.
Setting the max_allowed_packet parameter Change the max_allowed_packet MySQL parameter by editing its value in the MySQL initialization file. • On Linux, the default initialization file is /etc/my.cnf. • On Windows, the default initialization file is C:\Program Files\MySQL\MySQL Server 5.1\my.ini. The initialization file should include the following line: max_allowed_packet=32M After changing the max_allowed_packet parameter, you need to restart the MySQL server.
4. Grant the two users the privilege levels described above by running the commands below: use inservstats grant all on * to cliuser; grant select on * to webuser; exit; 5. Exit the mysql command line by running the following command: exit; Setting Up the Oracle Database (Optional) System Reporter supports the use of MySQL® Database Server or Oracle Database Server. To use Oracle, you must set up Oracle, following the instructions provided in this section.
user names and passwords for the cliuser and the webuser. See “Modifying the Apache HTTP Server Configuration Files” (page 129) for instructions on editing these config.tcl files if you change the Oracle usernames and passwords at a later time. To create the users, open the Oracle Enterprise Manager for the database in a web browser.
Installing or Upgrading the System Reporter Tools You have several options for installing the HP 3PAR System Reporter tools, depending on whether you choose to use the SQLite database (the default), or one of the other optional databases.
5. 6. 7. Use the Browse... button to select and enter the installation directory for the HP 3PAR System Reporting Tools sampler or accept the default directory (C:/Program Files/3PAR/System Reporter) and then click Next. Make sure that the desired database is selected, then click Next. This step differs based on the type of database you selected. a. If you selected SQLite for the database, you are prompted for the installation directory for the HP 3PAR Reporting Tools SQLite database. Use the Browse...
configure System Reporter to generate email alerts, you must enter the IP address or name of the SMTP server, the user name and password if the SMTP server requires authentication, and the SMTP originator name (the mailbox name that the email appears to be from). This information is stored in the sampleloop_config.tcl file in the System Reporter installation directory. Click Next to continue.
Installing System Reporter Tools on Linux System Reporter tools on Linux consists of two RPM packages available on the CD: • sampleloop (sampleloop-3.1-4.i386rpm) consists of the files needed to install the sampleloop daemon. • sysrptwebsrv (sysrptwebsrv-3.1-4.i386.rpm) consists of the files needed to install the System Reporter web server code. Both these packages must be installed after logging in to a terminal session on the server as the root user.
6. Install the sysrptwebsrv package by mounting the System Reporter CD, changing to the directory on the CD that includes the rpm packages and running: rpm --install sysrptwebsrv-3.1-4.i386.rpm 7. Edit the /var/www/cgi-bin/3par-rpts/config.tcl and /var/www/cgi-bin/ 3par-policy/config.tcl files following the directions in those files. If previous versions of the file were saved, you may keep the previous settings and simply replace the files with the saved versions.
Click OK or Cancel. 7. 8. 9. • If you click Cancel, then addition of InServ fails and the certificate is not stored. • If you click OK, then the InServ gets added successfully and the certificate is stored in the following location: ◦ Windows: \certdir ◦ Linux: /etc/certdir Leave the Skip LD Performance data box checked if you do not need to collect performance data for Logical Disks (LDs).
11. Repeat step 5 to add additional storage servers and then click Return to Policies. NOTE: The maximum CPG size supported when region data sampling is enabled for Adaptive Optimization is 250 TB. The maximum Adaptive Optimization configuration size is limited to 125 TB. NOTE: • System Reporter prompts you to save the certificate only if you select the Use SSL option while adding Inserv. • While adding Inserv, System Reporter prompts you to save the certificate for each array that has HP 3PAR OS 3.1.
The HP 3PAR System Reporter Excel client is contained in a single Microsoft Excel workbook with the file name 3PAR System Reporter.xls. After downloading this file, you can save it in any convenient location. To download the HP 3PAR System Reporter Excel client: 1. Open a browser window and point it at http:///3par/ where is the server where Apache HTTP Server is installed (see “Before You Begin” (page 23) and “Optional Components” (page 30). 2.
file, you must also create a password file {password_file}, as described in your Apache documentation.
7. 8. 9. Locate and remove the inservstats.db file if the file was in a location other than the System Reporter folder. Also remove the file inservstats.db-journal if present in the same folder. (Optional) In the location where you installed Apache HTTP Server, locate the htdocs directory (for example, C:\Program Files\Apache Group\Apache2\htdocs) and delete the 3par subdirectory (C:\Program Files\Apache Group\Apache2\htdocs\3par).
3 Getting Started You can use HP 3PAR System Reporter from the primary web interface or an Excel client. NOTE: For information on using a Web browser to edit database sampling policies, add or remove storage servers from the database, schedule reports or optimize storage utilization with the optional Adaptive Optimization feature, see “Configuring the System Reporter Policy Settings” (page 116).
Figure 14 The System Reporter Main Window The HP 3PAR System Reporter Main Menu (Figure 14 (page 55)) is divided into the following areas: • Title Pane, which shows the version of System Reporter. • Main Menu tabs, which provide options for generating quick reports, accessing scheduled reports and creating customized reports. (See “Accessing and Creating Reports” (page 66) for details). • Extras Menu area has links to: ◦ Excel Client, used to create and access custom reports.
◦ User Guide (this document in PDF format). ◦ Sampling Status (the time since the most recent high-resolution sample for each system being sampled). NOTE: Instead of opening a new window, browsers can be configured to open a new tab instead. For Firefox, open the options window (Tools→Options), click the Tabs tab, and select the option that opens new pages in a new tab.
The list of available objects can be filtered by typing an expression pattern in the text input area above the list of available objects and clicking on the Filter button. CAUTION: Filtering large numbers of objects may exceed the limit for your server, in which case you should reduce the number of objects being filtered and try again.
Figure 15 System Reporter Excel Client Setting the Security Level for Excel The HP 3PAR System Reporter Excel client uses macro code to implement its functionality. In order for this code to be executed, you must set the proper security settings depending on the version of Excel that you are using. Setting the Security for Excel 2003 In most cases, when accessing the System Reporter client for Excel 2003, a Security Warning screen appears indicating that macros have been disabled (Figure 16 (page 58)).
2. On the Microsoft Excel Tools menu, point to Macro, then Security. The Security dialog box appears with the Security Level tab enabled (Figure 17 (page 59)). Figure 17 Setting the Security Level 3. On the Security Level tab, set the security level to Medium or Low (Medium is the default and suggested setting) and then click OK. NOTE: The HP 3PAR System Reporter Excel client will not work if the Microsoft Excel security level is set to High or Very High. 4.
1. Click the Options button next to the security alert. The Security Alert - Macro screen appears (Figure 18 (page 60)). Figure 18 Macro Security Alert for Excel 2007 2. 3. Choose the Enable this content radio button. Click OK. If you do not see a Security Warning when accessing the Excel client, it is likely that the main Excel Macro Settings are not set up properly and need to be changed. In this case, follow these steps: 4. 5. 6. 7.
Figure 19 Trust Center Screen 8. If it is not already set, from the list of Macro Settings, choose Disable all macros with notification. NOTE: The HP 3PAR System Reporter Excel client will not work if the Macro Setting is set to Disable all macros without notification or Disable all macros except digitally signed macros. 9. Click OK, then click OK again to return to the System Reporter Excel client main screen. 10. Close the Excel client, then launch it again from the System Reporter main menu. 11.
1. After opening the HP 3PAR System Reporter Excel client workbook with the correct security level setting, click Initialize. The Connection Parameters dialog box appears (Figure 20 (page 62)). Figure 20 Connection Parameters Dialog Box 2. In the Server Hostname box, type a host name and click OK. The host name is the name of the Web server where the Apache HTTP Server and HP 3PAR System Reporter Web server scripts are installed (see “Before You Begin” (page 23)).
Changing the Excel Client Server and Resetting the Workbook The HP 3PAR System Reporter Excel client workbook includes a custom 3PAR menu that is accessible from the Microsoft Excel menu tab called Add-Ins. This menu tab enables you to change the Web server, reset the workbook, and delete menu sheets. Changing the Web Server To change the Web server used for querying the System Reporter database: 1. Click the Add-Ins menu tab, choose the 3PAR pull down menu, and then select Set server name....
Deleting Data Sheets Data sheets remain until you manually delete them. Manually deleting a data sheet causes any embedded charts associated with that data sheet to disappear as well. To delete a data sheet: 1. At the bottom of the Microsoft Excel window, click a data sheet tab to enable the sheet to be deleted. 2. Point to the name of the data sheet tab and then right-click. 3. On the shortcut menu that appears, click Delete. 4. In the confirmation dialog that appears, click OK. The data sheet is deleted.
Figure 22 Security Alerts Multiple Issues To enable macros and the data connection, choose the Enable this content buttons. NOTE: If it is ever necessary, you can obtain an entirely new copy of the HP 3PAR System Reporter Excel client workbook by following the instructions provided in “Installing the Excel Client (Optional)” (page 50).
4 Accessing and Creating Reports System Reporter provides quick reports, scheduled reports, and custom reports that are specifically tailored for your operating environment. The menu selections and controls available for creating custom reports from either the web interface or the Excel client are functionally identical, so the information in this chapter applies to both with explanations provided for any minor variations.
Accessing Scheduled Reports Scheduled reports are generated using preselected parameters at scheduled times and are stored in subdirectories whose structure is reflected in the tree shown in Figure 24 (page 67). Scheduled reports are stored with a name that is assigned when the report is scheduled. Each time the report runs, a new subdirectory is created for that instance of the report using the timestamp as the name.
Creating Custom Reports You can create customized reports by selecting the Custom Reports tab from the Main Menu or by choosing the Excel Client from the Extras Menu. NOTE: The web interface and Excel client for creating custom reports are identical except that the Excel client charting functions are accessed separately from the main interface and provide some additional flexibility. In general, there are two main steps involved in creating a report: 1.
“Report ” (page 69) “Select Systems” (page 70) “Select Domains” (page 70) “Format Selection (Web interface only)” (page 94) Sample Resolution The Sample resolution control enables you to select from one of three resolutions corresponding to the tables that are maintained in the database (see Table 7 (page 69)). The samples can be retained for different lengths of time for each resolution (see “Editing Sampling Policies” (page 118) for instructions on altering the default sampling policies).
Table 8 Reports and Uses (continued) Reports Purpose CPU Performance Display CPU performance. See “CPU Performance Reports” (page 113) for the types of statistics provided by this report. Link Performance Display performance of links between nodes. See “Link Performance Reports” (page 113) for the types of statistics provided by this report. QoS Performance Display performance of QoS Rules. See “QoS Performance Reports” (page 114) for the types of statistics provided by this report.
Figure 26 Report Menu for Daily VLUN Performance The top of the report menu includes a section that lists the current selection of systems of domains. In this example, the menu includes only system named unicorn and all domains. For most reports, the controls in the report menu are divided into four sections: • 1. Report Selection: controls the type of report that will be generated, see “Report Selection” (page 77). • 2.
Use the controls in the menu to select the desired report parameters and then click Generate Report. See Figure 26 (page 71) for a listing of the controls that are available for each report and then consult the relevant sections later in this chapter for complete details. CAUTION: Filtering large numbers of objects may exceed the limit for your server, in which case you should reduce the number of objects being filtered and try again.
Figure 27 Query Results If necessary, use the scrollbox on the right to view all charts and/or tables. Controls Available by Report Table 11 (page 74) lists the set of controls that are valid for generating each report. The entries have the following meanings: • A blank entry indicates that the control is not valid for report. • A Y entry indicates that the control is valid for all report types. • A T entry indicates that the control is valid for the report but only for Versus Time report types.
Table 11 Controls for Each Report Report: Section and Control Summary PD CPG LD VV PD Space Space Space Space Perf Port LD VLUN Perf Perf Perf VV Node CPU Cache Cache Perf Perf Perf Link Perf QoS Perf Adaptive Optimization Main Menu “Sample Y Resolution” (page 69) Y Y Y Y Y Y Y Y Y Y Y Y Y Y “Select Y Systems” (page 70) Y Y Y Y Y Y Y Y Y Y Y Y Y Y Y Y Y Y Y Y Y Y Y Y Y Y Y Y Y Y “Select Domains” (page 70) Report Selection “Standard Report Types” (page 78)
Table 11 Controls for Each Report (continued) Report: Section and Control Summary PD CPG LD VV PD Space Space Space Space Perf Port LD VLUN Perf Perf Perf VV Node CPU Cache Cache Perf Perf Perf Link Perf QoS Perf Adaptive Optimization “Begin/At Y Time” (page 86) Y Y Y Y Y Y Y Y Y Y Y Y Y Y “End Time” (page 87) T T T T T T T T T Y T T T T H H H H “Count” (page 87) Object Selection “Select PDIDs” (page 88) Y Y “Include Chunklets” (page 88) Y Y “Select Cage IDs” (
Table 11 Controls for Each Report (continued) Report: Section and Control Summary PD CPG LD VV PD Space Space Space Space Perf “Select LD Usage” (page 90) Port LD VLUN Perf Perf Perf VV Node CPU Cache Cache Perf Perf Perf Link Perf QoS Perf Y “Select LUN” (page 91) Y “Select VVs” (page 91) Y “Select Prov Types” (page 91) Y “Select VV Types” (page 92) Y Y “Select Hosts” (page 93) Y “Select Port Types” (page 92) Y “Select Port Types” (page 92) Y “Select Port Rates” (page 92) Y Y Y Y
Table 11 Controls for Each Report (continued) Report: Section and Control Summary PD CPG LD VV PD Space Space Space Space Perf Port LD VLUN Perf Perf Perf VV Node CPU Cache Cache Perf Perf Perf Link Perf QoS Perf Adaptive Optimization Rules” (page 94) Format Selection “Report Information” (page 94) Y Y Y Y Y Y Y Y Y Y Y Y Y Y “Chart Types” (page 95) Y Y Y Y Y Y Y Y Y Y Y Y Y Y “Chart X Pixels” (page 99) Y Y Y Y Y Y Y Y Y Y Y Y Y Y “Chart Y Pixels” (page 99
“Low Bucket” (page 86) “High Bucket” (page 86) “Sum End Buckets” (page 86) Standard Report Types The following standard report types are available (Table 12 (page 78)): Table 12 Standard Report Types Report Type Purpose Versus Time Display metric versus time. The beginning of the time range is specified by the Begin/At Time control (see “Begin/At Time” (page 86)) and the end of the time range is specified by the End Time control (see “End Time” (page 87)).
Figure 28 Versus Time Report Example In the aggregate performance of all the selected objects (possibly in multiple systems) is shown. Typically, some components of the metric may be shown separately, for example Read and Write metric are shown separately.
Figure 29 Versus Time with Compare=System Report Example If you want to compare the performance of a particular class of objects (for example, systems), then you can use the Compare control (see “Compare” (page 83)) available in some reports if the Report Type is Versus Time. Figure 29 (page 80) shows an example where systems are being compared.
Figure 30 Group By System:Host At Time Report Example The At Time report can be used in conjunction with the Group By and Order By controls to do more detailed comparisons at a specific point in time. Figure 30 (page 81) shows an At Time report with System and Host selected in the Group By control and IOPs/s selected in the Order By control. This allows us to easily compare the performance of hosts on different systems.
Figure 31 Histogram Versus Time Report Example The Histogram Versus Time report provides a histogram or service times for the aggregate of the selected objects as shown in “Histogram Versus Time Report Example” (page 82). There is a separate line per service time bucket.
Figure 32 Histogram At Time Report Example The Histogram At Time report provides a histogram or service times and IO sizes at a specific time for the aggregate of the selected objects as shown in “Histogram At Time Report Example” (page 83). Select Summary Columns This control is valid only for the Summary report and selects which columns are displayed in the Summary report. Compare This control is only valid for some Versus Time performance reports and the options available depend on the report.
Max. Number Specifies the maximum number of graphs that will be generated for a given report. This option is only valid when a compare is requested and when set to none, this option is ignored. Select Peak For some reports, when the number of objects to be compared (see “Compare” (page 83)) exceeds 16, the Select Peak control can be used to select which 16 objects to compare.
Order By This control is only valid for At Time reports and specifies the order of the X (category) axis for the reports. The menu options available depend on the report selected and are listed with each report. One or more Order By options can be selected (use CTRL-CLICK to select multiple options) and the default if none are selected is System. See Table 14 (page 85) for a listing of all available options. Table 14 Order By Option Purpose System Order by HP 3PAR StoreServ Storage.
Table 14 Order By (continued) Option Purpose Queue Length Order by queue length. Busy Percentage Order by the percentage of time that the VLUN is busy (i.e., has at least one outstanding IO operation). Total Accesses Order by total number of accesses for VV and node cache performance. ReadHit% Order by read hit% for VV and node cache performance. WriteHit% Order by write hit% for VV and node cache performance. Idle Order by Idle time for CPU performance reports.
Table 15 Begin/At Time Option Purpose earliest Begin with the earliest sample available. a list of specific time values Begin at the specified time value. The values in the menu are populated based on the actual samples in the selected data table. a list of relative time values Begin at the specified time before the current time.
Select PDIDs This is a filtered multi-selection control (see “Filtered Multi-Selection Control” (page 56)) used to select one or more PDIDs to include in the report. This control is available for PD Space and PD Performance reports. Table 18 Select PDIDs Option Purpose -All PDIDs- The report will include all the PDIDs that are included in the database. list of specific PDIDs Select one or more PDIDs to include in the report.
Table 22 Select Disk Speed Option Purpose -All Disk Speeds- The report will include all the Disk Speeds that are included in the database. list of specific Disk Speeds. Select one or more Disk Speeds to include in the report. Multiple Disk Speeds can be selected using (CTRL-CLICK). Currently available disk speeds are: • 10- 10 K RPM disks • 7- 7200 RPM disks • 15 - 15 K RPM disks • 150 - SSDs Include PDs in States This control is only available for PD Space reports.
Table 25 Select Snp CPGs Option Purpose -All CPGs- The report will include all the Snp CPGs that are included in the database. list of specific CPGs Select one or more Snp CPGs to include in the report. Multiple CPGs can be selected. Select CPGs This is a filtered multi-selection control (see “Filtered Multi-Selection Control” (page 56)) used to select one or more CPGs to include in the report. This control is available for CPG Space, LD Space, and Adaptive Optimization Region IO Density reports.
Table 29 Select LD Usage (continued) Option Purpose C,SA: Copy Snapshot Admin Include LDs mapped to VV snapshot copy admin space. P: Preserved data Include LDs that are marked to hold data that cannot be flushed due to RAID set failure. P,F: First Preserved data Include Preserved data LDs that are also distinguished as being the first in the group of Preserved data LDs. log: Logging Include LDs that are marked for use in temporarily storing data during physical disk replacement operation.
Table 32 Select Prov Types (continued) Option Purpose • tpsd - Old-style thin provisioned VV (created with an older release than 2.3.1) where both the base VV space and the snapshot copy space are allocated from the same Snp space associated with the same Snp CPG. • snp - The VV is a virtual copy (snapshot). Select VV Types This control is available for VV Space reports and is used to select the copy type of the VV.
Table 36 Select Ports (n:s:p) Option Purpose -All Ports- The report will include all the Ports that are included in the database. list of specific ports Select one or more ports to include in the report. Multiple ports can be selected using (CTRL-CLICK).
Select QoS Rules This is a filtered multi-selection control (see “Filtered Multi-Selection Control” (page 56)) that is used to select one or more QoS Rules to include in the report. Filtered Multi-Selection Control is available in System Reporter on many reports for various object selections. For example, Select hosts, Select VVs. Table 41 Select QoS Rules Option Purpose All QoSRules The report includes all the QoS Rules that are included in the database.
Figure 33 Example of a Table Chart Lib Allows you to optionally select the charting package used by System Reporter. By default, the (Static) charting capabilities are used, but you can try out the unsupported (Dynamic) option providing you are using a browser that supports HTML5 canvas tags (the latest versions of Windows IE9, Firefox, and Google Chrome browsers currently offer this support). Chart Types Stacked charts stack data on top of each other so you can also see totals.
You can choose from the following chart types: • Stacked Bars Figure 34 Chart Using Stacked Bars • 96 Stacked Vert Bars Accessing and Creating Reports
Figure 35 Chart Using Stacked Vertical Bars • Stacked Area Figure 36 Chart Using Stacked Areas • Lines Creating Custom Reports 97
Figure 37 Chart Using Lines • Bars Figure 38 Chart Using Bars 98 Accessing and Creating Reports
• Vert Bars Figure 39 Chart Using Vert Bars Chart X Pixels You can explicitly specify the length in pixels of the X (category) axis of charts. If this is left blank the X axis length will be automatically chosen. If the length specified is too small, the chart may not be drawn. Chart Y Pixels You can explicitly specify the length in pixels of the Y (value) axis of charts. If this is left blank the Y-axis length will be automatically chosen.
Table 43 Time Format Option Purpose Auto Time format is chosen automatically based on the sample resolution. If resolution is Daily, the format includes the month, date, hours and minutes, for example: 11-29 08:32. If the resolution is hourly, the format includes the date, hours and minutes, for example: 29 08:32. If the resolution is High-Res, the format include date, hours, minutes and seconds, for example: 29 08:32:05.
Figure 40 Change Chart Type Menu for the Excel Client 4. 5. Choose the appropriate selection from the list of chart types, then select on the chart that you want to use to display the report data. Click OK. CAUTION: The Excel Chart controls are configured for the default Chart Type. If you change the default Chart Type, you may also need to modify other chart controls for optimal viewing.
1. Right-click in any data cell and click Data Range Properties in the shortcut menu that appears. Figure 41 Data Range Properties Shortcut Menu The External Data Range Properties dialog box appears. 2. Select the Refresh every checkbox and enter the desired value. Figure 42 External Data Range Properties Dialog Box 3. Click OK.
It is also possible to retain a chart for further reference. This can be done by moving the chart and the data sheet linked to that chart to new worksheets. See the instructions that follow for a detailed description of how to complete this procedure. To retain a chart for further reference 1. On the chart to be retained, right-click to bring up the shortcut menu. 2. On the shortcut menu, click Location (for Excel 2003) or Move Chart (for Excel 2007).
NOTE: The Visual Basic code for the Excel client is password protected to prevent accidental modification. For customers who would like to add their own code, the password is “password”. Please observe caution when considering using another password other than the default, since subsequent access would not be possible if knowledge of the altered password were to become unavailable for some reason.
To create a custom chart with the Percent spare used column in Excel 2003: 1. On the Dly PDSpace (1) sheet, click and drag to select the Time column (header cell and all data cells) and then CTRL-CLICK and drag to select the Percent spare used column. 2. On the Microsoft Excel 2003 main menu, click Insert and then Chart to bring up the Chart Wizard. 3. Use the chart wizard to create a new chart. a.
5 Interpreting Report metric Summary Report Figure 43 (page 106) shows a typical example of the metric that are provided by a Summary Report. Figure 43 Summary Report metric Table 45 (page 106) describes all of the metric available for Summary Reports. Only some of the metric described here are shown by default, the others depend on which columns are selected through the Select Summary Columns control (see “Select Summary Columns” (page 83)).
Table 45 Summary Report metric (continued) Metric Description iSCSI Host Ports Number of iSCSI host ports. Disk Ports Number of disk ports. RCIP Ports Number of RCIP ports. RCFC Ports Number of RCFC ports. Free Ports Number of free ports. FC 15K RPM PDs Number of FC 15K physical disks. FC 10K RPM PDs Number of FC 10K physical disks. NL 7K RPM PDs Number of 7K near line physical disks. SSD PDs Number of 150 SSD physical disks. PDs Number of PDs (physical disks) .
Table 45 Summary Report metric (continued) Metric Description Used PD Capacity GiB Used PD space. Total PD Capacity GiB Total PD space available. Shown by default. Free (FC 10,15K), (NL 7k), (SSD) Free space for a specified drive in GIBs. RPM PDS Capacity GiB Used (FC 10,15K), (NL 7k), (SSD) Used space for a specified drive type in GIBs. RPM PD Capacity GiB Total (FC 10,15K), (NL 7k), (SSD) Total space for a specified drive type in GIBs.
PD Space Reports PD (Physical Disk) Space reports show the amount of physical disk space composed of chunklets according to the usage types shown in Table 46 (page 109). Table 46 Chunklet Usage Types Usage Type Description Normal, Used, OK Chunklets allocated to logical disks and containing data that is currently accessible to the system. Normal, Used, Failed Chunklets allocated to logical disks and containing data but inaccessible because they are failed.
Table 47 CPG Space Usage Types (continued) Usage Type Description Admin Space GiB Amount of remaining Admin space available for currently allocated CPGs. Snap Space GiB Amount of remaining Snap space available for currently allocated CPGs. User Space GiB Amount of remaining User space available for currently allocated CPGs. Total Space GiB Total amount of remaining space available for currently allocated CPGs. Growth Space GiB Amount of space available for CPG growth.
Table 49 VV Space Report metric (continued) Metric Description Beginning with the HP 3PAR OS 2.3.1 release running the updatesnapspace command can be scheduled periodically on the HP 3PAR StoreServ Storage. Admin Used Space Admin (snapshot metadata) space that is used by the selected VVs. This is zero for Virtual Copy (snapshot) VVs. Admin Free Space Admin Rsvd Space that is not actually used. This is zero for Virtual Copy (snapshot) VVs.
Table 50 Performance metric for PD, Port, LD and VLUN Performance Reports (continued) Metric Description Queue Length Queue length at the sample time. Note that (unlike the other metric above), the queue length is an instantaneous measure at the sample time, not an average over the sample interval. Please note that due to the way that RCFC ports process data, the Queue Length may not be a valid measure. Avg Busy % The percentage of time that the object is busy (i.e.
Table 52 Node Cache Performance Report metric (continued) Metric Description Read Total Total number of reads. Not shown in charts. Write Hits Number of writes for which the page is already in cache AND is dirty (i.e., has previously written data that has not yet been flushed to disk). Write Misses Number of writes that miss in the cache. A write is considered a miss if the page is not in the cache or if the page is not dirty in the cache (see above). Write Total Total number of writes.
QoS Performance Reports Table 55 (page 114) describes the metric shown for QoS Performance.
NOTE: Adaptive Optimization report supports reporting for only one system at a time.
6 Configuring the System Reporter Policy Settings System Reporter enables you to edit HP 3PAR System Reporter policies, such as the sampling policies, add or remove storage servers from the database, and schedule reports. These actions can only be performed using a Web browser and cannot be performed using the System Reporter Excel client. The end of the chapter also describes how to edit the Apache HTTP Server configuration files, which hold the Apache HTTP Server Usernames and passwords.
Table 57 Sampling Policies (continued) Policy Default Default number of hours to keep Hi-Res samples (in force by default for all systems 24 unless specified otherwise on an individual basis) Default number of days to keep hourly samples (in force by default for all systems 7 unless specified otherwise on an individual basis) Default number of days to keep Adaptive Optimization hourly samples (in force 7 by default for all systems unless specified otherwise on an individual basis) Default number of days t
} ) NOTE: Please note that System Reporter does not support using Microsoft SQL with Linux systems. Editing Sampling Policies To edit a System Reporter database sampling policy: 1. Access HP 3PAR System Reporter by pointing your browser at the Web server where Apache HTTP Server and the HP 3PAR System Reporter Web server scripts are installed. The 3PAR System Reporter window appears. 2. 3. In the Extras Menu area, select Policy Settings.
Figure 46 Connection Dialog Box NOTE: See “About Apache HTTP Server Authorization and Access Control” (page 51) for more instructions on setting Apache HTTP Server to require a username and password in order to edit sampling policies. 6. In the New Value box, type a new value and then click Submit Query. The Sampling Policies window appears with the new value. 7. When finished editing policies, close the Sampling Policies window.
1. Point your browser at the Web server where Apache HTTP Server and the HP 3PAR System Reporter Web server scripts are installed. The 3PAR System Reporter main window appears. 2. Click Policy Settings in the Extras Menu area. The System Reporter Policies window appears. 3. 4. 5. 6. 7. Choose the InServ Systems tab. Click Remove InServ. Choose the storage server from the drop-down list and then click Submit Query. An alert window appears confirming that the system was removed.
Configuring Rules for Email Alerts System Reporter can be configured to evaluate numerous rules and generate email alerts to specified recipients for each rule whose conditions are met. Adding an Alert Rule To add an alert rule: 1. Point your browser at the Web server where Apache HTTP Server and the HP 3PAR System Reporter Web server scripts are installed. The 3PAR System Reporter main window appears. 2. Click Policy Settings in the Extras Menu area. The 3PAR System Reporter Policies window appears. 3.
7. 8. An alert window appears confirming that the alert rule has been changed. Click OK to return to the Sampling Policies window. Removing an Alert Rule To remove an alert rule: 1. Point your browser at the Web server where Apache HTTP Server and the HP 3PAR System Reporter Web server scripts are installed. The 3PAR System Reporter main window appears. 2. Click Policy Settings in the Extras Menu area. The 3PAR System Reporter Policies window appears. 3. 4. 5. 6. 7. 8. Choose the Alert Rules tab.
Table 58 Data Table (continued) Data Table Description statpd_fc15sum Represents the aggregation of all the FC 15K RPM PDs in the HP 3PAR StoreServ Storage. statpd_ssd150sum Represents the aggregation of all the SSD PDs of speed 150 in the HP 3PAR StoreServ Storage. statld Logical Disk performance table. statvlun VLUN performance table. statcpu CPU performance table. statqos QoS Performance Table Resolution The resolution of data table on which the rule operates.
Table 60 Metric (continued) metrics Description Data Tables statpd_ssd150, statpd_sum, statpd_nl7sum, statpd_fc10sum, statpd_fc15sum, statpd_ssd150sum, statld, statvlun write_kbps Write KBytes/sec statport, statport_nodesum, statport_syssum, statpd, statpd_nl7, statpd_fc10, statpd_fc15, statpd_ssd150, statpd_sum, statpd_nl7sum,statpd_fc10sum, statpd_fc15sum,statpd_ssd150sum, statld, statvlun total_kbps Total (read + write) KBytes/sec statport, statport_nodesum, statport_syssum, statpd, statpd_nl7, s
Limit Value Specifies the value that the Metric is compared to. This should be a number. Limit Count The alert will only be generated if the number of objects for which the Metric exceeds the Limit Value (in the direction specified by Direction) is greater than Limit Count in any given sample. This should be an integer. Condition Specifies the condition (min_read_iops, min_write_iops, min_total_iops) that should be monitored. Condition Value Specifies the condition value.
Figure 49 Scheduled Reports Window Scheduled reports offer the following advantages: • Allows quick access to pre-configured reports on a scheduled basis instead of keeping active tabs in a web browser. • Allows the generation of reports to take place in the background at off-peak times to minimize impact on system performance.
5. Specify the report directory. This is the name of the directory under the top-level directory for scheduled reports (htdocs/ 3par/scheduledreports/). You can specify multiple reports within a report directory and each of these reports will have its own subdirectory. 6. 7. 8. 9. 10. 11. 12. 13. Specify the report name. Specify the report schedule. Hold the CTRL key to pick multiple dates and times. The minimum possible granularity of a scheduled report is one hour.
4. Click Remove Scheduled Report. The Select Scheduled Report to Remove window appears. 5. 6. 7. Choose the scheduled report to remove from the pull down list. When done, click Submit Query. An alert window appears confirming that the scheduled report has been deleted. Click OK to return to the Sampling Policies window. Configuring Adaptive Optimization An optionally licensed Adaptive Optimization component is included with System Reporter that can be used to monitor and optimize storage utilization.
The SMTP location for sending email for scheduled reports is in: /var/www/cgi-bin/3par-rpts/config.tcl Modifying the Apache HTTP Server Configuration Files You must modify the Apache HTTP Server config.tcl files located in the 3par-policy and 3par-rpts subdirectories whenever you change MySQL user names and passwords. 1. Go to the Apache HTTP server cgi-bin directory and locate the 3par-policysubdirectory (for example: C:\Program Files\ApacheGroup\Apache2\cgi-bin\3par-policy). 2.
7 Web Queries About Web Queries System Reporter Web queries to the System Reporter Web server have the following basic format: http:///cgi-bin/3par-rpts/ inserv_perf.exe?report=[&
Figure 50 System Reporter Version Report This query returns a 3x3 table with the column headers Category, Major, and Minor. The two rows after the header contain major and minor numbers for Product and ReportData. The Product version numbers are informational only and are the numbers assigned to the product when it is released. The Product version number is not necessarily related to the ReportData version.
Report Options Options are included in the query URL by using the following syntax:
DiskType Compares selected disk types. This value is only available for the pd_perf_time, ld_space_time and pd_space_time reports. DiskSpeed Compares selected disk speeds. This value is only available for the pd_perf_time and pd_space_time reports. RaidType Compares selected RAID types. This value is only available for the ld_space_time report. n:s:p Compares selected port positions. For this value, an escape sequence may be required to retain spacing and special characters (for example: n%3As%3Ap).
Compares selected disk magazine position. This value is only available for the pd_space_time report. example: The following example specifies that all logical disks are compared: &compare=LD comparesel When the compare option (see “compare” (page 132)) is used, up to 16 objects can be compared. However, if there are more than 16 objects selected, then the comparesel option is used to select a metric. The 16 objects with the highest peak values of the metric are chosen to be compared.
The virtual size. table Use the table option to specify a table from which data is returned when using one of the objects_present reports (see “Objects Present Reports” (page 172)). This option can only be specified once in a given query string. values: Specify one of the following: ldspace Returns values from the ldspace database tables. pdspace Returns values from the pdspace database tables. vvspace Returns values from the vvspace database tables. statpd Returns values from the statpd database tables.
example: The following example specifies that the report is to be reloaded every 2 minutes: &refresh=2 charttab Use the charttab option to specify whether to post the results in tabular format, as charts, or both. The number of charts and/or tables used to post the results depend on the report type. This option can only be specified once in a given query string. values: Specify one of the following: chart Specifies that results will be displayed in the form of one or more charts.
Specifies that charts will use stacked vertical bars. Stacked charts stack data on top of each other so you can see the total as well. See Figure 35 (page 97) for an example of a chart using stacked vertical bars. stackedarea Specifies that charts will use stacked areas instead of stacked bars. See Figure 36 (page 97) for an example of a chart using stacked areas. bars (Default). Specifies that bar charts will be used. See Figure 38 (page 98) for an example of a bar chart.
graphlegpos Use the graphlegpos option to specify the position of the chart legend. If not defined, the legend position is selected automatically based on the charttype. This option can only be specified once in a given query string. value: bottom The legend is placed below the chart. right The legend is placed to the right of the chart. example: The following example specifies that the chart legend should be to the right of the chart.
example: The following example specifies that all the time axis points should be labelled: &alllabels=1 timeform Use the timeform option to specify a time format (either relative or absolute) when using a report that requires a time range. This option can only be specified once in a given query string.
If is non-negative it represents a point in time, expressed as the number of seconds since January 1, 1970, GMT. For example, to express 2005/07/13 11:00:34 as a value, use the value 1121277634. If is negative, it represents a point in time seconds before the current time. NOTE: You can use the sample_times report (see “sample_times” (page 182)) to see tsecs values paired with times expressed using an easier-to-read format.
Domain Group results by domain. Host Group results by hosts. CPG Group results by Common Provisioning Group (CPG) name. UsrCPG Group results by Common Provisioning Group (CPG) name for the User Space of VVs. SnpCPG Group results by Common Provisioning Group (CPG) name for the Snap Space of VVs. VV Group results by Virtual Volume (VV) name. VVType Group results by Virtual Volume (VV) Type. ProvType Group results by virtual volume (VV) provisioning type. LD Group results by Logical Disk (LD) name.
PortType Group results by port type. example: The following example specifies that results should be grouped by system: &groupby=System The following example specifies that results should be grouped by system, drive magazine, and physical disk ID: &groupby=System&groupby=Mag&groupby=PDID orderby Use the orderby option to determine how to order results. The orderby option can be used multiple times in the same query string.
PortNode Order results by port node number (The n part in n:s:p). RaidType Order results by RAID level (for example, RAID 0, RAID1, RAID 5 and RAID 6). LDUsage Order results by logical disk usage. See Table 29 (page 90) for a list of these usage types. DiskType Order results by physical disk type. DiskSpeed Order results by physical disk speed. CageID Order results by drive cage ID number. Mag Order results by magazine position within the drive cage (0 through 7).
Order results by CPU context switches/sec. VirtSize Order results by VV virtual size. TotalRsvdSize Order results by VV reserved space size. TotalRawSize Order results by VV total raw reserved space size. LDSize Order results by total LD size. LDFreeSize Order results by total free LD size. LDRawSize Order results by total raw LD size. TotalAccesses Order results by total number of accesses to the VV. ReadHit% Order results by total read hit percentage to the VV.
example: The following example specifies that the histogram should include all accesses: &histbegin=1 ldspaceunit Use the ldspaceunit option to determine the unit of measure for logical disk space reports. This option can only be specified once in a given query string. values: Specify one of the following: MiB (2^20 bytes) (Default). Use megabytes (1,048,576 bytes) as the logical disk space unit.
See “ldspaceunit” (page 145). GiB (2^30 bytes) See “ldspaceunit” (page 145).
value: Specify one or more of the following: --All cage IDs-(Default). Does not exclude cages based on their cage IDs. This value consists of a drive cage ID.
SPR_AVAIL_FAIL Include only spare available (unused) chunklets that have failed.
seldisktype Use the seldisktype option to select a disk type. value: Specify one or more of the following: --All Disk Types-(Default). This value does not exclude disks based on their type. FC This value allows you to include only Fibre Channel type disks. NL This value allows you to include only Near Line type disks.
seldomain Use the seldomain option to select a domain according to the domain name. value: Specify one or more of the following: --ALL Domains-(Default). Does not exclude any domain based on domain names. This value consists of a storage server domain name.
The following example specifies including only VLUNs exported to host winhost1 or winhost2: &selhost=winhost1&selhost=winhost2 selld Use the selld option to select logical disks according to their LD names. value: Specify one or more of the following: --All LDs-(Default). Does not exclude logical disks based on their names. This value consists of a logical disk name.
example: The following example includes logical disks of all usage types: &sellduse= The following example specifies only logging logical disks: &sellduse=log selnode Use the selnode option to select controller nodes according to their numbers (0-7). value: Specify one or more of the following: --All Nodes-(Default). Specifies that nodes are not to be excluded based on their names. This value consists of a controller node number (value is an integer between 0 and 7).
example: The following example shows two ways to specify that no ports are to be excluded based on location: &selnsp= OR &selnsp=--All%20Ports-- The following example specifies that only port 0:1:1 will be included: &selnsp=0%3A1%3A1 selpdid Use the selpdid option to select physical disks according to the physical disk ID. value: Specify one or more of the following: --ALL PDIDs-(Default). Do not exclude PDs based on their ID number. This value consists of a physical disk ID number.
example: The following example shows two ways to specify that physical disks are not to be excluded based on their states: &selpdstate= OR &selpdstate=--All%20PD%20States-- The following example specifies that only physical disks with a current state of Not valid should be used: &selpdstate=Not%20valid selporttype Use the selporttype option to select ports according to their type. values: Specify one or more of the following: --All Port Types-(Default). All port types are selected.
Specify this value to include RAID 1 logical disks. 5 Specify this value to include RAID 5 logical disks. 6 Specify this value to include RAID 6 logical disks. example: The following example specifies inclusion of all logical disks regardless of RAID level: &selraidtype= The following example includes RAID 1 and RAID 5 logical disks only: &selraidtype=1&selraidtype=5 selsys Use the selsys option to select a particular storage system. values: Specify one or more of the following: --All Systems-(Default).
example: The following example shows two ways to specify that volumes be included regardless of name: &selvv= OR &selvv=--All%20VVs-- The following example includes volumes with names vol1, vol2, and vol3 only: &selvv=vol1&selvv=vol2&selvv=vol3 selvvtype Use the selvvtype option to specify virtual volumes according to their types. values: Specify one or more of the following: --All VV Types-(Default). Does not exclude virtual volumes based on their types. base Select base VVs.
selqosrule Use the selqosrule option to specify qos rules according to their names. values: Specify one or more of the following: --All QosRules-(Default). Does not exclude qos rules based on their names. This value consists of a qos rule name. Chartlib dynamic chartlib=rgraph Allows you to toggle between static chart and dynamic (experimental) chart. static (default) chartlib=gdgraph Allows you to toggle between static chart and dynamic (experimental) chart.
Summary Report summary Shows summary information for all systems. example: The following example shows the entire query string for a summary report: http://localhost/cgi-bin/3par-rpts/ inserv_perf.exe?category=daily&pdspaceunit=Chunklets&report=summary Space Reports pd_space_time Plots the total number of chunklets of different types summed over the specified systems and PDs over a period of time (x-axis). Can show the rate of usage of raw space.
ld_space_group Plots the raw, used and free LD space (on y-axis) at a specific time summed over (grouped by) any combination of several parameters. example: The following example shows the entire query string for an ld_space_group report: http://localhost/cgi-bin/3par-rpts/ inserv_perf.
selsys=--All%20Systems--&selcpg=--All%20CPGs--&selvv=--All%20VVs--& report=vv_space_time vv_space_group Plots the virtual size as well as the raw and LD space used by the user, snap and admin (on yaxis) at a specific time, summed over (grouped by) any combination of parameters (for example, system, volume, etc.). For the LD space, it separates free and used space. example: The following example shows the entire query string for a vv_space_group report: http://localhost/cgi-bin/3par-rpts/ inserv_perf.
pd_svt_hist Plots the service time histogram of all the physical disks in the selected systems at a specific time. example: The following example shows the entire query string for a pd_svt_hist report: http://localhost/cgi-bin/3par-rpts/ inserv_perf.
port_svt_hist Plots the service time histogram of all the ports in the selected systems at a specific time. example: The following example shows the entire query string for a port_svt_hist report: http://localhost/cgi-bin/3par-rpts/ inserv_perf.
ld_svt_hist Plots the service time histogram of all the logical disks in the selected systems at a specific time. example: The following example shows the entire query string for a ld_svt_hist report: http://localhost/cgi-bin/3par-rpts/ inserv_perf.exe?charttab=chart&charttype=stackedbars&category=daily&begintsecs=& selsys=--All%20Systems--&selld=--All%20LDs--&histbegin=1&report=ld_svt_hist ld_svt_histvstime Plots the service time histogram of all the logical disks in the selected systems versus time.
vlun_svt_hist Plots the service time histogram of all the VLUNs (exports) in the selected systems at a specific time. example: The following example shows the entire query string for a vlun_svt_hist report: http://localhost/cgi-bin/3par-rpts/ inserv_perf.
example: The following example shows the entire query string for a cpu_perf_time report: http://localhost/cgi-bin/3par-rpts/ inserv_perf.exe?charttab=chart&charttype=stackedbars&category=daily&begintsecs=& endtsecs=&timeform=absolute&selsys=--All%20Systems--&selnode=--All%20Nodes--& report=cpu_perf_time cpu_perf_group Plots the CPU performance metric in the selected systems and nodes at a specific time, grouped by system and/or node.
regiondensity example The following example shows the entire query string for a regiodensity report: http://localhost/cgi-bin/3par-rpts/ inserv_perf.exe?charttab=chart&charttype=stackedbars&begintsecs=-10800& selsys=3par1&report=regiodensity regmoves Returns a report showing the amount of data moved by Adaptive Optimization between various tiers over the requested interval (from begintsecs to endtsecs).
Figure 51 Valid Options for Summary, Space and Adaptive Optimization Reports (I) Options Available by Report 167
Figure 52 Valid Options for Summary, Space and Adaptive Optimization Reports (II) 168 Web Queries
Figure 53 Valid Options for Summary, Space and Adaptive Optimization Reports (III) Figure 54 Valid Options for Performance Reports (I) Options Available by Report 169
Figure 55 Valid Options for Performance Reports (II) 170 Web Queries
Figure 56 Valid Options for Performance Reports (III) Figure 57 Valid Options for Performance Reports (IV) Options Available by Report 171
Objects Present Reports Objects present reports return the objects present in a table over a specified time for use in user interface controls. For example, to allow the user to select a display of PD space usage at a particular time, you would need to know which times, systems, and PD IDs are present in a table. Sort order of columns is ascending, starting with the left column, then the next to the right, and so on.
Table 61 Objects Present Report table values (continued) Report table values objects_present&“objectpres= host_name” (page 176) statvlun objects_present&“objectpres= ld_name” (page 176) ldspacestatld objects_present&“objectpres=node” (page 177) statcpu objects_present&“objectpres=pdid” (page 177) pdspacestatpd objects_present&“objectpres=port” (page 178) statpdstatvlunstatport objects_present&“objectpres= system” ldspacepdspacevvspacestatcpustatpdstatportstatldstatvlunstatvvcmp (page 179) object
objectpres= cpg_name Returns a list of common provisioning group (CPG) names. example: The following example shows the entire query string for: objects_present&objectpres=cpg_name http://localhost/cgi-bin/3par-rpts/ inserv_perf.exe?report=objects_present&objectpres=cpg_name&table=ldspace& category=hires output: Returns a row for each common provisioning group on each system. Output columns are: • System: the system name • CPG: common provisioning group name.
objects_present&objectpres=diskspeed http://localhost/cgi-bin/3par-rpts/ inserv_perf.exe?report=objects_present&objectpres=diskspeed&table=statpd& category=daily output: Returns a row for each disk speed on each system. Output columns are: • System: the system name • DiskSpeed: list of disk speed objectpres= disktype Returns a list of disk types. example: The following example shows the entire query string for: objects_present&objectpres=disktype http://localhost/cgi-bin/3par-rpts/ inserv_perf.
output: Returns a row for each domain present over the time range on each system. Output columns are: • System: the system name • Domain: domain names objectpres= host_name Returns a list of host names. example: The following example shows the entire query string for: objects_present&objectpres=host_name http://localhost/cgi-bin/3par-rpts/ inserv_perf.
output: Returns a row for each logical disk present over the time range for each system. Output columns are: • System: the system name • LD: logical disk names The following is example output of the query: objectpres=node Returns a list of controller node numbers. example: The following example shows the entire query string for: objects_present&objectpres=node http://localhost/cgi-bin/3par-rpts/ inserv_perf.
example: The following example shows the entire query string for: objects_present&objectpres=pdid: http://localhost/cgi-bin/3par-rpts/ inserv_perf.exe?report=objects_present&objectpres=pdid&table=pdspace& category=daily output: Returns a row for each physical disk present over the time range for each system. Output columns are: • System: the system name • PDID: physical disk ID numbers The following is example output of the query: objectpres=port Returns a list of ports.
objectpres= system Returns a list of storage systems. example: The following example shows the entire query string for objects_present&objectpres=system using: http://localhost/cgi-bin/3par-rpts/ inserv_perf.exe?report=objects_present&objectpres=system&table=pdspace& category=daily output: Returns a row for each system present over the time range for each system.
Output columns are: • System: system name • VV: virtual volume names The following is example output of the query: objectpres= vv_name_nosnap Returns a list of virtual volume names, excluding snapshot volumes. example: The following example shows the entire query string for: objects_present&objectpres=vv_name_nosnap http://localhost/cgi-bin/3par-rpts/ inserv_perf.
example: The following example shows the entire query string for: objects_present&objectpres=porttype http://localhost/cgi-bin/3par-rpts/ inserv_perf.exe?report=objects_present&objectpres=porttype&table=statport& category=daily output: Returns a row for each time sample in the given table for the given category (resolution).
Objects in statqosinv_hires_1, system_4 'SRV400 qos_set3 'SRV400 vvset0.1 'SRV400 vvset0.2 'SRV400 vvset0.3 sample_times Returns valid times of database samples. example: The following example shows the entire query string for: sample_times http://localhost/cgi-bin/3par-rpts/ inserv_perf.exe?report=sample_times&category=daily&table=pdspace output: Returns a row for each time sample in the given table for the given category (resolution).
8 Using Adaptive Optimization If you have an Adaptive Optimization license, you can use the Adaptive Optimization feature in conjunction with System Reporter to optimize storage utilization across multiple tiers. NOTE: Adaptive Optimization in System Reporter 3.1 MU2 is supported only by HP 3PAR OS versions 2.3.1 MU1 through 3.1.1. Adaptive Optimization is implemented within HP 3PAR OS for HP 3PAR OS versions 3.1.2 and later. HP recommends that you upgrade the Storage System to at least 3.1.
System Reporter can generate a number of different reports that you can use to track storage utilization and monitor the movement of data performed by Adaptive Optimization. See “Creating Custom Reports” (page 68) for details on generating reports.
3. Click the Adaptive Optimization tab. The Adaptive Optimization Configuration window appears (Figure 60 (page 185)). Figure 60 Adaptive Optimization Configuration Main Window The following information is provided for each Adaptive Optimization configuration: • Id -- A unique identification number assigned automatically to the configuration when it is created. • InServ -- Name of the HP 3PAR StoreServ Storage for which the configuration is implemented.
NOTE: When you specify two tiers, for the purposes of analysis and data movement only the order of the tiers matters, not the actual tier number. For example specifying tiers 0 and 1 is equivalent to specifying 0 and 2 or 1 and 2. The lower numbered tier is considered the faster tier and the higher numbered tier is considered the slower tier.
except in the case where the CPG is the default for snapshot or base TPVV allocation as noted in the following caution. CAUTION: For some CPGs, especially those that use small PDs such as SSDs, the additional buffer space in the CPG may be too large to be left unused. To minimize the buffer space you can use the CLI to set the CPG grow size to the smallest possible value.
not be optimal. We can achieve optimal results by scheduling adaptive optimization execution for 11 am Monday through Friday with a measurement interval of 3 or 4 hours. That way only performance measurements during the important period for the application will be considered. NOTE: The measurement hours selected should not exceed the retention time for adaptive optimization samples set in the sampling policies (see “Editing Sampling Policies” (page 118)).
9. Choose whether the configuration is to be currently active (true/false). This switch allows you to turn the optimization off and on as required. 10. When done, click Submit Query. An alert window appears confirming that Adaptive Optimization configuration has been added. 11. Click OK to return to the Sampling Policies window. Changing an Adaptive Optimization Configuration To change an Adaptive Optimization configuration: 1.
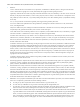
Figure 61 Region IO Density Showing Total Space Figure 62 Region IO Density Showing Total IO Access Each region is put into the appropriate histogram bucket on the X-axis based on its IO access rate during the specified time period. The Y-axis (value) for the first chart is the total space for the regions in the histogram bucket, and the Y-axis (value) for the second chart is the total IO accesses/min for the regions in the histogram bucket.
Figure 63 Region IO Density without Adaptive Optimization You can see that much of the space is used for regions with very few IO accesses and that most of the IO accesses are handled by a very small number of regions. Adaptive Optimization would work very well in this situation since the busiest regions would be moved to the fastest tier and the most idle regions would be moved to the slowest tier.
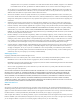
Figure 65 VV Tiers Report Adaptive Optimization Space Moved Report The Space Moved report shows the space moved over a selected time interval for each Adaptive Optimization configuration (Figure 66 (page 192)). Figure 66 Space Moved Report The space moved between tiers represents a performance overhead for Adaptive Optimization since it takes system resources and disk bandwidth to move data between tiers.
report shows the space moved over the selected time interval for each Adaptive Optimization configuration. The showvvcpg CLI extension Adaptive Optimization may move regions of a VV into different CPGs. To easily view the available VV space in each tier, the System Reporter 3.1 MU2 CD includes a CLI script file showvvcpg.tcl, that adds a new CLI command when it is sourced from the CLI. Once you start the CLI and connect to the HP 3PAR StoreServ Storage array, you can source the showvvcpg.
esx-sysrpt esx-fc-r1 384 - 112128 - - esx-sysrpt esx-ssd-r1 128 - 7680 - - esx-sqa esx-fc-r1 384 - 44544 - - esx-sqa esx-ssd-r1 128 - 1536 - - esx-sw esx-fc-r1 224 - 249088 - - esx-sw esx-ssd-r1 288 - 16512 - - esx-rdm-mysqlserver esx-fc-r1 384 1024 44032 - - esx-rdm-mysqlserver esx-ssd-r1 128 - - - - esx-rdm-dev-oracle esx-fc-r1 384 1024 78848 - - esx-rdm-dev-oracle esx-ssd-r1 128 - 7168 - - esx-rdm-sysreporterfield esx-fc-r1 320 - 470400 - - esx-rdm-sysreporterfield esx-ssd-r1 448 - 896 - - --------------
9 Database Schema Using The Database Schema The description of the database schema is provided as a convenience to those wishing to query the database directly instead of using the web queries described in “Web Queries” (page 130).
Table 63 sampleinserv_5 Table Column Type Comment name VARCHAR(64) NOT NULL IP address of the system to sample. usessl INTEGER NOT NULL Determines whether CLI connections to the HP 3PAR StoreServ Storage will use SSL. 0 - Do not use SSL 1 - Use SSL cliport INTEGER NOT NULL Currently unused. In future this will be used to explicitly specify the port number to use for the CLI connection to the system.
Table 64 system_4 Table (continued) Column Type Comment system_model VARCHAR(32) NOT NULL System hardware model, for example: InServ S400X InServ T400 CHSIZEMB INTEGER NOT NULL Indicates the chunklet size. The alertconfig Table The alertconfig_2 table contains a row for each alert configuration rule. Table 65 alertconfig_2 Table Column Type Comment alertid INTEGER PRIMARY KEY (AUTO_INCREMENT) A unique identifier for each rule.
Table 66 scheduled_report_2 Table Column Type Comment rpt_id INTEGER PRIMARY KEY (AUTO_INCREMENT) A unique identifier for each scheduled report. rpt_dir VARCHAR(64) NOT NULL The top level report directory (under the 3par/ scheduledreports/ directory). rpt_name VARCHAR(64) NOT NULL The report name. A sub-directory of this name is created (under the rpt_dir directory) in which all scheduled reports are created. rpt_sched VARCHAR(500) NOTNULL The schedule for this report.
Table 68 adprovconfig_1 Table (continued) Column Type Comment T0_GB INTEGER NOT NULL Maximum size of the storage space that can be used for the T0 tier T1_GB INTEGER NOT NULL Maximum size of the storage space that can be used for the T1 tier T2_GB INTEGER NOT NULL Maximum size of the storage space that can be used for the T2 tier ap_sched VARCHAR(200) NOT NULL The schedule for when this adaptive optimization configuration should be run.
Table 70 ldrgmoves_1 Table Column Type Comment sched_tsecs INTEGER NOT NULL Time in secs when the LD region move was scheduled. This is the Unix time and is the number of seconds since 0:00:00 Jan 1, 1970 GMT. sys_uid INTEGER NOT NULL A unique identifier for the system instance that refers to the uniq_id for the system instance in the system_4 table. adprovid INTEGER PRIMARY KEY (AUTO_INCREMENT) A unique identifier for each adaptive optimization configuration.
Table 71 recentsample_1 Table Column Type Comment resolution VARCHAR(32) NOT NULL The sample resolution, one of hires, hourly or daily. tsecs INTEGER NOT NULL Sample time in secs of the most recent complete sample of the resolution. This is the Unix time and is the number of seconds since 0:00:00 Jan 1, 1970 GMT. The Sample Data and Inventory Tables The sample data tables include the space and performance samples of various objects in the systems.
Table 72 pdspace__3 Table (continued) Column Type Comment NRM_USED_FAIL INTEGER NOT NULL Number of normal chunklets that were used in LDs but have failed. NRM_AVAIL_CLEAN INTEGER NOT NULL Number of normal unused chunklets that have been initialized. These are free for use in new LDs. NRM_AVAIL_DRTY INTEGER NOT NULL Number of normal unused chunklets that have not yet been initialized. These will be free for use in new LDs after the system has had time to initialize them.
The ldspace Table The ldspace__3 table holds logical disk (LD) space data samples. Table 74 ldspace__3 Table Column Type Comment tsecs INTEGER NOT NULL Sample time in secs. This is the Unix time and is the number of seconds since 0:00:00 Jan 1, 1970 GMT. sys_uid INTEGER NOT NULL A unique identifier for the system instance refers to the uniq_id for the system instance in the system_4 table. dom_name VARCHAR(32) NOT NULL The domain name that the LD belongs to.
Table 75 ldspaceinv__3 Table Column Type Comment tsecs INTEGER NOT NULL Sample time in secs. This is the Unix time and is the number of seconds since 0:00:00 Jan 1, 1970 GMT. sys_uid INTEGER NOT NULL A unique identifier for the system instance refers to the uniq_id for the system instance in the system_4 table. dom_name VARCHAR(32) NOT NULL The domain name that the LD belongs to. If the LD is not assigned to a domain, this column contains the value “-”.
Table 76 vvspace__4 Table (continued) Column Type Comment provv_type VARCHAR(32) NOT NULL The provisioning type of the VV (see the Prov column for the showvv CLI command in HP 3PAR OS 2.3.1 or later). vv_type VARCHAR(32) NOT NULL The VV Type (see the Type column for the showvv CLI command for HP 3PAR OS 2.3.1 or later). copyof VARCHAR(32) NOT NULL The name of the VV that this VV is a copy of. vv_state VARCHAR(32) NOT NULL The state of the VV.
Table 76 vvspace__4 Table (continued) Column Type Comment usr_rawrsvd_mb DOUBLE PRECISION NOT NULL Raw (physical space including RAID overhead) user space reserved for the VV in MB. usr_used_mb DOUBLE PRECISION NOT NULL User space used by the VV in MB. usr_zn DOUBLE PRECISION NOT NULL User zones in the VV. usr_free_zn DOUBLE PRECISION NOT NULL Free user zones in the VV. The vvspaceinv Table The vvspaceinv__4 table holds the inventory for the vvspace__4 table.
Table 78 cpgspace__2 Table Column Type Comment tsecs INTEGER NOT NULL Sample time in secs. This is the Unix time and is the number of seconds since 0:00:00 Jan 1, 1970 GMT. sys_uid INTEGER NOT NULL A unique identifier for the system instance refers to the uniq_id for the system instance in the system_4 table. dom_name VARCHAR(32) NOT NULL The domain name that the CPG belongs to. If the CPG is not assigned to a domain, this column contains the value “-”.
Table 78 cpgspace__2 Table (continued) Column Type Comment rawfree_mb DOUBLE PRECISION NOT NULL The raw free space available for the CPG. usablefree_mb DOUBLE PRECISION NOT NULL The usable free space available for the CPG. The cpgspaceinv Table The cpgspaceinv__2 table holds the inventory for the cpgspace_2 table. Table 79 cpgspace__2 Table Column Type Comment tsecs INTEGER NOT NULL Sample time in secs.
Table 80 Common Performance Columns (continued) Column Type Comment d_qlen DOUBLE PRECISION NOT NULL Difference between qlen value from last sample for the same object. busy DOUBLE PRECISION NOT NULL Time in microsecs that the device has been busy. d_busy DOUBLE PRECISION NOT NULL Difference between busy value from last sample for the same object. rcount DOUBLE PRECISION NOT NULL Total number of reads since the object was first created or restarted.
Table 80 Common Performance Columns (continued) Column Type Comment rhist0 DOUBLE PRECISION NOT NULL Number of reads in service time bucket number 0. d_rhist0 DOUBLE PRECISION NOT NULL Difference between rhist0 value from last sample for the same object. ... ... ... rhist31 DOUBLE PRECISION NOT NULL Number of reads in service time bucket number 31. d_rhist31 DOUBLE PRECISION NOT NULL Difference between rhist31 value from last sample for same object.
Table 81 Common Performance Metrics for a Sample Row Metric SQL Expression Read IOPs/s CASE WHEN d_now > 0 THEN d_rcount * 1000000.0/d_now ELSE 0 END Write IOPs/s CASE WHEN d_now > 0 THEN d_wcount * 1000000.0/d_now ELSE 0 END Total IOPs/s CASE WHEN d_now > 0 THEN (d_rcount + d_wcount) * 1000000.0/d_now ELSE 0 END Read KBytes/sec CASE WHEN d_now > 0 THEN d_rbytes * 1000.0/d_now ELSE 0 END Write KBytes/sec CASE WHEN d_now > 0 THEN d_wbytes * 1000.
Table 82 statpd__4 Table Column Type Comment tsecs INTEGER NOT NULL Sample time in secs. This is the Unix time and is the number of seconds since 0:00:00 Jan 1, 1970 GMT. sys_uid INTEGER NOT NULL A unique identifier for the system instance refers to the uniq_id for the system instance in the system_4 table. pdid INTEGER NOT NULL The physical disk ID. port_n INTEGER NOT NULL The node that the disk’s primary port is connected to (the “n” part of n:s:p).
Table 84 statld__5 Table Column Type tsecs INTEGER NOT NULL Sample time in secs. This is the Unix time and is the number of seconds since 0:00:00 Jan 1, 1970 GMT. sys_uid INTEGER NOT NULL A unique identifier for the system instance refers to the uniq_id for the system instance in the system_4 table. dom_name VARCHAR(32) NOT NULL ldid INTEGER NOT NULL The logical disk ID. ld_name VARCHAR(32) NULL This is to preserve the LD.
Table 86 statport__4 Table (continued) Column Type Comment port_p INTEGER NOT NULL The port number in the PCI slot in the node that the port is connected to (the “p” part of n:s:p). porttype VARCHAR(32) NOT NULL The port type. Currently, the port types are: • disk - Fibre channel ports that disks are connected to. • host -.Fibre channel ports that hosts are connected to (directly or through a fabric). • rcip - Remote Copy IP ports. • rcfc - Remote Copy fibre channel ports.
Table 88 statvlun__4 Table Column Type Comment tsecs INTEGER NOT NULL Sample time in secs. This is the Unix time and is the number of seconds since 0:00:00 Jan 1, 1970 GMT. sys_uid INTEGER NOT NULL A unique identifier for the system instance refers to the uniq_id for the system instance in the system_4 table. dom_name VARCHAR(32) NOT NULL The domain name that the VLUN belongs to. If the VLUN is not assigned to a domain, this column contains the value “-”.
The statvvcmp Table The statvvcmp__2 table holds VV cache performance data samples. Table 90 statvvcmp__2 Table Column Type Comment tsecs INTEGER NOT NULL Sample time in secs. This is the Unix time and is the number of seconds since 0:00:00 Jan 1, 1970 GMT. sys_uid INTEGER NOT NULL A unique identifier for the system instance refers to the uniq_id for the system instance in the system_4 table. dom_name VARCHAR(32) NOT NULL The domain name that the VV belongs to.
Table 92 statcpu__1 Table Column Type Comment tsecs INTEGER NOT NULL Sample time in secs. This is the Unix time and is the number of seconds since 0:00:00 Jan 1, 1970 GMT. sys_uid INTEGER NOT NULL A unique identifier for the system instance refers to the uniq_id for the system instance in the system_4 table. node INTEGER NOT NULL The node number. cpu INTEGER NOT NULL The CPU number in the node. usert DOUBLE PRECISION NOT Jiffies (0.01 sec) in user mode.
The statlink Table The statlink__2 table holds the inter-node link performance data samples. Table 94 statlink__2 Table Column Type Comment tsecs INTEGER NOT NULL Sample time in secs. This is the Unix time and is the number of seconds since 0:00:00 Jan 1, 1970 GMT. sys_uid INTEGER NOT NULL A unique identifier for the system instance refers to the uniq_id for the system instance in the system_4 table.
Table 96 statldrg_hourly_2 Table Column Type Comment tsecs INTEGER NOT NULL Sample time in secs. This is the Unix time and is the number of seconds since 0:00:00 Jan 1, 1970 GMT. sys_uid INTEGER NOT NULL A unique identifier for the system instance refers to the uniq_id for the system instance in the system_3 table. ldid INTEGER NOT NULL The logical disk ID of the LD region. ldoffmb INTEGER NOT NULL Offset in MiB of the LD region. vvid INTEGER NOT NULL The VV ID for the LD region.
Table 99 space_timeinv__1 Table Column Type Comment tsecs INTEGER NOT NULL Sample time in secs. This is the Unix time and is the number of seconds since 0:00:00 Jan 1, 1970 GMT. sys_uid INTEGER NOT NULL A unique identifier for the system instance that refers to the uniq_id for the system instance in the system_3 table.
Table 100 statqos__1 Table (continued) Column Type Comment lt_type INTEGER NOT NULL Latency Type lt_limit DOUBLE PRECISION NOT Latency Limit NULL lt_target DOUBLE PRECISION NOT Latency Target NULL lt_throttled DOUBLE PRECISION NOT Latency Throttled NULL throttle_type DOUBLE PRECISION NOT Throttle Type NULL io_quota DOUBLE PRECISION NOT IO Quota NULL bw_quota DOUBLE PRECISION NOT Bandwidth Quota NULL lt_goal DOUBLE PRECISION NOT Latency Goal NULL tl DOUBLE PRECISION NOT Throttle NUL
Table 100 statqos__1 Table (continued) Column Type Comment d_lt DOUBLE PRECISION NOT Difference between lt from last sample for the same object. NULL lt_delay DOUBLE PRECISION NOT Delay in latency. NULL d_lt_delay DOUBLE PRECISION NOT Difference between lt_delay from last sample for the same object. NULL Common Performance DOUBLE PRECISION NOT These columns are the common performance columns described columns NULL in “Common Performance Table Columns” (page 208).
Table 100 statqos__1 Table (continued) Column Type Comment d_delay_wcount DOUBLE PRECISION NOT Difference between delay_wcount value from last sample for the NULL same object. delay_wbytes DOUBLE PRECISION NOT Delay in total number of bytes written since the object was first NULL created or restarted. d_delay_wbytes DOUBLE PRECISION NOT Difference between delay_wbytes value from last sample for the NULL same object.
10 Troubleshooting System Reporter Troubleshooting Overview The first step when troubleshooting System Reporter is to identify the component that is causing problems (see Figure 2 (page 28) for the structure of System Reporter). • If there are problems in sampling components see “Troubleshooting the Sampling Components” (page 224). Examples of the types of problems encountered include: • The sampler service or daemon stops. • The sampler fails to sample data from a particular HP 3PAR StoreServ Storage.
Installation Configuration On Windows, you can see the parameters with which the sampler was installed by typing the following command in that directory (which should contain the winserv.exe file) as follows: # winserv.exe showconfig "3PAR System Reporter sampler" Configuration of 3PAR System Reporter sampler: -displayname 3PAR System Reporter sampler (managed by WinServ) -noninteractive -binary C:\Program Files\3PAR\System Reporter\winserv.
Errors incurred by the CLI sampler process. Errors incurred by the CLI sampler process may include loss of network connectivity to the HP 3PAR StoreServ Storage, a timeout because the CLI process took too long to get the data, or authentication failure on the CLI connection (the user was removed or password changed). In both cases, the sampleloop process restarts the inservsample process so, if the error is not persistent, sampling can resume.
to medium or low (see “Setting the Security Level for Excel” (page 58)) and reopen the workbook. • If you see a warning containing "internal state was inconsistent", the code has detected an inconsistency and has tried to recover, but may not be able to. If errors continue, go to the 3PAR menu and click Reset All. If errors persist, close and reopen the workbook. Entering and exiting Excel's design mode can cause these inconsistencies and should be avoided.
NOTE: The sysbck command is recommended when extracting a relatively small sampling of the database. The command creates a file with SQL statements to insert each row of extracted data into a database. While this is convenient for subsequently loading the data into a database, especially if the database is of a different type than the source database, the file size can be quite large.
NOTE: • The -dbouttype parameter is optional; by default, the extract database is MySQL.
• From SQLite to SQLite: sysbck -dbtype sqlite -db cliuser -dbouttype sqlite -scripttype both -backupfilename "c:/test/test_20100713_1322PM" -begintime "07/13/2010 12:45:00" -endtime "07/14/2010" -inservname s074:s138 • From SQLite to MySQL: sysbck -dbtype sqlite -dbhost istat -db cliuser -dbpwfile dbpwfile -dbouttype mysql -scripttype both -backupfilename "c:/test/test_20100713_1322PM" -begintime "07/13/2010 12:45:00" -endtime "07/14/2010" -inservname s074:s138 • From SQLite to MS SQL: sysbck -dbtype
• Issuing sysbck without a begin and end date (this will extract for all data for system s138): sysbck -dbtype oracle -dbhost istat -db cliuser -dbpwfile dbpwfile -backupfilename "c:/test/test_20100713_1322PM" -dbouttype mysql -inservname s138 -scripttype both • Issuing sysbck without a begin and end date and dbouttype (Note this will extract for all data for system s138; in this instance the extract will default to the MySQL extraction: sysbck -dbtype oracle -dbhost istat -db cliuser -dbpwfile dbpwfile
Dumping the Entire MySQL Database To create a dump of a MySQL database use the mysqldump program as follows # mysqldump --host=hostname --user=username --password=passwd --opt dbname > dbname.sql This creates a text file called dbname.sql that contains SQL commands to create the tables and insert the data into the tables. You can simply source this file into MySQL to recreate the entire database.
11 Support and Other Resources Contacting HP For worldwide technical support information, see the HP support website: http://www.hp.
For information about: See: Migrating data from one HP 3PAR storage system to another HP 3PAR-to-3PAR Storage Peer Motion Guide Configuring the Secure Service Custodian server in order to monitor and control HP 3PAR storage systems HP 3PAR Secure Service Custodian Configuration Utility Reference Using the CLI to configure and manage HP 3PAR Remote Copy HP 3PAR Remote Copy Software User’s Guide Updating HP 3PAR operating systems HP 3PAR Upgrade Pre-Planning Guide Identifying storage system components
For information about: See: Planning for HP 3PAR storage system setup Hardware specifications, installation considerations, power requirements, networking options, and cabling information for HP 3PAR storage systems HP 3PAR 7200, 7400, and 7450 storage systems HP 3PAR StoreServ 7000 Storage Site Planning Manual HP 3PAR StoreServ 7450 Storage Site Planning Manual HP 3PAR 10000 storage systems HP 3PAR StoreServ 10000 Storage Physical Planning Manual HP 3PAR StoreServ 10000 Storage Third-Party Rack Physic
Typographic conventions Table 102 Document conventions Convention Element Bold text • Keys that you press • Text you typed into a GUI element, such as a text box • GUI elements that you click or select, such as menu items, buttons, and so on Monospace text • File and directory names • System output • Code • Commands, their arguments, and argument values • Code variables • Command variables Bold monospace text • Commands you enter into a command line interface • Syst
12 Documentation feedback HP is committed to providing documentation that meets your needs. To help us improve the documentation, send any errors, suggestions, or comments to Documentation Feedback (docsfeedback@hp.com). Include the document title and part number, version number, or the URL when submitting your feedback.
Index Symbols E 3PAR System Reporter User’s Guide, 56 3PAR System Reporter.xls, 51 3par-policy subdirectory, 129 3par-rpts subdirectory, 129 Excel client installing, 50 Excel Client link, 51 exporting table data, 17 A G adding a system to the list of systems to be sampled, 119 Apache HTTP Server cgi-bin directory, 129 config.pl files, 129 Directory directives, 51 httpd.
Red Hat Enterprise Linux, 23 Region IO Density Report, 189 remove a storage server from the system table, 119 Remove InServ, 48 Report Information control, 94 Report Type control, 77 reports displaying results as chart or table, 94 results, 72 types of, 78 Requirements, 24 S sample resolution resolutions, 69 Sample resolution control, 69 sampling a new storage server, 119 sampling components troubleshooting, 224 sampling interval, 116 sampling policies editing, 116 sampling service, 28 Scheduled Reports, 1