
HP 3PAR Management Console 4.5.1 Software User Guide
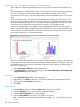
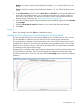

When more than one chart is displayed in the Performance & Reports window, there will be a
toolbar at the top of the panel with a checkbox to the left of each type of chart shown. Clearing
a checkbox toggles off the corresponding chart. Selecting a checkbox re-displays the corresponding
chart.
See the following sections for information on how to create the specified type of report:
• “Creating an AO Configurations Report” (page 367)
• “Creating a CPG Report” (page 372)
• “Creating a Logical Disks Report” (page 430)
• “Creating a Physical Disks Report” (page 379)
• “Creating a Port Report” (page 393)
• “Creating a VLUNs Report” (page 401)
• “Creating a Virtual Volumes Report” (page 410)
• “Creating a Domain QoS Report” (page 419)
• “Creating a Virtual Volume Set QoS Report” (page 416)
• “Creating a Controller Node Report” (page 421)
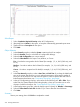
Creating an AO Configurations Report
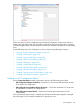
Use the Create New Report wizard to generate a report for the following types of data:
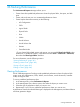
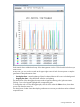
• AO Configurations Region IO Density – Shows the I/O access rate and distribution of data
for a specific AO configuration.
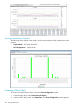
• AO Configurations Cumulative Region IO Density — Shows the cumulative I/O access rate
and distribution of data for AO configurations.
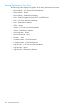
• AO Configurations Space Moved – Displays the historical space data reports for AO
configurations.
Once you select the type of report, a default report Name and Description appears to the right
side of the page. You can keep the default text or provide your own.
Creating Reports 367