
HP 3PAR InForm Management Console 4.2.1 Software User's Guide (QL226-96251, December 2011)
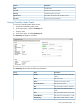
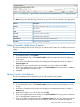

DescriptionFieldGroup
The percentage of available cache.Cache Availability
The current status of the node, as
indicated by the node LED.
Status LED
The date indicates how long the node
has been operating.
Up SinceHealth
Any new alerts. See “Alert Severity
Indicators” (page 40) .
New Alerts
Current state of the node, either
Normal, Degraded, or Failed. See
State
“System and Component Status Icons”
(page 41) .
Description of the node state.State Description
The amount of used control memory,
displayed in GiB and percentage.
Control MemoryPhysical Memory
The amount of used data memory,
displayed in GiB and percentage.
Data Memory
The current CPU usage, displayed in
MHz and percentage.
CPU UsageCPU
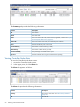
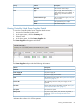
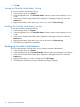
Viewing Controller Node Ports Details
To view the Controller Node Ports detail screen:
1. Access the Controller Nodes screen.
2. In the upper pane, click the Summary tab.
3. Select a node.
4. In the lower pane, click the Ports tab.
The Ports tab appears as follows:
The Ports tab provides the following information:
DescriptionColumnGroup
The type of interface card, either
Ethernet or Fibre Channel (FC).
TypeCards
The position of the card in node:slot
format.
Position
The number of ports on the interface.Ports
66 Working with Controller Nodes