
HP Z230 Workstation generational performance improvements


Relative Performance
HP Z220 with Intel® HD Graphics P4000
HP Z230 with Intel® HD Graphics P4600
1.36
1.001.00
1.23
0.0
0.2
0.4
0.6
0.8
1.0
1.2
1.4
1.6
SPECapc NX6 SPECapc PT Creo 2.0
Graphics Composite Scores
Relative Performance
HP Z220 with Intel® HD Graphics P4000
HP Z230 with Intel® HD Graphics P4600
1.00
1.12
0.90
0.95
1.00
1.05
1.15
1.20
1.10
Adobe Premier Elements
Application Performance
Relative Power Consumption
Sleep
Tec
Entry Tower Workstation Platform
0.5
1.0
2.0
2.5
Z200
1.5
Z220 CMT Z230 TowerZ210 CMT
Relative Power Consumption
Sleep
Tec
Entry SFF Workstation Platform
0.5
0.7
1.1
1.3
0.9
1.7
1.5
1.9
2.1
2.3
2.5
Z200 SFF Z210 SFF Z220 SFF Z230 SFF
2
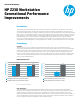
In the example conguration above, Intel’s HD Graphics P4600 proves to increase the SPECapc NX6 benchmark
composite graphics score up to 36% and the SPECapc PT Creo 2.0 benchmark graphics scores up to 23% (see Figure 2).
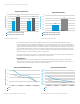
Professional OpenGL and DirectX applications benet from application specic tuning and support for next-generation
graphics APIs, such as Microsoft DirectX 11.1, OpenGL 4.0, OpenCL 1.2 and DirectCompute 5.0 standards. Figure 3 shows
up to 12% additional application performance for Adobe® Premier Elements. OpenCL allows the application to access
the graphics processing unit for non-graphical computing. Adobe Premier Elements also takes advantage of OpenGL to
speedup display functions and accelerate specic processing tasks.
For users interested in improving graphics or video application performance at a minimal price, the Intel® HD Graphics
P4600 oers competitive performance to entry-level discrete graphics cards.
Energy Eciency
The HP Z230 strives to uphold HP’s leadership in environmental sustainability and energy eciency. The HP Z230
compact tower and small form factor feature more ecient power supplies than their predecessors. Figures 4 and 5
show the power consumption history for HP entry level workstations
1
.
Technical white paper | HP Z230 Workstation Improvements
Figure 2: Graphics Performance
Figure 4: Tower Workstation Power Consumption
Figure 3: Application Performance
Figure 5: Small Form Factor Workstation Power Consumption