
User's Manual


Menu bar actions 68
o
Select Save to save the data comparison.
Customizing charts
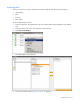
1. Click Chart to plot the retrieved data on a chart and compare sensor trends across a set timeline.
The Chart Customization window appears.
2. Select the data in the left list and configure it using the following options:
o Style
o Color
o Chart name
o Background color
o Appearance and location of legend
3. Select Chart to create a chart using the selected data.
Alerts menu
The Alerts menu options differ based on the user type.
Administrators can choose from the following options:
• View global active alerts
• View global alert history
• Define new alert
• Alert management
• Delete alerts from database