HP Insight Environmental Observer Software User Guide Part Number 531668-004 December 2010 (Fourth Edition)
© Copyright 2009, 2010 Hewlett-Packard Development Company, L.P. The information contained herein is subject to change without notice. The only warranties for HP products and services are set forth in the express warranty statements accompanying such products and services. Nothing herein should be construed as constituting an additional warranty. HP shall not be liable for technical or editorial errors or omissions contained herein. Confidential computer software.
Contents Overview ..................................................................................................................................... 5 About HP Insight Environmental Observer ..................................................................................................... 5 Components ............................................................................................................................................. 5 System requirements .......................................
Accessing the Tabular views ........................................................................................................... 41 Sensor object tabs ......................................................................................................................... 41 Alerts ........................................................................................................................................... 50 Exporting tabular data to a .csv file .........................................
Overview About HP Insight Environmental Observer The HP Insight Environmental Observer is a web-based application that provides visualization of data center environmental and power data including: • Rack and/or equipment cabinets temperature and relative humidity • CRAH/CRAC temperature and relative humidity • Differential subfloor air pressure • Chilled water energy values • Electric power and current values Users can create customized alerts based on the monitored sensor points.
Hardware Requirements backed caching Power supply Redundant power (2) Connectivity Gigabit Ethernet adapter (2) Software requirements Software Requirements Operating system Windows Server® 2008 R2 Standard (64 bit) Windows Server® 2003 R2 Standard Edition (64 bit) Windows Server® 2008 Enterprise (32 bit) Windows Server® 2003 R2 Enterprise Edition (32 bit) Required software Adobe® Reader User privileges User with full administrator privileges configured for installation Secure access SSL certi
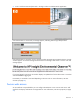
4. Enter a valid username and password in the login window to authenticate the application. If the authentication is unsuccessful, a message appears, indicating that the login attempt failed. If the authentication is successful, access is granted, and the HP Insight Environmental Observer console window appears. A welcome message and instructions for selecting a data center or zone to view and manage appear.
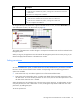
HP Insight Environmental Observer console interface Interface components Callout Component Description 1 Menu bar Includes the main task tabs for the portal. 2 Global information Contains all active alerts and warnings for all data centers installed. 3 System status Contains the status of all installed components. 4 Navigation panel Contains the sensors in each location configured at installation by data center and zone.
Callout Component Description 6 View menu bar Includes tabs for viewing options. Menu bars HP Insight Environmental Observer has the following user types: • Administrator • Power user • Standard user Each user type has a different view that correlates with the functions allowed for that user role. The primary differences appear in the menu bars.
Icon Description data center. • When the icon and label are yellow, warnings are in at least one zone in the data center. Data centers are configured at installation. Zone The icon and text label represent the zone the user can view. • • When the icon and label are red, active alerts are in that zone. When the icon and label are yellow, warnings are in that zone. Zones are configured at installation.
1. In the Navigation panel, right-click on the data center or zone, and select Permissions. The Permissions window for the selected data center or zone appears, showing a current list of all users with access to the selected data center or zone. 2. To give a user permissions to the zone, select Add. The Select Users window appears.
o To give an individual user permission to the data center or zone, highlight the user and select OK, or select Cancel to close without saving. o To give all users permission to the data center or zone, highlight Everyone and select OK, or select Cancel to close without saving. 3. To revoke a user's permissions to the data center or zone, highlight the user, and select Remove. 4.
System status The System Status panel appears to the left of the HP Insight Environmental window.
3. The other columns shift to accommodate the new column. Hiding a column 1. Position the mouse pointer over the Plus button (+), above the vertical scroll bar at the right of the page, until the hand pointer appears. 2. Click the mouse to display a panel with checkboxes for the columns on the page. Check marks appear for columns that are showing. 3. Choose one of the following options: o To hide a column, click inside the checkbox to remove the check mark.
Views Data center views In the Data View window, users have several different ways to view general and detailed data relating to sensors, including real-time and historical data. Administrators can perform additional operations. The HP Insight Environmental Observer provides all users with several different ways to view both highlevel and detailed data relating to all sensors, including real-time data and historical data, in the Data View window.
The PUE tab displays power consumption data, gathered from optional energy meters installed in the data center, in real-time charts and graphs. Collecting PUE data is useful in monitoring power usage and loss, and determining an ideal power consumption environment. Accessing the PUE tab 1. From the Navigation panel, select the data center you want to display. 2. Select the PUE tab. The PUE view appears.
o DCE—The ratio of IT power over cooling power. The higher the value, the more efficient the data center power. Hover the mouse over the metric to display the metric definition. • • IT and cooling power utilization—Values of the IT and cooling power utilization. o Actual—Actual measurement of power consumption. o Design—Power capacity limit for the metric. o Utilization—Percentage of actual consumption, compared to design capacity.
To adjust the information that appears: 1. Right-click inside the chart. 2. Select an option to adjust the view of the chart: o Chart Options—Displays options for adjusting the time interval and legend visibility. o Zoom Chart In—Displays a shorter time span on the chart. o Zoom Chart Out—Displays a greater time span on the chart. o Print Chart—Displays options for printing the current chart. To view data at a specific time, move the mouse over the chart plot.
To adjust the axis line, see The base station toolbar (on page 26). Overview tab The Observer provides an Overview, or floor plan, of the selected data center. This view is a virtual map that shows a layout of the zones within a data center, including the CRAHs/CRACs, racks, base stations, and pressure objects in a zone, and provides access to the corresponding data. The Overview tab preserves, to scale, the spatial distribution of objects in each zone within each data center.
The following is a zone example. By default, the Overview tab displays a solid color background. However, a customized Overview layout image is configured during installation, providing a spatially accurate site-specific rendering of the layout. For more information on configuring the background image, see the HP Insight Environmental Configurator User Guide.
Hovering over any zone icon highlights the entire zone area, and opens a new window that contains configuration information, including the name and description of the zone. Viewing zone Overview information On the Overview tab, you can view the layout and details for base stations, racks, pressure objects, and CRAH/CRACs in the zone selected on the Navigation panel. For any selected object, you can view configuration information, real-time data, or historical data.
Callout Description you to change the details that appear. 5 The Refresh button enables you to refresh the view at any time to show current and updated information. The zone Overview controls These controls consist of a row of buttons at the upper right corner of the zone Overview tab which provides the user with additional ways to change the appearance of items on this page and a quick way to navigate.
The Object Filter window appears. 2. Select all items you want to display. 3. Clear all items you want to hide. 4. Select OK to save and close. Locator view The Locator View is helpful when you have a large data center. It enables you to: • See which portion of the large data center is visible. • Zoom into a smaller area within the large data center project. • Quickly and easily move from one portion of the room to another.
To show the Locator View, select the Show/Hide Locator View icon at the top right of the interface. Viewing configuration details for individual components Rolling the mouse over any icon displays a new window containing configuration information for that object.
• Pressure data • Alerts (if any) For Power Meters, the configuration information specifies: • The name of the power meter • Voltage data • Current data • Power data • Alerts (if any) Viewing data values The Observer enables you to view real-time data values for all base stations, racks, pressure objects, CRAH/CRACs, and supported power meters. The data values shown are current readings for all sensors associated with a particular object.
3. To briefly the display the data values for objects, move the mouse over other object icons without clicking. The title bar of each window bears the name of the base station, rack, or CRAH/CRAC to which the values are associated, and a date and time stamp appears in the window title. While a data value window remains open, you can use the mouse to drag it away from and back to the object icon of origin as needed to adjust the view of other icons and data on the page.
Sensor object Icon Description Base station Historical chart A chart that displays historical data for the base station Rack Cold side sensor value The temperature and dew point recorded by the sensors at the front of the rack Rack Hot side sensor value The temperature and dew point recorded by the sensors at the rear of the rack Rack Calculated values The humidity and reference temperature of the rack Rack Historical chart A chart that displays historical data for the rack CRAH/CRAC Supp
Select Graph to display a chart showing recent history for each sensor associated with the selected base station. To display the chart for each sensor, use the scroll bar to the right of the window. To adjust the chart axis lines: 1. Right-click the axis line.
2. Select Format Axis. The Format Axis window appears. 3. Either manually adjust the axis scale or select the Auto Recalculate box. 4. Select OK to save and close, or select Cancel to close without saving. To print the chart, right-click the chart, and select Print. The chart prints to your default printer. Detecting disconnected sensors NOTE: If the base station is attempting to communicate with the gateway, the base station status might appear green, though the external sensors are disconnected.
Icon Status and meaning Location Critical—The device sensors • are reporting data values in critical range. • • The zone in the Navigation panel The icon on the Overview tab The object data value window If you notice a disconnected sensor indicated in any location, notify an administrator immediately. Detecting sensors that require maintenance Many external sensors require periodic maintenance in accordance with manufacturer guidelines.
2. Select the Imaging tab. The Imaging window appears. Callout Item Description 1 Virtual map Enables you to access real-time and historical imaging of temperature, humidity, and pressure distribution. 2 Header Enables you to choose from available options. Select static or animated imaging and the specific sensor types and date ranges of data to show. 3 Map legend Enables you to see the status of the zone. The legend is a color-coded key to the areas shown in the Imaging tab.
The Map Legend The Observer displays one of three different map legends, depending on what type of sensor the user selects from the Type list: • Temperature (Fahrenheit or Celsius) • Humidity (percentage) • Pressure (inches of H20 or Pascals) The numbers along the bottom indicate the measurements. The colors provide a corresponding visual key. Display modes In the Imaging tab, you can view static or animated imaging for the zone selected on the Navigation panel.
Sensor-type Description Temp-Middle The temperature readings for sensors in the middle position of the racks within the zone Temp-Bottom The temperature readings for sensors in the bottom position of the racks within the zone Humidity The relative humidity based on readings from the humidity sensors on racks within the zone Pressure The differential air pressure, between the supply plenum and the main floor, based on readings from all pressure objects within the zone To view static imaging for a d
If more than one sensor-type is selected and you are zoomed out to view all sensors simultaneously, you can still zoom in on a single sensor-type. Select the box for that sensor type, and then use the scroll feature on your mouse to zoom in or out. The scroll bars appear and show the zoom level. Right-click any image window for available menu options: • Select Print images to print the image to your default printer. • Select Export images to export the image to the file-type of your choice.
Viewing animated information 1. Select Animated. 2. Select the sensor-type you want to appear. A window prompts you to wait while the necessary images load into the animation. 3. Select the date range (up to 30 days) for your animation. The default date represents the last 24 hours. a. Open the calendar window for the Start time. b. Select the month. Use either the forward or back arrows to change the month, or select the month from the menu. c. Select the year from the menu. d.
Pre-Defined Metrics tab The Pre-Defined Metrics tab provides detailed data on the current state of the selected zone. These metrics were developed in conjunction with the United Stated Department of Energy and Lawrence Berkeley National Labs to reflect the important aspects of the data center and provide information on the efficiency of the data center operations. This information can be used to compare the effects of changes and help to improve overall efficiency.
4. Select the operation you want to perform. o Select Print table to print the entire table to your default printer. o Select Export to export the information to the file-type of your choice. o Select Show history to display all metric values calculated within a certain time frame. The history for a specific metric measurement is shown in a table.
Metric Affected objects Description greater the possibility that the equipment experiences temperatures above the maximum allowable temperature, as determined by ASHRAE. Rack Cooling IndexLO® Data center racks Zone racks RCILOTM/SM is the complement to RCIHITM/SM to draw attention to the supply air that is below the minimum recommended temperature, as determined by ASHRAE.
2. If you have configured custom data inspectors, then select the Custom Metrics tab. The Custom Metrics window appears. 3. In the Data Inspectors section, click the down arrow to select the filter for the historical data chart. 4. Right-click any row. The options window appears. 5. Select the operation you want to perform. o Select Print table to print the entire table to your default printer. o Select Export to export the information to the file-type of your choice.
6. In the Historical Data section, click the down arrow to select the time interval for the historical data graph. 7. Scroll over any point on the graph to display the data. 8. Right-click anywhere in the graph. The options window appears. o Select Print Chart to print the entire graph.
9. Select Refresh at anytime to update the data and graph. Tabular views You can view data in tabular form. Columns in the tables show detailed data for all base stations, racks, pressure objects, and CRAH/CRACs in the zone selected on the Navigation panel. You can sort and edit columns. For more information about columns, see Changing the appearance of columns (on page 13). Accessing the Tabular views 1. From the Navigation panel, select the data center or zone you want to display. 2.
Column Description Location The location of the sensor object, as entered during configuration. *If an external sensor is disconnected, then a red X appears in the sensor column. If a sensor needs maintenance, then a yellow X appears in the sensor column. CRAH/CRAC tab To view the CRAH/CRAC details for a specific zone: 1. From the Navigation panel, select the zone you want to display. 2. Select the CRAH/CRAC tab. The information for all CRAH/CRACs within that zone appears in the Tabular view.
4. o Select Define alert to open the Define New Alert window and select the CRAH/CRAC as the source of the data for the alert. o Select Print table to print to your default printer. o Select Export to export the information to the file-type of your choice. Select an individual CRAH/CRAC to display the current and historical data associated with that CRAH/CRAC. Racks tab To view the rack details for a specific zone: 1. From the Navigation panel, select the zone you want to display. 2.
NOTE: If the system is collecting data from the sensors but cannot calculate a value, the CRAH/CRAC or rack objects might have a yellow status. This temporary situation is typically encountered during the installation process. The header display area specifies the total number of racks in the zone and the number of active alerts, if any. The main display shows data, including the status, name, location, and recent readings for each rack, organized into columns. 3. Right-click the rack you want to view.
The header display area specifies the total number of pressure sensors in the zone and the number of active alerts, if any. The main display shows data, including status, name, location, and recent readings for each pressure object, organized into columns. 3. Right-click the pressure object you want to view. The options window appears. o Select Show on floorplan to locate the pressure object on your zone floorplan view.
The header display area specifies the total number of power meters in the zone and the number of active alerts, if any. The main display shows data, including the status, name, location, and recent readings for each power meter, organized into columns. 3. Select any power meter you want to view. The current and historical sensor data appears. The Current Sensor Data tab is the default.
4. Select the Historical Sensor Data tab to view past sensor data.
5. Filter sensor data, if desired. 6. Right-click the power meter object. The options window appears. o Select Show on floorplan to locate the power meter on your zone floorplan view. o Select Go to Data Analysis to open the Data Analysis window, and highlight the selected power meter for reporting. o Select Define Alert to open the Define New Alert window, and select the power meter as the source of data for the alert. o Select Print table to print to your default printer.
Base Station tab To view the wireless base station details for a specific zone: 1. From the Navigation panel, select the zone you want to display. 2. Select the Base Stations tab. The information for all wireless base stations within that zone appears in the Tabular view. NOTE: You can sort, resize, move, or hide columns. For more information about the appearance of columns, see Changing the appearance of columns (on page 13).
4. Right-click the base station you want to view. The options window appears. o Select Show on floorplan to locate the wireless base station on your zone floorplan view. o Select Go to Data Analysis to open the Data Analysis window and highlight the selected wireless base station for reporting. o Select Define alert to open the Define New Alert window and select the wireless base station as the source of the data for the alert. o Select Print table to print to your default printer.
Active Alerts tab To view active alerts for a specific zone: 1. From the Navigation panel, select the zone you want to display. 2. Select the Active Alerts tab. The information for active alerts within that zone appears in Tabular view. The header display area specifies the number of active alerts. Select the + to select the columns you want to view. For active alerts, the only action you can perform is to clear them. Select Clear to remove the alert from the active alerts list.
You can add a note regarding the alert or reason for clearing it. Any added note appears with the alert in the Alert History tab. For more information on clearing alerts, see Alerts menu (on page 68). Alert History tab To view the alert history for a specific zone: 1. From the Navigation panel, select the zone you want to display. 2. Select the Alert History tab. The information for historical alert data, including previously dismissed alerts, within that zone appears in Tabular view.
3. Select Export. A window appears prompting you to save the file. If you do not see the download window, you might have pop-ups blocked or may need to add the server into your trusted zone to allow file downloads. See your browser documentation for enabling pop-ups. For detailed information on exporting to this format, see Exporting to CSV format ("Exporting report data to .csv file" on page 67).
2. Select the Wireless Sensor Network tab. The Wireless Sensor Network page appears. Callout Item Description 1 Virtual map Shows the wireless device location on the data center and the wireless communication map. 2 Data center information Shows all base stations connected to the wireless network and all warnings for the wireless network. 3 Hop level Shows the number of wireless communication hops between the wireless base station and the gateway.
Menu bar actions Menu bar options HP Insight Environmental Observer has the following user types: • Administrator • Power user • Standard user Each user type has a different view that correlates with the functions allowed for that user role. The primary differences appear in the menu bars. Administrator menu bar Power and Standard user menu bar The following table describes the available menu options.
Menu Administrator user options Power user options Standard user options Window Close all Close all Close all Data center Data center Data center User Guide User Guide User Guide About About About Help For more information about user types, see Creating user accounts (on page 83). Reports menu The Reports menu offers the following options: • Create reports • Custom reports • Battery reports • Base Station F/W reports Creating a report 1.
o Single-click a zone to view the properties for that zone.
o 3. 4. 5. Double-click a zone to view all of the objects defined within that zone. Select one or more of the properties listed. o Highlight the sensors in the Properties list, and then select the > button to select one or more sensors. The selected sensors appear in the Selected Properties list. o Select the >> button to select all sensors in the Properties list. All sensors appear in the Selected Properties list.
o Select Tabular to view the report results in a table. The Report Results appear. If necessary, modify the criteria for the historical data retrieved during data analysis, and then select Update.
o Select Chart to view the report results in a table. The Chart Customization window appears. If necessary, modify the chart customization options, and then select Chart. The Report Results appear.
Analyzing data All users can perform an ad hoc report of historical sensor data for each of the following options: • CRAH/CRAC • Rack • Pressure • Base station To use the data analysis function: 1. Select an object tab. The information for all sensor objects within that zone appears in the Tabular view. 2. Move your mouse over a row, and right-click to open the menu. 3. Select Go to Data Analysis. The Create Report window appears. 4.
Saving the report To save the report of the retrieved data for future references: 1. Select Save from the Create Report window. The Save Report Query window appears. 2. Complete the Name and Description fields. 3. Make the query available to: 4. o Myself only o Everyone Select Add to save the query. Creating custom reports You can view, run, edit, and delete previous custom queries. 1. From the Reports menu, select Custom Reports. The Custom Reports window appears.
The names and descriptions of previous custom queries saved using the Save Report Query window appear in the columns of the window. The buttons to the right of each column enable the user to perform additional actions. Item Action View Custom Query Selection Run Custom Query Edit Custom Query Delete Custom Query 2. To create a new query, select New. The Create Report window appears. See Creating a report (on page 56) for more information. 3. Select Save to save any changes and close the window.
3. Select the View Custom Query Selection icon. The Custom Report Details window appears and displays the names of the objects and sensors used in the previous query. 4. Select Close to close the window and return to the Custom Reports window. Running custom queries 1. From the Reports menu, select Custom Reports. The Custom Report window appears. 2. Select the row of the query you want to run. 3. Select the Run Custom Query icon. The Data Filter window appears. 4.
3. Select Delete Custom Query icon. A confirmation window appears. 4. Select OK to delete the custom query. The name of the query and its summary no longer appear in the Custom Reports window. Generating battery reports Battery reports might reflect an inaccurate condition, depending on when you run the report.
The report is automatically generated based on sensor readings. It provides estimated battery life for all object batteries and suggests recommended replacement parameters. • The scroll bar enables you to see the entire report. • Right-click a row to access the context menu, and then select from the menu. Base Station F/W reports From the Reports menu, select Base Station F/W reports. The Base Station F/W Version Report window appears.
The report is generated automatically to include each of the base stations information including name, location, zone, and firmware data. Exporting report data to .csv file You can export the sensor data from your reports to a Comma Separated Values (CSV) file format that can be used with an Excel spreadsheet. To export the report sensor data: 1. In the Create Report window, create your custom report. 2. Select the Tabular viewing option. 3. Right-click the row of data you want to export. 4.
o Select Save to save the data comparison. Customizing charts 1. Click Chart to plot the retrieved data on a chart and compare sensor trends across a set timeline. The Chart Customization window appears. 2. Select the data in the left list and configure it using the following options: 3. o Style o Color o Chart name o Background color o Appearance and location of legend Select Chart to create a chart using the selected data.
Power users can choose from the following options: • View global active alerts • View global alert history • Define new alert • Alert management Standard users can choose from the following options: • View global active alerts • View global alert history Viewing global active alerts 1. Select the Alerts menu. 2. Select View Global Active Alerts. The Active Alerts window appears, listing all active alerts for all data centers monitored by the HP Insight Environmental Observer.
Defining a new alert To define a new alert or edit existing alert definitions: 1. From the Alerts menu, select Define New Alert. The New Alert window appears with tabbed pages for each type of alert information to be defined. 2. In the Alert Name tab, enter the basic alert information. 3. o Alert name—A unique name or identifier for the alert. o Alert priority—How often and in what order email notifications are sent to the alert recipient.
a. Create a condition. NOTE: You can evaluate the data values and metrics for rack and CRAH/CRAC objects. You can evaluate only data values for base station, pressure, and sensor objects.
— Email — SNMP Trap b. Enter a valid email address. c. 6. Select the Add (+) button to enter additional recipients. You can enter multiple email addresses by separating each email address with a semi-colon. At the bottom right of the New Alert window, click Create to save the alert. Managing alerts 1. From the Alerts menu, select Alert Management. The Manage Alerts window appears. NOTE: In the Manage Alerts window, any alerts that are grayed out indicate a deactivated alert.
Each entry in the alert list contains the following: 2. o Alert name o Alert description o Alert priority o Edit Alert button o Activate or Deactivate button o Delete Alert button Select the alerts you want to view, by selecting All, Active, or Inactive from the menu. Performing alert actions From the Manage Alerts window, you can create, edit, activate, deactivate, and delete alerts.
Item Action Edits alert Activates alert Deactivates alert Deletes alert Creating an alert definition Observer has several predefined alerts within the application that cannot be changed or deleted from the system. The only action items for the predefined alerts is to activate, deactivate, or dismiss the alert. The following alerts are predefined. Predefined alert Description UNKNOWN All errors that are not otherwise defined.
Predefined alert Description information about PUE graphs, see the HP Insight Environmental Configurator User Guide. To create a new alert definition: 1. From the Alerts menu, select Alert Management. The Manage Alerts window appears.
2. Click Create. The New Alert window appears. 3. Complete the following information: o Name—Name the new alert o Alert Priority—Select either Low, Medium, or High priority o Alert Deadband—Select the deadband in seconds. The deadband value is the amount of time between the alert condition and the alert. A value of zero triggers an alert immediately during an alert condition. o Description—Describe the alert condition. 4.
1. From the Alerts menu, select Alert Management. The Manage Alerts window appears. 2. Select the Edit alert icon for a particular alert. The Edit alert window appears. Fields in this window are pre-populated with information entered for the associated alert.
If you are editing a user-defined alert, additional tabs appear, enabling you to edit additional objects and conditions associated to the alert. 3. In this window, an administrator can edit any data relating to the alert definition. 4. Select Update to save edits, close the window, and return to the Manage Alerts window. A message appears at the lower left of the console window confirming that the alert was successfully updated.
Activating an existing alert definition 1. From the Alerts menu, select Alert Management. The Manage Alerts window appears. 2. Select the Activate alert icon for a particular alert to place the definition in a status where an alert is evaluated or triggered, based on incoming sensor readings. A Confirmation window appears prompting you to confirm activating the alert definitions. o Select OK to close the window and return to the Manage Alerts window.
Deactivating an existing alert definition 1. From the Alerts menu, select Alert Management. The Manage Alerts window appears. 2. Select the Deactivate alert icon for a particular alert to place the definition in a status where an alert is no longer evaluated or triggered based on incoming sensor readings. A Confirmation window appears prompting you to confirm deactivating the alert definitions. o Select OK to close the window and return to the Manage Alerts window.
To view all Inactive alerts, select Inactive from the View menu. Deleting individual alerts NOTE: The system-defined alerts cannot be edited or deleted. You can deactivate the alert, if you no longer want to receive warning of the alerting condition. All user-defined alerts include a trash can icon on the Manage Alerts window, and can be edited or deleted at any time with the appropriate user credentials. Before an object can be deleted from the system, any alerts associated with it must be cleared.
2. Select the Delete alert icon to delete all alert-related data, including conditions and definitions, regardless of data center or zone. Unlike the clear operation, no historical data that refers to the deleted alerts is retained. A Confirmation window appears prompting you to confirm deleting the alert definitions. o Select OK to close the window and return to the Manage Alerts window. A message appears at the lower left of the Portal window informing you that the alert was successfully deleted.
• Create Account • User Accounts • System Log • Options Creating user accounts 1. From the Administration menu, select Create Account. The Create Account window appears. 2. Select the role of the user account and complete the remaining fields for the user. o Users given the Administrator role automatically have access to all monitored data centers and associated zones. o Users given the Standard User role, by default, do not have access to any monitored data centers or zones.
User accounts 1. From the Administration menu, select User Accounts. The Manage Accounts window appears. o Search for user accounts o Change user passwords o Edit or delete a user Searching for user accounts An administrator can search for user accounts using the following criteria: • All users • First name • Last name • Email address • Username • User type To search for a user account: 1. From the Administration menu, select User Accounts. The Manage Accounts window appears. 2.
o 3. Search by—Select criteria from the list. If you search using the Search by list, enter the appropriate search criteria, and then select Search. If any user profile matches the search criteria, the columns are populated with the results. Changing user passwords To change the password for any user, you need the user name of the user whose password will be changed. 1. From the Administration menu, select User Accounts. The Manage Accounts window appears. 2.
Clearing active alerts associated with a user To delete a user, all active alerts and custom queries associated with that user must be cleared. Either the user or an administrator can clear the associated alerts and queries. 1. Log in to the Observer as the user. 2. Delete all custom queries ("Deleting individual alerts" on page 81). 3. Dismiss all active alerts ("Active Alerts tab" on page 51). Editing or deleting users The default administrator account cannot be deleted.
o If you select Edit, the Edit User window appears. Update all required fields and select Update to save and close. o If you select Delete, a confirmation window appears prompting you to confirm deleting the user. Select OK to delete the user and close. NOTE: A message appears at the lower left corner of the console window informing you that the task was successful.
1. From the Administrator menu, select System Log. The System Log window appears, detailing a list of user activities and the corresponding time stamps. 2. To filter the information that appears, select the criteria from the Filter by drop-down menu, and select Update. The default is Show all activity. Additional fields might appear, depending on the criteria selected. Enter all appropriate information, and then select Update. Administrative options From the Administration menu, select Options.
• SNMP • Security • Imaging • Alerts Email options To define the email options: 1. From the Administration menu, select Options. The Options window appears. 2. Select the Email tab. 3. Define the following options: o Server information o Logon information o User information 4. To test your new settings, select Test Email. An email is sent to the address defined in the User information. 5. Select OK to save and close, or select Cancel to close without saving.
2. Select the Auditors tab. 3. Define the following options: 4. o Database auditor o Device Manager auditor o Imaging Server auditor o Observer auditor Select OK to save and close, or select Cancel to close without saving. SNMP options To define the SNMP options: 1. From the Administration menu, select Options. The Options window appears.
2. Select the SNMP tab. 3. Define the following options: 4. 5. o Source Address o Destinations To add new destinations, select Add. A new row appears for you to enter the following information: o Remote IP o Remote Port o Write community o Read community To send a test SNMP trap, highlight a destination, and then select Send.
6. To edit existing destinations, highlight the existing destination. You can type over the existing information. Select OK to save and close, or select Cancel to close without saving. 7. To remove existing destinations, highlight the existing destination and select Remove. The destination is removed from the Destination list. 8. Select OK to save and close, or select Cancel to close without saving. Security options To define the security options: 1. From the Administration menu, select Options.
2. Select the Security tab. 3. Select the Web access security mode: 4. o No encryption—(Default) Unsecured HTTP access. o Authentication only—Secured HTTPS access. During login, the user is authenticated through HTTPS before they can access the Observer web console. Once authenticated, the communication between the client browser and the Observer is not encrypted. o All—Secured HTTPS access and secure communication. During login, the user is authenticated.
b. Select Upload to browse to and upload the keystore certificate file on the local machine. The Upload File window appears. c. Select Done to save the certificate and close the window. d. Enter the keystore password that was used to create the keystore. 5. Select OK to save and close, or select Cancel to close without saving. Imaging options To define the imaging options: 1. From the Administration menu, select Options. The Options window appears.
2. Select the Imaging tab. 3. Select the Imaging legend you want to edit from the Legend for menu. 4. o Select Add to add a new color to the legend. You must define the value range for the color to represent. o Select Remove to delete an existing color or value range from the legend. o Select Restore to ignore all changes made on the Imaging Options page, and restore the Imaging settings to the previous state. Select OK to save and close, or select Cancel to close without saving.
2. Select the Alerts tab. NOTE: The alert system sends one alert notification immediately following the alert condition. If the alert is not acknowledged, the system will send two additional reminder alerts at the time interval specified. 3. Define the time intervals for high, medium, and low priority alerts. Each alert priority can have an additional interval configured that will check the alert condition if the alert remains unacknowledged. 4.
2. Select Password. The Change Password window appears. 3. Enter your new password. 4. Repeat the new password. 5. Select OK. Changing your preferences All users can set their own preferences. Preferences include: • Session expiration time • Data measurement units and decimal places • Refresh interval • Date and Timestamp format • Alert intervals To change your preferences: 1. Select the My Account menu. 2. Select Preferences. The Preferences window appears. 3.
o 3. 30 minutes Select your preferred Navigation Tree view from the menu. o Hide single leaves o Show all 4. Select your preferred animation view. If animation is On, every window fades out after closing. If animation is Off, every window automatically disappears after closing. 5. Select OK to save and close, or select Cancel to close without saving.
4. Select the refresh rate of the data tables in the application, from 0 to 60 minutes. The refresh rate refers to how often the data is refreshed on the screen. If you select 0 minutes, the application only refreshes data when you select the refresh button. 5. Select OK to save and close, or select Cancel to close without saving. Changing the date format 1. From the Preferences menu, select Date. 2. Select from the following date formats: 3. o MM/dd/yyyy HH:mm:ss o yyyy-MM-dd HH:mm:ss o dd.
2. Select your preferred language from the menu. 3. Select OK to save and close, or select Cancel to close without saving. Help menu The Help menu offers the following options: • User Guide • About Accessing the user guide To view the HP Insight Environmental Observer User Guide online, save the file to your computer, or print: 1. From the Help menu, select User Guide. A document with the link to the user guide on the web appears. 2.
1. From the Help menu, select About. The About window appears, displaying the version details. 2. Select OK to close.
Maintenance Battery management Due to the necessity of batteries for the basic functionality of the HP Insight Environmental Observer, you must closely monitor and maintain the life of the sensor batteries. Generating battery reports Battery reports might reflect an inaccurate condition, depending on when you run the report.
The report is automatically generated based on sensor readings. It provides estimated battery life for all object batteries and suggests recommended replacement parameters. • The scroll bar enables you to see the entire report. • Right-click a row to access the context menu, and then select from the menu. Replacing batteries Observer sensor objects require approved lithium batteries for long lifetime, such as Energizer or Eveready L-91 batteries.
5. Replace the battery cover. NOTE: Before you update the Observer battery capacity, replace all required batteries in the sensor objects. 6. Update the battery capacity in the Observer. a. Log in to Observer as an administrator. b. From the Navigation window, select the data center where the base station is located. c. Select the Base Stations tab. d. Right-click the base station whose battery you changed. e. Select Set battery capacity. The Battery capacity window appears. f.
• • The mySQL database mysqldump - root -pdbuser -e -q --single-transaction synap > dbbackup.sql (Optional) Environmental images—The image files might require a large amount of disk space to back-up. HP recommends only backing up the image files if you want to record past environmental images. C:\Program Files\HP\HP Insight Environmental Software\HP Insight Environmental Imaging Server\output System restore If you need to restore files or move the database to a new server: 1.
Troubleshooting HP Insight Environmental software troubleshooting Problem Solution I browse to the HP Insight Environmental Verify the following: Observer home page, but the page does • All software components are installed correctly. not load. • The home page URL is typed correctly. • The client machine where the browser is running is on the same network as the HP Insight Environmental server. • HP Insight Environmental Application Server service is running on the HP Insight Environmental server.
Problem Solution data slowly. • A good network connection exists between the browser client and the Observer Server. • The database has been optimized for performance. In the MySQL folder, increase the MySQL cache parameter to: innodb_buffer_pool_size=1000M • The Observer Server has enough memory. There is little or no data from the wireless base stations. The wireless base station has a green status on the Base Station tab, but the associated rack object has a red status on the Racks tab.
Problem Solution or animated images available within a specific time frame. that time period, therefore there are no historical images available to display. I recently replaced the batteries in a wireless base station, but the battery report shows a very low battery life. Verify the following: I cannot view some of the power meter values I have configured for calculating PUE data. How can I display them? • The batteries were replaced correctly, and the battery capacity was reset.
Acronyms and abbreviations ASHRAE American Society of Heating, Refrigerating and Air-Conditioning Engineers BCMS branch circuit monitoring system BPA bypass air flow CRAC computer room air conditioning CRAH computer room air handler CRE Calculation Rules Engine CSV comma-separated value cTROf cold top inlet air temperature rate of change DAL Data access layer ID identification IP Internet Protocol LED light-emitting diode Acronyms and abbreviations 109
PDI Power Distribution, Incorporated PUE power usage efficiency RA recirculation air flow RAM random access memory RCI Rack Cooling Index SMS System Management Server SQL structured query language SSL Secure Sockets Layer URL uniform resource locator Acronyms and abbreviations 110
Index A accessing the HP Insight Environmental 6 accessing the user guide 100 accessing the wireless sensor network 53 accessing, Imaging tab 30 accessing, PUE data 16 accessing, Tabular views 41 Active Alerts view 51 adjusting columns 13 adjusting the window 14 Administration menu 82 administrative options 88 alert actions 73 alert definitions, activating 79 alert definitions, creating 74 alert definitions, deactivating 80 alert definitions, editing 76 Alert History view 52 alert management 72 alerts 50, 7
H P hardware requirements 5 Help menu 100 hiding columns 14 HP Insight Environmental, accessing 6 password, changing 85, 96 passwords 85, 96 performing alert actions 73 permissions, setting 10 Power Meters tab 45 Pre-Defined Metrics tab 36, 37 preferences 97 Pressure tab 44 printing data 14 PUE data 16, 17 PUE tab 15, 16 I imaging options 94 Imaging tab, accessing 30 imaging view 30 interface components 8 interface, console 8 L legend, map 32 legend, zone overview 22 Locator view 23 M main views 15 ma
T tab, Base Stations 49 tab, CRAH/CRAC 42 tab, Power Meters 45 tab, Pressure 44 tab, Racks 43 tab, sensor objects 41 tabular data, exporting 52 tabular view 41 toolbar 26 troubleshooting 106 U user account, searching 84 user accounts 83, 84 user guide, accessing 100 V version, viewing 100 viewing animated information 35 viewing configuration details 24 viewing custom queries 63 viewing data for analysis 67 viewing data values 25 viewing global active alerts 69 viewing global alert history 69 viewing stati