
Administrator's Guide
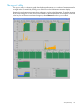
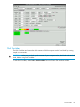

The xperf utility
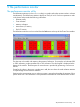
The xperf utility is a dynamic graph that displays performance on a number of measurements for
a single node. It is started by clicking on a node icon on the Performance Monitor display.
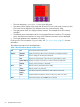
Statistics for each measurement are shown real-time in a color-coded histogram. To see the meaning
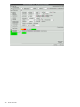
of the color-coding for an item, click on the toolbar for that measurement. For example, to see the
color key for an Ethernet connection histogram, select Ethernet from the xperf toolbar.
The xperf utility 35