
Administrator's Guide
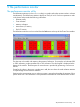
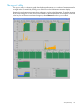
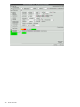

• The node designator, ct465g1n1, is in the upper left corner.
• The center portion displays core usage data for each CPU core in the node. As many as four
CPU cores can be displayed. This examples shows four cores utilized at 100%.
• The right portion of the icon displays memory statistics. This example shows 82% memory
utilization.
• The leftmost arrows at the bottom of the icon represent Ethernet connections. This example
shows two Ethernet connections. As many as four Ethernet connections may be displayed.
• The single rightmost arrow represents I/O activity.
Clicking on an icon launches the xcxperf utility. See “The xperf utility” (page 35) for more
information.
The toolbar menu options are described below.
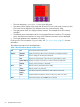
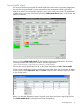
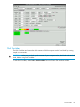
Table 3 The Performance Monitor toolbar menu
Terminates the Performance MonitorExitFile
Specify the utilization data in terms of cumulative or incremental utilizationUtilizationOptions
Opens a dialog box for setting the refresh rateRefresh...
Displays the core utilization in terms of user or system statistics, or bothCPU
Displays the system's total memory or memory used by the applicationSystem Memory
Displays network utilization or bandwidthNetwork
Hide the color key at the bottom of the displayKeyView
Hide the values in the node iconsValues
View the full node name instead of the node number for each nodeFull Node
Names
Scale the Performance Monitor window to 50%, 75%, 100%, and 125%Zoom
Suspends the display until the Hold button is releasedHold
34 The performance monitor