
Administrator's Guide

5 The performance monitor
The performance monitor utility
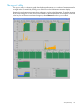
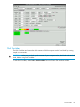
The Performance Monitor (or the xcxclus utility) is a graphic utility that monitors nodes in a cluster
simultaneously. The Performance Monitor displays an array of icons. Each icon represents a node
in the cluster and provides the following information:
• Ethernet activity
• Core utilization
• Memory utilization
• Interconnect I/O activity
• Disk I/O activity
The Performance Monitor can be invoked from the Tools menu at the top of the Cluster Test interface.
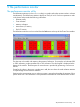
The data are color-coded with respect to the percent of utilization. For example, red indicates 90%
to 100% utilization; purple represents 0% to 10% utilization. The color legend is displayed at the
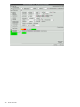
bottom of the window. The description of various boxes is provided by positioning a mouse over
the box.
Except for the values in the arrows, numbers are in MB; the icons show the node utilization statistics
as a percentage of total resource utilization.
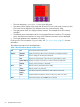
Positioning the mouse pointer over a node icon opens a popup that describes the purpose of that
portion of the icon. This information is also presented in the status bar at the bottom of the window.
The performance monitor utility 33