HP Cluster Test Administration Guide HP Part Number: 5900-3310 Published: January 2014 Edition: 6
© Copyright 2010, 2014 Hewlett-Packard Development Company, L.P. Confidential computer software. Valid license from HP required for possession, use or copying. Consistent with FAR 12.211 and 12.212, Commercial Computer Software, Computer Software Documentation, and Technical Data for Commercial Items are licensed to the U.S. Government under vendor’s standard commercial license. The information contained herein is subject to change without notice.
Contents 1 Varieties of Cluster Test................................................................................5 CT Image................................................................................................................................5 CT Image using a network.........................................................................................................5 RPM..........................................................................................................................
Intended audience..................................................................................................................46 Contacting HP .......................................................................................................................46 Before you contact HP........................................................................................................46 HP contact information............................................................................................
1 Varieties of Cluster Test All the Cluster Test varieties are designed to: • verify the validity of a cluster configuration. • test the functionality of the cluster as a whole, with emphasis on testing interconnect, including the interconnect switch, cabling, and interface cards. • provide stress testing on the cluster nodes.
RPM Cluster Test RPM is installed on an existing cluster as an additional software package. The current cluster settings are not modified. Once Cluster Test RPM is installed and set up, the testing process is the same as Cluster Test Image. The RPM version of Cluster Test: • is available as an RPM. • allows someone with average computing skills to set up and test a High-Performance Computing (HPC) cluster in very little time. • contains software packages, scripts, and CT GUIs.
2 The Cluster Test GUI Starting Cluster Test The entire suite of cluster tests can be invoked through the Cluster Test interface. Start Cluster Test with the command # /opt/clustertest/bin/testnodes.pl A directory for Cluster Test output messages will be created under /opt/clustertest/logs, if it does not already exist. Sequencing will be set to avoid conflict with any other testnodes.pl processes already running.
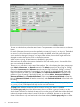
To start an individual test, select that test's button. Test parameters are on the same row as the test button. For each of the tests, the run time can be specified in minutes (m), hours (h), or days (d). The default run time of 0 will run the test for one pass. Normally, the default values are good enough and won't need to be changed. However, in a large cluster solution, these values might need to be changed to reduce the load on CPUs or shorten the test time.
The Clear Log button clears the Cluster Test interface output window. The Test Report button allows users to generate a summary pass/fail report from all test runs. The test report can be found in the current test directory under /opt/clustertest/logs.
Configuration settings Cluster Test provides an interface to modify the Cluster Test configuration settings. The window displays the current configuration settings and allows you to modify any setting. You can access the Cluster Test configuration settings dialog box from the Cluster Test toolbar: File→Config File Settings . This window displays the current admin and interconnect node name settings along with the range of nodes being tested. Simply select a field and modify it to make any changes.
Running tests in a batch The Run All button runs a selection of tests serially. Choose the tests for the batch from the Run All dialog box. Individual tests can be selected by checking or un-checking the boxes. The order test are run in may be changed by editing the Run Order field. This number expresses the ascending order in which tests will be run. To change the order, edit this number to a lower or higher value. Duplicate numbers are allowed.
Using scripts to run tests The Load Cluster Script window (File Load Script) allows you to repeat a previous test. Each time a test is run, the test parameters selected in the GUI are saved to a script file. This script file is then added to a cluster script file that also includes the selected interconnect and the list of active nodes at the time of the test’s invocation. A single cluster script can contain one or more test scripts, as is the case when Run All is used.
The run_cluster_script command basically does the same thing as File Load Script, except you can use run_cluster_script to run tests on independent nodes in the same cluster in parallel. See “Running tests in parallel” (page 41) for important information regarding running multiple cluster tests.
Test descriptions CrissCross In the CrissCross test, nodes take turns sending data packets to every other process. This test is used to determine the maximum point-to-point bandwidth for the interconnect network. CrissCross can be run in Easy or Stress mode. The Easy mode provides a basic connectivity test with small packets. In this mode the actual transfer rates will vary significantly from node to node because of the small packet size.
Linpack Linpack is an industry standard cluster performance test used for submitting numbers to the Top 500 Supercomputers list. The test is implemented to run separately on each node using all CPU cores and about 80% or less of memory. Two parameters need to be specified: Mem(GB) and Mem(%). Mem(GB) is the total memory in gigabytes on each node, and Mem(%) is the percentage of total memory used in the test.
An overall cluster node status bar, Cluster:, indicates the total number of nodes in each state as listed below: • White: currently configured for testing • Green: active admin and interconnect networks • Yellow: only the admin network is active • Orange: only the interconnect network is active • Red: no active networks • Blue: status update is pending • Gray: excluded from this testing A node can be disabled (removed from the test) or enabled (added to the test) by clicking on the node name.
The Comments button allows you to override the test status (Pass or Fail) and enter a comment describing why that status better reflects the actual results. When a test status is overridden, the Comments button on the Testing Summary display changes from grey (no comments or override) to whatever test status the user chose, as does the test name button. The check buttons (stderr, analyze, memerr, and diskerr) will continue to reflect their original status. Select Apply to set the selected status.
Performance analysis After a test has completed, the analyze tool (see “Utility commands” (page 51)) runs on the test output. The analyze tool compares the performance of all tested nodes to the mean value, and identifies the nodes outside the acceptable range. The performance of each node is also compared to the standard deviation. The full analysis is saved to a analysis log file (for example 090406_070956_runstreams.analysis) in the current logs directory.
Test report The Test Report button generates a summary pass/fail report from all test runs. The test report can be found in the current test directory under /opt/clustertest/logs. An example of a test report is shown below.
Checking the InfiniBand fabric The IB Fabric Check allows you to clear and scan the InfiniBand fabric for errors. The ib_fabric_check utility uses scripts provided with the OFED drivers to gather information about the InfiniBand fabric and clear the port counters. See “Utility commands” (page 51) for more details, including sample log files. The recommend usage is as follows: 1. Select the appropriate link speed and clear the fabric. 20 2. Run the initial scan of the fabric. 3.
The Cluster Test toolbar menus The menus File, Tools, and Help are at the top of the Cluster Test interface. Table 1 Cluster Test toolbar menus File Tools Help Debug This function has been deprecated. Config File Settings For Cluster Test RPM only. See “Configuration settings” (page 10). Load Script Select a cluster script to run. See “Using scripts to run tests” (page 12). Exit Close the Cluster Test interface – tests continue running. Performance Monitor Launches the Performance Monitor.
3 The accelerator test GUI IMPORTANT: Accelerator tests are only available with the RPM version of Cluster Test. The Image version does not include accelerator tests. Starting accelerator tests NOTE: Make sure the X server is running and the DISPLAY environment variable is set appropriately. NOTE: Cluster Test will recognize and test nodes with one to eight GPU cards. Start accelerator tests with the command # /opt/clustertest/bin/testnodes.pl -gpu or # testnodes.
NOTE: Remove all files when you are finished testing with accelerator test. Running accelerator tests GPU detection When you start testnodes.pl -gpu, a test is launched to check all nodes for the presence of accelerator cards (GPUs). If any GPUs are detected and they are responsive to communication, the node will be marked by adding /g to the node name in the nodes window. In the example below, each node has three detected and responsive GPUs.
• A Width of x16 is expected for Gen2 GPUs. • The Bus ID can be used to identify the physical location of each GPU. SGEMM: Single Precision General Matrix Multiply Test • The Trans-A setting determines whether the matrix A is to be transposed. The default is N. • ArraySize sets the size of the array to be used. The default is Auto, which means the test will automatically compute the array size. Test results are very sensitive to array size. • GPU sets which GPU to test. The default is all.
Nvidia Linpack: CUDA Accelerated Linpack Benchmark NOTE: For Nvidia GPUs only. This test is implemented to run separately on each node using all CPU cores and all GPUs with about 80% or less of memory. Two parameters must be specified: Mem (GB) and Mem (%). Mem (GB) is the total memory in Giga Bytes on each node and Mem (%) is the percentage of total memory used in the test.
4 Cluster Test procedure as recommended by HP A good cluster solution must pass five mandatory cluster tests: CrissCross, Test4, Stream, Linpack, and Disk Test. The Pallas test is another interconnect test and is recommended as a supplement to CrissCross and Test4. If you have accelerators (GPUs) in your cluster, run the accelerator tests first as described in “Accelerator test procedure” (page 27). If you replace any node in the cluster, it is suggested you run all mandatory tests again.
Accelerator test procedure This is the Cluster Test procedure recommended by HP when your cluster contains nodes with accelerator cards. You should run these accelerator tests and the tests described in “The Cluster Test procedure” (page 29). Each of these tests use default values. You may change parameters as desired, but be careful the current system limits are not exceeded. 1. Make sure the X server is running and the DISPLAY environment variable is set appropriately. 2.
As soon as you start testnodes.pl -gpu a test is launched to check all nodes for the presence of accelerator cards (GPUs). If any GPUs are detected and they are responsive to communication, the node will be marked by adding /g to the node name in the nodes window. In the example below, each node has three detected and responsive GPUs. 4. 5. 6. 28 Compare the number of GPUs indicated in the nodes monitoring window to the actual number of GPUs for each node.
• A Width of x16 is expected for Gen2 GPUs. • The Bus ID can be used to identify the physical location of each GPU. 7. Select SGEMM to start the Single Precision General Matrix Multiply Test. All nodes should report a rate of 520 – 545 Gflop/s. 8. Select DGEMM to start the Double Precision General Matrix Multiply Test. All nodes should report a rate of 200 – 220 Gflop/s. 9. Select BandWidth to start that test. All GPUs should report 5650-5750 MBs.
4. 5. Deselect Test this group only so you will be running tests on the entire cluster. Run the checkadm script to ping all the nodes on the admin network. # checkadm 6. Fix any errors before continuing. See the “Troubleshooting” (page 44) section for information. If the cluster solution has an interconnect network other than the admin network (such as GigE or InfiniBand), run the checkic script to ping all nodes on the interconnection network.
a. Select Stress for the CrissCross test on the Cluster Test interface. Leave the Procs/node value unchanged. Unless you have a cluster of several hundred nodes, leave the default values for Length and Iterations. If you do have a cluster of several hundred nodes, you might need to change these parameters to smaller values, something like Length: 50000, Iterations: 1000, to shorten the test time. NOTE: In general, CrissCross runtime goes up as the square of the number of nodes.
a. b. c. d. The auto Mem(GB) setting selects a memory size for each node that will accommodate the amount of memory available on that node. You may select an explicit size by clicking on the arrow adjacent to the Mem(GB) box. If you have more than one memory configuration in the cluster, select the one with lowest memory. For example, if one node in the cluster is configured with 8 GB and one with 16 GB, you should select 8 in the Mem(GB) box.
5 The performance monitor The performance monitor utility The Performance Monitor (or the xcxclus utility) is a graphic utility that monitors nodes in a cluster simultaneously. The Performance Monitor displays an array of icons.
• The node designator, ct465g1n1, is in the upper left corner. • The center portion displays core usage data for each CPU core in the node. As many as four CPU cores can be displayed. This examples shows four cores utilized at 100%. • The right portion of the icon displays memory statistics. This example shows 82% memory utilization. • The leftmost arrows at the bottom of the icon represent Ethernet connections. This example shows two Ethernet connections.
The xperf utility The xperf utility is a dynamic graph that displays performance on a number of measurements for a single node. It is started by clicking on a node icon on the Performance Monitor display. Statistics for each measurement are shown real-time in a color-coded histogram. To see the meaning of the color-coding for an item, click on the toolbar for that measurement. For example, to see the color key for an Ethernet connection histogram, select Ethernet from the xperf toolbar.
6 Cluster Test tools The tools in this section are run from the Cluster Test interface. Be sure to check for additional tools that run from the command line. Utility commands are listed in “Utility commands” (page 51). Hardware Inventory For the Hardware Inventory tool to work correctly, you must have the HP Lights-Out Online Configuration Utility, hponcfg, or the ipmitool installed, depending on the node model.
Server health check The server health check tool reports the overall health status of the nodes. It generates Temperature, Fan, and Power reports based on values retrieved from the management interface (LO100i or iLO2) of the server. This tool provides reports for every active node in the cluster. The health data is polled every five minutes on the head node if the Enable Health Check option on the Cluster Test interface is selected.
Below is an example Power report. Check a node's Present Power, Average Power, Maximum Power, and Minimum Power. Zeros in power readings indicate that the firmware is not responding to the Power Monitoring module at that time stamp. IMPORTANT: Power Monitoring is not supported on all Cluster Test server models. For more information, contact HP support.
Disk Scrubber The Disk Scrubber tool erases the disk contents of all the compute nodes' hard disks by running simple dd commands. CAUTION: Make sure you back up the contents of your compute nodes, both local and attached disks, before using Disk Scrubber. To start Disk Scrubber, select Tools→Disk Scrubber from the Cluster Test interface toolbar.
Cluster Test tools
7 Running tests in parallel It is possible to run tests on independent groups of nodes in the same cluster in parallel. This is done from the command line, using the run_cluster_script command (see “Utility commands” (page 51)). The run_cluster_script command does basically what the FileLoad Script menu item does in the Cluster Test GUI – loads and runs a cluster script describing one or more tests. (See “Using scripts to run tests” (page 12).
8 Creating and changing per node files NOTE: This section applies only to the image version of Cluster Test. In Cluster Test Image v3.2 and later, per-node files for the compute nodes (used for /tmp, /etc/ sysconfig/network-scripts, and a few other things) are implemented differently than in previous versions. Instead of seeing per-node files on the head node under /shadow with suffixes like $$IP=192.168.1.2$$, they will appear as symbolic links to something under /node-specific/thisnode .
9 NFS performance tuning NOTE: This section applies only to the image version of Cluster Test. Cluster Test Image allows some kernel parameter tuning that improves NFS performance and slow node booting when all the compute nodes are booted simultaneously. These parameters are optimal values derived after evaluation with supported HP hardware. The RPCNFSDCOUNT value is increased to 128 from the default value of 8 in /etc/sysconfig/ nfs. These are the TCP tuning parameters implemented in /etc/sysctl.
10 Troubleshooting Detecting new hardware NOTE: This section applies only to the image version of Cluster Test. When Cluster Test is installed on a head node of a new, unsupported model, or when Cluster Test is booted on a compute node on a new, unsupported model, a menu will be displayed with options for you to choose from. The message will look similar to Model DL370G10 is not supported Your options are: 1) Gather information about this model to send to the ClusterTest team.
Troubleshooting Cluster Test Table 4 Cluster Test Troubleshooting Guide Symptom How to diagnose Possible solution A test terminates right away. Check the message on the output window or • The Platform MPI license has expired. Get terminal: new license and copy it to /opt/hpmpi/ licenses • Cannot check out license • ssh: connect to host 192.168.1.X port 22: • The date and time on the head node is not set correctly. This often happens in No route to host. fresh-from-the-factory machines.
11 Support and other resources Scope of this document The scope of the cluster test administration tasks described in this document is limited to fully cabled Cluster Platform solutions. In general, these will be based on the HP Cluster Platform 3000 (CP3000), 4000 (CP4000), and 6000 (CP6000) product offerings. It is assumed that all component hardware in the solution has undergone full functionality and burn-in using standard manufacturing test procedures.
New and changed information in this edition The following additions and changes have been made for this edition: • Updated default MPI to Open MPI • Updated CMU product name to HP Insight Cluster Management Utility • Updated several screen shots • Updated info for Running tests in a batch • Updated info for Node monitoring • Updated info for Power monitoring • Added archive_logs utility command • Added cpu_rate utility command Related information Documentation All Cluster Test documentation
Hardware vendors • InfiniBand: http://www.mellanox.com Typographic conventions This document uses the following typographical conventions: %, $, or # A percent sign represents the C shell system prompt. A dollar sign represents the system prompt for the Bourne, Korn, and POSIX shells. A number sign represents the superuser prompt. audit(5) A manpage. The manpage name is audit, and it is located in Section 5. Command A command name or qualified command phrase.
use of a Customer Self Repair part, HP will ship that part directly to you for replacement. There are two categories of Customer Self Repair parts: • Mandatory—Parts for which Customer Self Repair is mandatory. If you request HP to replace these parts, you will be charged for the travel and labor costs of this service. • Optional—Parts for which Customer Self Repair is optional. These parts are also designed for customer self repair.
A Useful files and directories Table 5 Cluster Test Useful Files and Directories Location Purpose /etc/dhcpd.conf DHCP configuration file. /opt/clustertest/bin Location of tests and utility commands, including the testnodes.pl Cluster Test user interface. /opt/clustertest/logs Location of test output. /opt/clustertest/logs/server-health/ The results from the server health check tool. 50 /opt/clustertest/model_info Contains information regarding hardware models. It's used by clsetup.
B Utility commands The following utility commands are usually invoked from the head node. NOTE: Cluster Test does not modify the PATH variable on the head node, and therefore any calls to any commands or utilities referenced in this section must be preceded with the path to the command, /opt/clustertest/bin/, unless otherwise noted. analyze Description – The analyze command creates a performance analysis of a test run.
conrep Description – The conrep script is a wrapper to the conrep utility, which will select the appropriate conrep version and xml file for the current platform. The conrep utility is used to read and write system environmental settings. For more information on conrep, refer to the HP SmartStart Scripting Toolkit Linux Edition User Guide. Usage – # conrep -s|-l Files – When reading server environment settings, the output is written to conrep.dat in the current directory.
# ib_fabric_check [clear|scan|fullscan] [] [] [] • clear – The clear option is used to reset the port counters. • fullscan – The fullscan option adds checking the link receive, link down, and port receive port counter errors. • link_speed and link_width – The link_speed and link_width options allow you to indicate the expected link speed and width, respectively.
node6 node8 node3 node4 node8 node7 HCA-1 HCA-1 HCA-1 HCA-1 HCA-1 HCA-1 1 1 1 1 1 1 0 0 0 0 0 0 0 0 0 0 0 0 0 0 0 0 0 0 0 0 0 0 0 0 0 0 0 0 0 0 inspect_ib_fabric.pl Description – The inspect_ib_fabric.pl utility is provided as an additional tool for checking for errors in the InfiniBand fabric. This utility invokes ibnetdiscover and perfquery to detect components in the fabric and check their port counters.
SW00101, SW00102, and SW00103. The actual numeric order is determined by the order the components are listed in the idnetdiscover output. Since the inspect_ib_fabric.pl naming and the default description text might not be enough to easily identify the components in your InfiniBand fabric, there is the –map option to specify your own description text. This mapping file specifies a GUID followed by description text which is fed into ibnetdiscover via its –node-name-map option.
The following is an example of the inspect_ib_fabric.pl –summary output. The following is an example of the inspect_ib_fabric.pl –links output.
The following is an example of the inspect_ib_fabric.pl –linkerrs output. ipmitool Description – The ipmitool is a utility for managing and configuring devices that support the Intelligent Platform Management Interface (IPMI) version 1.5 and version 2.0 specifications. The ipmitool program provides a simple command-line interface to the BMC (Baseboard Management Controller.) This utility is integrated into test images.
Usage – # list_messages [-q] [-[no]messages] [-[no]summary] [-tag ] [-notag ] [-[no]bytest] [-before ] [-after ] [-csv] input-file • -q – Quiet flag – suppresses headings on summary output. • -h | --help | -help – Prints a help message and quits. • -[no]messages – Displays any matching messages (-nomessages is the default) • -[no]summary – Displays summary of mcelog errors; –summary is the default.
C Sample test output CrissCross This sample output of the CrissCross test is with Stress: Length:50000, Iteration: 1000, on a cluster of 22 nodes – (2) HP ProLiant DL385, and (20) DL145 G2. Node0 and node21 are DL385 with PCI-X InfiniBand cards. Node[1– 20] are DL145 G2 with PCI-E InfiniBand cards.
node8 node8 … … … node8 node9 node9 node9 … … … node9 node10 node10 node10 … … … node10 node11 node11 node11 … … … node11 node12 node12 node12 … … … node12 node13 node13 node13 … … … node13 node14 node14 node14 … … … node14 node15 node15 node15 … … … node15 node16 node16 node16 … … … node16 node17 node17 node17 60 Sample test output [ [ 8] 8] =====>> =====>> node1 node2 [ [ 1] 2] 924.5 MBs 924.
… … … node17 node18 node18 node18 … … … node18 node19 node19 node19 … … … node19 node20 node20 node20 … … … node20 node21 node21 node21 … … … node21 [ [ [ [ 17] 18] 18] 18] =====>> =====>> =====>> =====>> node21 node0 node1 node2 [ [ [ [ 21] 0] 1] 2] 718.6 718.4 924.9 924.6 MBs MBs MBs MBs [ [ [ [ 18] 19] 19] 19] =====>> =====>> =====>> =====>> node21 node0 node1 node2 [ [ [ [ 21] 0] 1] 2] 718.6 718.2 924.8 924.
19:48:16 - completed 2180 iterations................... 19:51:12 - completed 2200 iterations................... 19:54:08 - completed 2220 iterations................... 19:57:05 - completed 2240 iterations................... 20:00:02 - completed 2260 iterations................... 20:02:59 - completed 2280 iterations................... 20:05:56 - completed 2300 iterations................... … … … 21:22:17 - completed 2820 iterations................... 21:25:12 - completed 2840 iterations...................
# # # # # # # # # Minimum message length in bytes: Maximum message length in bytes: 0 4194304 MPI_Datatype MPI_Datatype for reductions MPI_Op MPI_BYTE MPI_FLOAT MPI_SUM : : : # List of Benchmarks to run: # # # # # Exchange Sendrecv Bcast Allgather Allreduce #----------------------------------------------------------------------------# Benchmarking Exchange # #processes = 22 #----------------------------------------------------------------------------#bytes #repetitions t_min[usec] t_max[usec] t_avg[
262144 524288 1048576 2097152 4194304 160 80 40 20 10 929.73 1761.65 3170.28 5001.29 4963.40 970.74 1926.17 3827.90 7626.65 15219.00 952.13 1851.64 3529.97 6437.38 10481.13 #---------------------------------------------------------------# Benchmarking Bcast # #processes = 22 #---------------------------------------------------------------#bytes #repetitions t_min[usec] t_max[usec] t_avg[usec] 0 1000 0.03 0.04 0.04 1 1000 27.20 27.32 27.23 2 1000 26.78 26.79 26.79 4 1000 27.36 27.38 27.37 8 1000 27.
4 8 16 32 64 128 256 512 1024 2048 4096 8192 16384 32768 65536 131072 262144 524288 1048576 2097152 4194304 1000 1000 1000 1000 1000 1000 1000 1000 1000 1000 1000 1000 1000 1000 640 320 160 80 40 20 10 42.60 45.14 42.83 46.46 44.62 58.27 61.13 70.58 81.64 113.24 158.73 296.67 534.17 925.54 1643.30 1211.07 2377.06 9937.20 14141.08 23278.50 41601.71 42.61 45.14 42.84 46.46 44.63 58.29 61.15 70.60 81.66 113.29 158.80 296.83 534.48 926.11 1644.20 1211.61 2379.35 9945.09 14171.55 23407.60 42125.80 42.61 45.
node24: Triad: 3078.7949 0.3355 0.3488 0.3536 node24: ------------------------------------------------------------... … … … … node343: ------------------------------------------------------------node343: This system uses 8 bytes per DOUBLE PRECISION word.
node344: ------------------------------------------------------------node344: Solution Validates node344: ------------------------------------------------------------- Disk Test ******************************************************************** Node: node1 - Serial: USE644N3HV Testing random Read/Write for 1200 seconds ******************************************************************** IOIOIOIOIOIOIOIOIOIOI XDD version 6.4.121805.1912MST IOIOIOIOIOIOIOIOIOIOIOI xdd - I/O Performance Inc.
File write synchronization, disabled Pass synchronization barriers, enabled Number of Targets, 1 Number of I/O Threads, 1 Computer Name, node2, User Name, (null) OS release and version, Linux 2.6.18 #6 SMP Thu Nov 2 16:25:15 CST 2006 Machine hardware type, x86_64 Number of processors on this system, 4 Page size in bytes, 4096 Number of physical pages, 4109386 Megabytes of physical memory, 16052 Seconds before starting, 0 Target[0] Q[0], /dev/sda Target directory, ".
- The matrix A is randomly generated for each test. - The following scaled residual checks will be computed: 1) ||Ax-b||_oo / ( eps * ||A||_1 * N ) 2) ||Ax-b||_oo / ( eps * ||A||_1 * ||x||_1 ) 3) ||Ax-b||_oo / ( eps * ||A||_oo * ||x||_oo ) - The relative machine precision (eps) is taken to be - Computational tests pass if scaled residuals are less than 1.110223e-16 16.
============================================================================ T/V N NB P Q Time Gflops ---------------------------------------------------------------------------WR00C2C2 12000 200 1 2 67.02 1.719e+01 ---------------------------------------------------------------------------||Ax-b||_oo / ( eps * ||A||_1 * N ) = 0.0031333 ...... PASSED ||Ax-b||_oo / ( eps * ||A||_1 * ||x||_1 ) = 0.0061184 ...... PASSED ||Ax-b||_oo / ( eps * ||A||_oo * ||x||_oo ) = 0.0012344 ......
============================================================================ T/V N NB P Q Time Gflops ---------------------------------------------------------------------------WR00R2R4 12000 200 1 2 67.71 1.702e+01 ---------------------------------------------------------------------------||Ax-b||_oo / ( eps * ||A||_1 * N ) = 0.0027432 ...... PASSED ||Ax-b||_oo / ( eps * ||A||_1 * ||x||_1 ) = 0.0053566 ...... PASSED ||Ax-b||_oo / ( eps * ||A||_oo * ||x||_oo ) = 0.0010807 ......
D Documentation feedback HP is committed to providing documentation that meets your needs. To help us improve the documentation, send any errors, suggestions, or comments to Documentation Feedback (docsfeedback@hp.com). Include the document title and part number, version number, or the URL when submitting your feedback.
Glossary administration disk The disk located on the image server on which HP Insight CMU is installed. A dedicated space can be allocated to the cloned images. administration network The private network within the system that is used for administrative operations. clone image The compressed image of the installation from the master disk. One clone image is needed for each logical group.
Index A accelerator testing procedure, 27 accelerator test, 22 admin see network analyze command, 51 apply_new_model_updates command, 51 using, 44 archive_logs command, 51 B BandWidth accelerator test, 29 C cabling tables documentation, 47 checkadm command, 51 checkadm command using, 30 checkic command, 51 checkic command using, 30 using for troubleshooting, 45 cluster script, 12 cluster software, 46 Cluster Test, 7 and cluster software, 46 commands, 51 documentation, 47 excluding head nodes, 38 nodes mon
H hardware apply_new_model_updates command, 44 documentation, 47 inventory, 21 unsupported, 44 vendor websites, 48 Hardware Inventory description, 36 requirements, 36 using, 32 head node best CT method for multiple, 5 destruction of information by CT Image, 5 excluding from Cluster Tests, 38 hardware unsupported, 44 HP Lights-Out Online Configuration Utility see hponcfg HP software websites, 47 hponcfg command, 52 using with additional software, 26 using with Firmware Summary, 36 using with Hardware Invento
using, 31 using to troubleshoot Test4, 45 perfquery, 54 procedures running accelerator tests, 27 running Cluster Test, 29 R recommendations conrep command, 52 for performance analysis, 18 for Test4, 14 IB Fabric Check, 20 RPM config file setting, 10 considerations, 6 test kit download, 6 run_cluster_script.