
User's Manual

18 | Monitoring HP Cloud Network Manager | User Guide
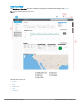
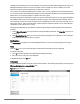
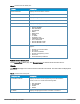
Access points
The Access Points pane displays information about the status and location of the APs.
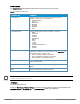
Data pane item Description
FLAGGED AP Displays the APs that are experiencing potential issues with
utilization, noise, and so on. It consists of:
l ACCESS POINTS
l UTIL(%)
l NOISE(dBm)
l ERRORS
l CLIENTS
l MEMORY
l CPU
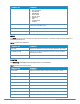
ACCESSPOINTS Displays the geographic location of the APs. It consists of:
l NAME
l LOCATION
l STATUS
l CLIENTS
l IP ADDRESS
l MODE
l TYPE
l 2.4 GHz
l 5.0 GHz
l VIRTUAL CONTROLLER
l UPTIME
l LABELS
Utilization icon Displays the radio utilization rate of the APs. Depending on the
percentage of utilization, the color of the lines on the Utilization icon
changes from Green > Orange > Red.
l Green— Utilization is less than 50 percent.
l Orange— Utilization is between 50-75 percent.
l Red— Utilization is more than 75 percent.
THROUGHPUT graph Displays the aggregate incoming and outgoing data traffic of all APs
over a specified period.
CLIENTS graph Displays the number of clients connected to an AP over a specified
period.
Map
Displays the geographic location of the APs.
Table 3: Contents of the APs pane
You can view the THROUGHPUT graph and CLIENTS graph for a specific timeframe (1 Hour, 3 Hours, 1 Day, 1 Week,
1 Year) by clicking 1H, 3H, 1D, 1W, or 1Y.
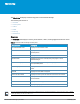
AP details
To view the details of the AP:
Navigate to Monitoring > Access Points pane and click the AP for which you want to view the details under
ACCESS POINTS or FLAGGED AP. The ACCESSPOINT details page is displayed.