
User's Manual

HP Cloud Network Manager | User Guide Monitoring | 17
Monitoring
The Monitoring tab displays the monitoring pane for Cloud Network Manager.
The monitoring tab consists of:
l Overview
l Access points
l Clients
l WIDS
l Event log
l Notifications
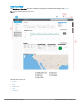
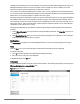
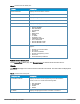
Overview
The Overview pane displays a summary of the networks, clients, and the geographical location of the AP.
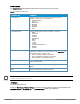
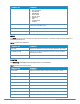
Data pane item Description
ACCESSPOINTS count Displays the total number of APs.
CLIENTS count Displays the total number of clients connected to an AP over a
specified period.
ALERTS count Displays the total number of APs or clients that have alerts.
QUICKLINKS Displays the links to the most frequently used pages in Cloud
Network Manager.
THROUGHPUT graph Displays the aggregate incoming and outgoing data traffic of all APs
over a specified period.
CLIENTS graph Displays the number of clients connected to an AP over a specified
period.
WLANS Displays the list of SSIDs configured.
TOP 5 APs BY USAGE Displays the list of top five APs that are most used on the network.
TOP 5 CLIENTS BY USAGE Displays the list of top five clients utilizing the maximum bandwidth
over the network.
CLIENTSTYPE Displays the different types of clients connected to the network.
Map Displays the geographic location of the APs, clients, and alerts.
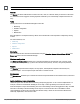
Table 2: Contents of the monitoring overview pane
You can view the THROUGHPUT graph and CLIENTS graph for a specific timeframe (1 Hour, 3 Hours, 1 Day, 1 Week,
1 Year) by clicking 1H, 3H, 1D, 1W, or 1Y.