
HP StorageWorks Fabric OS 6.1.x administrator guide (5697-0234, November 2009)

Fabric OS 6.1.x administrator guide 341
The output is sorted based on the data rate of each flow. If you do not specify the number of flows to
display, then the command displays the top 8 flows or the total number of flows, whichever is less. The
command can display a maximum of 32 flows.
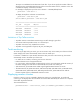
For example, to display the top 5 flows on for domain 1 in WWN (default) format:
perfttmon --show dom 1 5
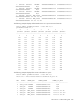
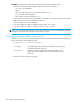
To display the top flows on domain 2 in PID format:
perfttmon --show dom 2 pid
switch:admin> perfttmon --show dom 2 pid
========================================
Src_PID Dst_PID MB/sec
========================================
0xa908ef 0xa05200 6.926
0xa05200 0xa908ef 6.872
0xa905ef 0xa05200 6.830
0xa909d5 0xa05200 6.772
Limitations of Top Talker monitors
• Top Talker monitors cannot detect transient surges in traffic through a given flow.
• You cannot install a Top Talker monitor on a mirrored port.
• Top Talker can monitor only 10,000 flows at a time.
• Top Talker is not supported on VE_Ports, EX_Ports, and VEX_Ports.
Trunk monitoring
To monitor E_Port (ISL) and F_Port trunks, you can set monitors only on the master port of the trunk. If the
master changes, the monitor automatically moves to the new master port.
If a monitor is installed on a port that later becomes a slave port when a trunk comes up, the monitor
automatically moves to the master port of the trunk.
• For Fabric OS 3.x switches, monitoring can be set on slave ISLs.
• End-to-end monitors are not supported for ISLs.
• For F_Port trunks, end-to-end masks are allowed only on the F_Port trunk master. Unlike the monitors, if
the master changes, the mask does not automatically move to the new master port.
• 4/8 SAN Switch, 4/16 SAN Switch models support eight filter-based monitors for trunks.
• The SAN Switch 4/32, 4/64 SAN Switch, SAN Switch 4/32B, 8/8 SAN Switch, 8/24 SAN Switch,
8/40 SAN Switch, 8/80 SAN Switch, 400 Multi-protocol Router, 4/256 SAN Director and DC
Director switches support 12 filter-based monitors for trunks.
Displaying monitor counters
Use the perfMonitorShow command to display the monitors on a specified port. For end-to-end
counters, you can display either the cumulative count of the traffic detected by the monitors or a snapshot
of the traffic at specified intervals.
The command format is:
perfmonitorshow --class monitor_class [slotnumber/]portnumber [interval]