
Brocade Fabric OS Administrator's Guide Supporting Fabric OS v6.3.0 (53-1001336-02, November 2009)
Fabric OS Administrator’s Guide 395
53-1001336-02
Top Talker monitors
17
Adding a Top Talker monitor on an F_Port
1. Connect to the switch and log in as admin.
2. Enter the perfTTmon
--add command.
perfttmon --add [egress | ingress] [slotnumber/]port
For example, to monitor the incoming traffic on port 7:
perfttmon --add ingress 7
To monitor the outgoing traffic on slot 2, port 4 on the Brocade 48000, Brocade DCX, or
DCX-4S:
perfttmon --add egress 2/4
Deleting a Top Talker monitor on an F_Port
1. Connect to the switch and log in as admin.
2. Enter the perfTTmon
--delete command.
perfttmon --delete [slotnumber/]port
For example, to delete the monitor on port 7:
perfttmon --delete 7
To delete the monitor on slot 2, port 4 on the Brocade 48000, Brocade DCX, or DCX-4S:
perfttmon --delete 2/4
Displaying the top
n
bandwidth-using flows on an F_Port
1. Connect to the switch and log in as admin.
2. Enter the perfTTmon
--show command.
perfttmon --show [slotnumber/]port [n] [wwn | pid]
The output is sorted based on the data rate of each flow. If you do not specify the number of
flows to display, then the command displays the top 8 flows or the total number of flows,
whichever is less.
For example, to display the top 5 flows on port 7 in WWN (default) format:
perfttmon --show 7 5
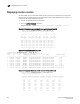
To display the top flows on slot 2, port 4 on the Brocade 48000, Brocade DCX, or DCX-4S in PID
format:
perfttmon --show 2/4 pid
switch:admin> perfttmon --show 2/4 pid
========================================
Src_PID Dst_PID MB/sec
========================================
0xa90800 0xa05200 6.926
0xa90800 0xa908ef 6.872