
Quick Start Guide

Quick Start Guide 33
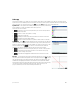
• —Displays the contents of the selected cell in full-screen view (and in textbook format).
• —Displays a menu, where you can choose a column to sort (with a further option to sort in ascending or
descending order). It appears only after you have selected the cells to sort.
• —Displays a menu of formatting options for the selected cell, row, column,
or entire spreadsheet. The formatting options are as follows:
- Name—Displays an input form, where you can give a name to whatever is
selected
- Number Format—Auto, Standard, Fixed, Scientific, or Engineering
- Font Size—Auto or from 10 to 22 points
- Color—Color for the content (text, number, etc.) in the selected cells; the
gray-dotted option represents Auto
- Fill—Background color that fills the selected cells; the gray-dotted option
represents Auto
- Align —Horizontal alignment—Auto, Left, Center, Right
- Align —Vertical alignment—Auto, Top, Center, Bottom
- Column —Displays an input form, where you can specify the required width of the selected columns; only
available if you have selected the entire spreadsheet or one or more entire columns
- Row —Displays an input form, where you can specify the required height of the selected rows; only available if you
have selected the entire spreadsheet or one or more entire rows
- show “—Show quote marks around strings in the body of the spreadsheet—Auto, Yes, No
- Textbook—Display formulas in textbook format—Auto, Yes, No
- Caching—Turn this option on to speed up calculations in spreadsheets with many formulas; only available if you have
selected the entire spreadsheet
Statistics 1Var app
The Statistics 1Var app is designed for the study of univariate statistics. It provides tools for entering numeric data,
calculating 1-variable summary statistics, and plotting 1-variable statistical graphs. The app can exchange data with the
Statistics 2Var app and the Spreadsheet app (explained in the user guide). It can also receive data from the DataStreamer
app and pass summary statistics directly to the Inference app (where you can calculate confidence intervals and test
hypotheses). To open the Statistics 1 Var app, press ! and select Statistics 1Var. The app opens in Numeric view.
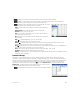
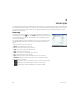
Numeric view The Numeric view provides a table with up to ten columns for data,
named D1 through D9 and D0. The menu items are as follows:
• —Activates the entry line, where you can add a value or change the selected
value.