
Quick Start Guide

26 Quick Start Guide
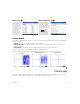
Plot Setup view Press SP to display the Plot Setup view. This view enables you to configure the appearance of
graphs. This view offers the same options as the Plot Setup view of the Function app (see “Function, Advanced Graphing,
Parametric, Polar, and Sequence apps” on page 22), except that there is no Method field.
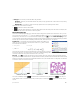
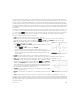
Numeric view Press N to display the Numeric view. For various combinations of X
and Y, Numeric view shows whether the open sentence is satisfied. The illustration at
the right shows that the open sentence 2x – 3y ≤ 6 (defined as V2 in Symbolic view: see
above) is satisfied when X = 4.5 and Y = 1, but not when X = 4.4 and Y = 0.9. You can
enter your own values in the X and Y columns.
The menu items are the same as in the Function app, except that there is also
menu. Options on this menu parallel those in the Plot view.
Parametric app
The Parametric app enables you to define parametric equations and explore their
graphs and tables of values. It is similar in structure and functionality to the Function app. To open the Parametric app, press
! and select Parametric. The app opens in Symbolic view. The information below describes the major differences
between the Parametric app and the Function app (see “Function, Advanced Graphing, Parametric, Polar, and Sequence
apps” on page 22).
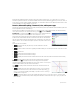
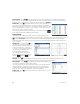
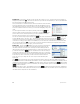
Symbolic view In Symbolic view (@) you
can specify up to ten sets of parametric
equations, each one defining x(t) and y(t) in
terms of t. For example, x = 4∙sin(t) and y =
4∙cos(t) form a set of parametric equations.
Note that the t must be entered as an
uppercase character (T) in this app.
The menu items are the same as in the
Symbolic view of the Function app, except
that here replaces (and
enters a T when tapped).
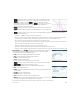
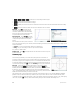
Plot View Press P to display the Plot view and see the graphs of the equations selected in Symbolic view. The
functionality here is the same as in the Function Plot view, except that there are no Fcn functions.
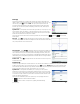
Plot Setup view Press SP to display the Plot Setup view. This view enables you
to configure the appearance of the parametric graphs.
This view is similar to the Plot Setup view of the Function app (see “Function, Advanced
Graphing, Parametric, Polar, and Sequence apps” on page 22), except that it also
contains T Rng and T Step fields. These fields enable you to specify the range and
fineness of the t-values used to generate the (x,y) points for graphing.
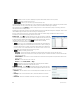
Numeric view Press N to display Numeric view. This view is the same as you see
in the Function app.