
Quick Start Guide

Quick Start Guide 23
• —Displays an input box, where you can specify an x-value and then select
or press E to move the tracer to that value. From Plot view, you can
also enter an x-value to open the input box. The value you entered
automatically populates the input line. Select or press E to confirm the
value and move the tracer to that value. This option provides a quick way to
evaluate a function for a particular x-value.
• —Allows you to use your finger to sketch a function in Plot view and then fit
a common function (linear, quadratic, exponential, logarithmic, or sinusoidal) to the
result.
• —Opens the Function menu, with options to either find the following objects or to sketch a simple function:
- Sketch—Same as previous.
- Transform—Translate or dilate the graph of a sketched fit.
- Definition—View or edit the symbolic definition of the currently selected function (that is, the function that includes
the current trace point). If more than one function is plotted, press U or D to select another function.
- Root—Find the root of the function that is currently closest to the trace point.
- Intersection—Find the intersection of the function that is currently closest to the trace point with one other function.
- Slope—Find the slope of the function at the current trace point.
- Signed area—Find the signed area under a curve or between two curves.
- Extremum—Find an extremum for the function that is currently closest to the trace point.
- Tangent—Draw the tangent to the function that is currently closest to the trace point, through the current trace point.
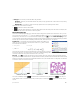
Plot Setup view Press SP to display the Plot Setup view. This view enables you
to configure the appearance of the graphs in Plot view. There are three pages of
options. The fields on the first page are as follows:
• X Rng—Horizontal graphing range (minium and maximum)
• Y Rng—Vertical graphing range (minium and maximum)
• X Tick—Horizontal tick mark spacing
• Y Tick—Vertical tick mark spacing
The menu items on the first page of this view are as follows:
• —Makes the selected value editable. (You can also just tap the field twice.)
• —Displays the second page of options
The second page of the Plot Setup view provides the following options:
• Axes—Shows or hides the axes
• Labels—Shows or hides the axis labels (that is, the values of X Rng and Y Rng at the
end of the axes)
• Grid Dots—Shows or hides grid dots
• Grid Lines—Shows or hides grid lines
• Cursor—Selects the standard, inverting, or blinking cursor
•
Method—Lets you choose between adaptive, fixed-step segments, and fixed-step
dots methods of graphing (see “Graphing methods” on page 21)
The menu items in this view—which vary according to where your cursor is—are as follows: