HP Prime Graphing Calculator Quick Start Guide
© Copyright 2015, 2016 HP Development Company, L.P. The information contained herein is subject to change without notice. The only warranties for HP products and services are set forth in the express warranty statements accompanying such products and services. Nothing herein should be construed as constituting an additional warranty. HP shall not be liable for technical or editorial errors or omissions contained herein.
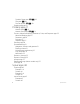
Keyboard legend Number Feature 1 LCD and touch screen: 320 × 240 pixels 2 Context-sensitive touch-button menu 3 HP Apps keys 4 Home view and Home preference settings 5 Common math and science functions 6 Alpha and Shift keys 7 On, Cancel, and Off key 8 List, matrix, program, and note catalogs 9 Last Answer key (Ans) 10 Enter key 11 Backspace and Delete key 12 Menu (and Paste) key 13 CAS view and CAS preference settings 14 View (and Copy) key 15 Escape (and Clear) key 16 Help k
Quick Start Guide
Getting Started 9 Charging the battery 9 Installing the software 10 Turning the calculator on and off 10 Resetting the HP Prime calculator 10 Home view 10 Navigation 11 Touch gestures 11 Home Settings 12 Entering and editing expressions 13 Methods 13 Example 13 Entering text 14 Editing, deleting, and clearing 14 Last answer 14 Using variables 14 Copy and paste 15 Getting help 15 Menu items 16 Check boxes 16 Choose boxes 16 Input fields 16 Computer algebra system (CAS) 16 CAS settings 17 CAS calculations: So
Symbolic Setup view: S@ 20 Plot view: P 20 Plot Setup view: SP 20 Graphing methods 21 Primary apps 21 Numeric view: N 21 Numeric Setup view: SN 21 Function, Advanced Graphing, Parametric, Polar, and Sequence apps 22 Advanced Graphing app 25 Parametric app 26 Polar app 27 Sequence app 27 Geometry app 28 Spreadsheet app 31 Navigation, selection and gestures 31 Entering content 31 Cell references and naming 32 Copy and paste 32 Menu items 32 Statistics 1Var app 33 Statistics 2Var app 35 Inference app 37 Data
Triangle Solver app 42 Example 42 Solution 43 Explorer apps 43 Linear Explorer and Quadratic Explorer apps 43 Trig Explorer app 45 Creating customized apps 46 Toolbox menus 46 Math menu 46 Menu format 47 CAS menu 47 App menu 47 User menu 48 Catalog Menu (Catlg) 48 Catalogs and Editors 48 List Catalog and Editor 49 Matrix Catalog and Editor 49 Program Catalog and Editor 51 Note Catalog and Editor 52 Quick Start Guide 7
Quick Start Guide
1 Getting Started The HP Prime Graphing Calculator is an easy-to-use yet powerful graphing calculator designed for secondary mathematics education and beyond. It offers hundreds of functions, and includes a computer algebra system (CAS) for symbolic calculations. This quick start guide covers basic tasks, such as entering and editing expressions, plotting their graphs, and creating tables of values generated by expressions. It also serves as an introduction to HP apps.
When the calculator is on, a battery symbol appears in the title bar of the screen. Its appearance will indicate how much power the battery has. A flat battery will take approximately 4 hours to become fully charged. WARNING! - To reduce the risk of fire or burns, do not disassemble, crush or puncture the battery; do not short the external contacts; and do not dispose of the battery in fire or water.
expression, list, matrix, line of programming code, etc. The menu buttons are options that are relevant to the current display. These options are selected by tapping the corresponding menu button. (Only a labeled button has a function.) Some menu buttons open a further menu. To close such a menu without making a selection from it, press &. Navigation The HP Prime calculator offers two modes of navigation: touch screen and keyboard.
Touch gestures may not be supported in all apps, editors, and input forms, and their function might vary. Keep the following guidelines in mind: • In Plot view, if a 2-finger pinch zoom gesture is performed horizontally, the zoom is performed on the x-axis only. If a 2-finger pinch zoom is performed vertically, the zoom is performed on the y-axis only. If a 2-finger pinch zoom is performed diagonally, a square zoom is performed (that is, the zoom is performed on both axes).
• Tap one of the angle icons to change the angle measure mode (radians or degrees). • Tap the date/time to open a monthly calendar. You can navigate between months to find specific dates. • If your HP Prime calculator supports wireless connectivity, tap the wireless icon to connect to the nearest HP Wireless Classroom Network or to disconnect from the current HP Wireless Classroom Network. To reset a field to its default value, move the cursor to that field and press \.
Entering text The common alphabetic characters (a–z and A–Z) can be entered from the keyboard. To enter an uppercase alphabetic character, first press A and then the key that has that character printed on it in orange. Thus to print F, enter Af. To enter a lowercase character, first press AS and then the key that has that character printed on it in orange. Thus to print f, enter ASf. The keyboard can be locked so that all subsequent characters are uppercase without the use of A.
The HP Prime calculator keeps a list of all the variables you create. You can see this list by pressing a, tapping , and selecting User Variables. A list of user-defined variables appears. To use a listed variable in a current calculation, select it from the list. To delete a listed variable, use the cursor keys to highlight it and then press \. Copy and paste Copy-and-paste functionality is available. The copy options vary depending on where you are in the calculator.
There is extensive help available for each command. The help provides the syntax of each command, a description of the command, and an example. If you enter a command but need the syntax, press ^ to display its syntax. For example, if you have entered int( ) in CAS view, pressing ^ displays help on the integral command. Finally, if you have online help open, you can tap and enter a keyword to search help for that keyword.
To open the CAS, press C. The CAS view that appears is similar to the Home view. Previous CAS calculations are recorded in history and you can re-use an expression or result in exactly the same way: by selecting it and tapping . Other general operations are exactly the same. For example, pressing & clears the entry line, and pressing S& clears the entire history. The menu buttons in CAS view are as follows: • —Assigns an object to a variable (see “CAS menu” on page 47).
7. Note that the input and result appear in history, where you can select them for re-use. We will now re-use the function to determine the remainder of the division. 8. Tap the function and then tap . The expression is copied to the entry line. 9. Using the cursor keys and the \ key, change quo to rem. 10.Press E to see the result: 26 CAS menu By default, a CAS function is presented on a CAS menu using its descriptive name, not its command name.
HP app name Purpose Datastreamer Collect real-world data using sensors and the HP StreamSmart 410 Solve Solve an equation for one of its variables or solve a system of linear or non-linear equations Parametric Define parametric equations and explore their graphs and tables of values Polar Define polar equations and explore their graphs and tables of values Sequence Define sequences and explore graphs and tables of values The three specialized Solvers—outlined in the following table—are designed
Note that the connectors on the ends of the USB cable are slightly different. The micro-A connector has a rectangular end and the micro-B connector has a trapezoidal end. To share objects with another HP Prime calculator, the micro-A connector must Micro-A: sender Micro-B: receiver be inserted into the USB port on the sending calculator, with the micro-B connector inserted into the USB port on the receiving calculator.
Numeric view: N Numeric Setup view: SN This view displays a table of evaluations. It also enables you to enter specific values to be evaluated. In most apps, this view evaluates according to the definitions specified in the Symbolic view. It serves a different purpose in other apps, such as the Statistics, Spreadsheet, and Geometry apps. This view enables you to set the appearance of the Numeric view (such as the starting number, increment, and type of table: automatic or build-your-own).
All the primary variables entered in expressions and open sentences in these apps—X, Y, T, θ, N, and so on—must be entered as uppercase characters. User-defined variables can be incorporated, and these can be in any case: upper, lower, or mixed. Thus, if you have created a variable called Cost, you could define a function as X2+Cost. (For instructions on how to create variables, see “Using variables” on page 14.
• —Displays an input box, where you can specify an x-value and then select or press E to move the tracer to that value. From Plot view, you can also enter an x-value to open the input box. The value you entered automatically populates the input line. Select or press E to confirm the value and move the tracer to that value. This option provides a quick way to evaluate a function for a particular x-value.
• —Displays a menu of options. (Displayed only if the selected field offers a menu of options.) • —Toggles the current setting on or off. • —Returns you to the first page of the Plot Setup view. The third page of Plot Setup view allows you to choose an image for the background and to configure its appearance in Plot view. The first box is a drop-down menu that provides options to define how the image is displayed. Next to that first box is the Opacity box.
• Num Type—Choose how you want the table to be generated: - Automatic—Based on your Num Start and Num Step values, the app generates the x-values and the corresponding function values. - BuildYourOwn—You enter the x-values and the app generates the corresponding function values. The menu items in this view are as follows: • —Makes the selected value editable. • —Sets Num Start and Num Step so that the table values match the settings in the Plot view.
Plot Setup view Press SP to display the Plot Setup view. This view enables you to configure the appearance of graphs. This view offers the same options as the Plot Setup view of the Function app (see “Function, Advanced Graphing, Parametric, Polar, and Sequence apps” on page 22), except that there is no Method field. Numeric view Press N to display the Numeric view. For various combinations of X and Y, Numeric view shows whether the open sentence is satisfied.
Polar app The Polar app enables you to define polar equations and explore their graphs and tables of values. It is similar in structure and functionality to the Function app. To open the Polar app, press ! and select Polar. The app opens in Symbolic view. The information below describes the major differences between the Polar app and the Function app (see “Function, Advanced Graphing, Parametric, Polar, and Sequence apps” on page 22).
• • • • , , , —Enters the corresponding text when tapped —Cancels the current addition or change —Accepts the current addition or change —Displays the selected sequence in textbook format in full-screen view (with vertical and horizontal scrolling enabled) • —Resolves references when one sequence is defined in terms of another Plot view Press P to display the Plot view and see the graphs of the sequences selected in Symbolic view.
Each geometric object you create is given a name. This includes the points that make up a multi-point object. Thus if you create a polygon, the polygon is given a name, and so too is each point at each vertex and each segment. If you create a circle, the circle is given a name (C in the example above). So too is the center point (A) and the point on the circumference (B). To select a point in Plot view, just tap it.
Symbolic view Every object—whether a point, segment, line, polygon, or curve—is given a name, and its definition is displayed in Symbolic view (@). The name is the name for it you see in Plot view prefixed by “G”. Thus a point labeled B in Plot view is given the name GB in Symbolic view. The G-prefixed name is a variable that can be referenced in Numeric view (see below) and in CAS calculations.
Plot Setup view This view enables you to customize the appearance of Plot view. The Xmin, Ymin, and Pixel Size boxes allow you to set the dimensions of Plot view, subject to the restriction that the pixels in Plot view are always square with respect to Cartesian units. After you edit these three boxes, the Xmax and Ymax fields are calculated automatically. The rest of the boxes in this view are common to most of the apps, such as X Tick, Y Tick, and so on. There is also an additional check box, Scroll Text.
1. Tap the cell with the HP logo in it (at the top left corner). Alternatively, you can use the cursor keys to move to that cell (just as you can to select a column or row heading). 2. On the entry line type S.RowfnCol+1 Row and Col are built-in variables. They represent the row number and column number, respectively, of the cell that has a formula containing those values. 3. Tap or Press E. Each column gives the nth power of the row number starting with the squares. Thus 95 is 59,049.
• • —Displays the contents of the selected cell in full-screen view (and in textbook format). —Displays a menu, where you can choose a column to sort (with a further option to sort in ascending or descending order). It appears only after you have selected the cells to sort. • —Displays a menu of formatting options for the selected cell, row, column, or entire spreadsheet.
• —Opens an edition options menu. - Insert • Row—Inserts a new row in the current list. The new row contains 0 as its element. - Delete • Column—Deletes the contents of the current list. To delete a single element, select it and then press \. - Select • Row—Selects the current row. After it is selected, the row can be copied. • Column—Selects the current list. After it is selected, the list can be copied.
• —Displays the selected equation in textbook format and in full-screen view (with vertical and horizontal scrolling enabled) • —Resolves references when one equation is defined in terms of another Plot view Press P to display the Plot view. This view displays the selected 1-variable statistical plots for each selected analysis. The menu is similar to the Function Plot view, with options for zooming and tracing (but without a Go To or Fcn option). Plot Setup view Press SP to display the Plot Setup view.
• • —Enters an X when tapped; visible only when a Fitn field is selected. —Specifies whether a graph of the type chosen will be plotted when you display Plot view. If this is not selected, only the data points are plotted. • —Displays the selection in textbook format in full-screen view; visible only when an Sn or Fitn field is selected. • —Evaluates the variables in whatever is selected; visible only when an Sn or Fitn field is selected.
Inference app The Inference app provides tools for inferential statistics, enabling you to specify confidence intervals and test hypotheses. Summary statistics from any column in the Numeric view of the Statistics 1Var or Statistics 2Var app can be imported into it. To open the Inference app, press ! and select Inference. The app opens in Symbolic view. Symbolic view This view provides fields where you can define a confidence interval or hypothesis test.
First, connect the HP StreamSmart 410 to the HP Prime calculator and then connect between one and four sensors to the HP StreamSmart. Open the DataStreamer app by pressing ! and selecting DataStreamer. The app searches for any sensors that are connected to the calculator and, when it finds them, prompts you to start the data capture by tapping . The DataStreamer app starts in Plot view. This view graphically displays the data from 1 to 4 sensors as a live time graph called a data stream.
Solve app The Solve app enables you to define up to ten equations, each with as many variables as you like. You can solve a single equation for one of its variables, based on a seed value. You can also solve a system of equations (linear or non-linear), again using seed values. To open the Solve app, press ! and select Solve. The app opens in Symbolic view. Symbolic view The Symbolic view enables you to specify the equations, each with as many variables as you like. The variables must all be uppercase.
4 Solver apps The HP Prime has three Solver apps, each designed to solve problems of a specific type: a Finance app, a Linear Solver app, and a Triangle Solver app. The Finance app solves time-value-of-money (TVM) and amortization problems, the Linear Solver finds solutions to systems of linear equations, and the Triangle Solver finds measures of angles and lengths of sides in problems involving triangles. Finance app The Finance app solves time-value-of-money (TVM) and amortization problems.
Example 1 You finance the purchase of a house with a 30-year loan at 6.5% annual interest. The cost of the house is $180,000 and you make a down payment of $30,000. Thus a net $150,000 is financed. How much is the required monthly payment? Assume payments start at the end of the first period. You enter the data as shown in the first figure at the right. Solution Example 1 Solution Highlight the PMT field (as it is the payment value we want to calculate). Tap . The payment value is calculated.
Linear Solver app The Linear Solver app solves 2×2 and 3×3 systems of linear equations. To open the Linear Solver app, press ! and select Linear Solver.The Linear Solver app has two pages: one for 2×2 systems and the other for 3×3 systems. By default, the 3×3 page is displayed on opening. Enter a value for the coefficient of each linear equation and note the solution given below the equations. The solution shown constantly changes as you add or change the coefficients of the equations.
Solution 1. If necessary, tap to set the angle measure to degrees. 2. Enter a = 9, b =6, and B = 30. 3. Tap to see the result. The length of the third side is shown as c =11.76… Angles A and C are also calculated. Note that in this case, there is a second solution, indicated by the presence of a new menu item: . Tap to see the second solution: c = 3.825… Press again to see the earlier result.
The left half of the display shows the graph of a quadratic function. The right half shows the general form of the equation being explored (at the top) and, below it, the current equation of that form. Symbols of the keys you can use to manipulate the equation or graph appear below the equation. (These are called change keys.) In the example at the right, the symbols represent the keys R, L, U, D, +, m, and : (reading from left to right).
• • • • • —Within each level of equation there are a number of less difficult graphs. Tap this button to cycle through them. A dot on the button ( ) indicates that you are testing yourself on one of the less difficult graphs. —Chooses various forms of equation: there are two in the Linear Explorer and four in the Quadratic Explorer. —Lets you check your current answer against the correct answer. —Displays the correct answer. —Returns to Plot view.
Press Q to change the sign of parameter a. Tap to enter test view. In test view you can test your skill at matching an equation to the graph shown. Test view is like equation mode in that you use the cursor keys to select and change the value of each parameter in the equation. The goal is to try to match the graph that is shown.
1. Press b (and tap if necessary). 2. Select Arithmetic from the main menu, Complex from the sub-menu, and Conjugate from the sub-sub-menu. The appropriate syntax—CONJ()—appears on the entry line ready for you to specify the complex number. 3. Enter 6+4*i between the parentheses and press E. The result is 6–4*i. Menu format By default, a function is presented on a math menu using its descriptive name, not its command name.
User menu The User menu lists user-defined functions and programs. For example, using the Define feature (Sc) you can define your own functions. The name you give to a function will appear on the User menu. You could, for instance, create the function SIN(X)+COS(Y) and name it SINCOS. SINCOS will then appear on the User menu. If you choose it, SINCOS() will appear at the position of the cursor. You then enter the arguments you specified when creating the function. Thus SINCOS(0.5,0.75) will yield 1.
List Catalog and Editor You can create lists of real numbers, complex numbers, expressions, matrices, and other lists. You can also perform certain mathematical operations on lists. Press S 7 to display the List Catalog. Up to ten lists can be stored in the catalog, each named L1–L9 or L0. The menu items in the List Catalog are as follows: • —Opens the selected list so that you can add or change elements. You can also just tap the list name. • —Deletes the contents of a selected list.
When you select a matrix, the Matrix Editor opens. The menu items in the Matrix Editor are as follows: • —Copies the selected element to the entry line, where it can be edited. This item is visible only when an element in the matrix or vector is selected. • —Opens an editing options menu. This menu contains options similar to those in the List Editor More menu, but with addition options used only for editing matrices. The options are as follows.
Program Catalog and Editor The HP Prime has a powerful programming language that can be put to many uses. Programs are created and modified in an editor and stored in a catalog. Press S1 to display the Program Catalog. You can edit, run, and debug a program, and send it to another HP Prime calculator. You can also rename or remove programs.
Note Catalog and Editor The HP Prime calculator has a note-recording feature that enables you to build a library of notes. Press S0 to display the Note Catalog.