
User Manual
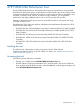

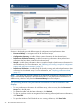
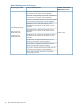

Sections in the display provide different types of configuration and performance data:
• Discovered Arrays—A navigation tree of all discovered arrays
• Configuration Summary—A table of basic system information for the selected array
• Performance Collection Summary—A table summarizing information about performance
collections that have been created for the selected array
• Sample—A table listing information about a snapshot sample of performance information for
the selected array. For more information, see “Obtaining and viewing a sample of configuration
settings and performance statistics” (page 27).
• Performance Collections—A table listing all currently running and archived performance data
collections for the selected array. For more information, see “Graphing performance data”
(page 27).
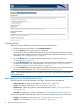
NOTE: If an array was previously selected in the Arrays tab, performance information for that
array is automatically displayed in the Performance tab. To view performance information for a
different array, select an array from the Discovered Arrays list in the left pane.
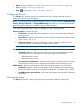
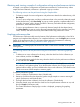
The following actions are provided at the bottom of the Performance tab
display:
• To view performance information for a different array, select an array from the Discovered
Arrays list in the left pane.
• To update the tables with the latest information, click Refresh.
• To open an explorer window to navigate to files containing collected performance information,
click View Files.
• To open the Windows Task Scheduler to view running collections, click View Tasks.
26 HP P2000 MSA Performance Tool