
User's Manual

HOLUX GPSport 260
24
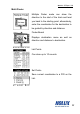
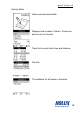
Plot Mode
Plot mode can show a graph of the track
log. It can also show the track in real time.
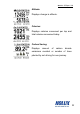
View Plot
Displays the graph for altitude versus time.
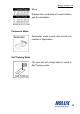
Use the up and down buttons to zoom in
and out. Use the right button to select the
x- and y- axis for the graph.
The following x- and
y-axis combinations
are available:
Altitude + Time
Altitude + Distance
Speed + Time
Speed + Distance
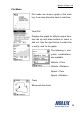
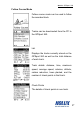
Track
Show real-time track