
User Manual


Page 18 of 40 FIREli nk - 25 – Installation Manual
© 2010 Hochi ki E ur ope ( UK) Ltd
9-5-0-344/ISS4/OCT10
2.10 Chart Recording
The c har t r ec or ding function sho ws how smok e density in the prot ect ed ar ea has vari ed ov er time. The
chart may be downloaded to disk or printed out from a connected printer.
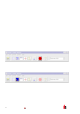
To ac c ess the chart log, sel ec t t he m enu options View > Chart Recording or cli ck t he butt on on the
toolbar as indicated below:
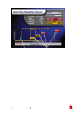
The following scr een is displayed:
The r ed trace is the current alarm level and the bl ac k trace is the detector output. By moving the cursor
along the chart, the “Chart informati on” window (sho wn at t he bott om left ) updates to show t he date and
time, detector lev el and alarm l ev el of the relev ant period. The File menu op tion in the chart recording
windo w allows the chart recording to be saved to disk or pri nted t o a connected printer, and allows a
previously saved chart r ec or ding to be loaded. Chart recording files have the extensi on “ .rcw”.
2.11 Load / Save Function Settings
Where a custom set of progr ammable function settings is comm only used, these may conveni ently be
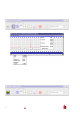
saved to or loaded from disk. To open a detect or func tion settings (.dfs) file, select the m enu options Fil e
> Open or cli c k on the butt on on the toolbar as indicated below:
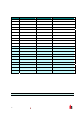
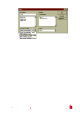
A fil e br owser window will be displ ay ed, click on the “List files of type” drop- down box and sel ec t “Detector
settings (*.dfs)” as indicated below: