
User Guide


Getting Started: Using HOBOware with HOBO Data Loggers 17
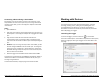
Plotting and Analyzing Data
After you read out a logger and save the datafile, or any time you open
an existing file, the Plot Setup window appears. Even if you only intend
to export the data to another format, you must plot the data first.
18 Getting Started: Using HOBOware with HOBO Data Loggers
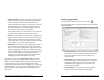
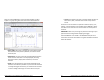
The Plot Setup window contains the following information:
• Description. This field shows the description you entered at
launch time. Keep this description or type a new one. The
description will be the title of the plot.
• Select Series to Plot. Select the series you want to appear on
the graph and the units, if applicable. Some series will be
selected automatically. Click the checkboxes to select other
series or use the All and None buttons for selecting and
deselecting all series.
• Select Internal Logger Events to Plot. Select any events you
want to appear on the graph, if applicable. Use the All and None
buttons to select or deselect all events.
• Offset from GMT. This field shows the offset from Greenwich
Mean Time (GMT), also known as UTC, used at launch. Keep the
offset shown or change it to a different one.
• Data Assistants. You can create new data series by converting
logged data to other useful formats with Data Assistants. Only
the Data Assistants supported by that logger type will be
available in this window. See the HOBOware User’s Guide for
more information about using Data Assistants.
• Plot Button. Click Plot to display the selected sensor data on a
graph.