
User Guide


Getting Started: Using HOBOware with HOBO Data Loggers 13
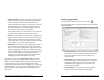
• Logger Information. The name of the logger currently selected
appears at the top of this pane, which also includes the serial
number, deployment number, and current battery level.
Use the Description field to type up to a 40-character name for
the logger deployment. This description will be used as the
default file name when you read out the logger and save the
data. It will also be the default title on the plot.
Click the Status button in this pane to see the current status of
the logger and the settings used on the previous launch.
• Sensors. This pane displays a list of the sensors available for the
logger. Choose the sensors, or channels, that you wish to log in
this deployment, and select any external sensors you may be
using, if applicable. This pane also displays any utilities available
for your logger, such as Alarms, Scaling, and Filters.
• Deployment. Use this pane to set the logging interval, which is
the rate at which you want the logger to record data, and to
select when you want the logger to start logging. This pane also
displays the logging duration, which is the approximate time it
will take to fill the logger memory based on the logging interval,
sensors, and other settings currently selected. For some
loggers, you can also set a sampling interval, choose when to
stop logging, and select other options in this pane.
To configure a test launch, set Start Logging to Now, choose a fast
logging interval (such as 30 seconds), change any other settings as
desired, and then click Start. HOBOware displays the progress of the
launch and warns you not to unplug the logger while it is being
configured. Normally, when the launch is finished, you can unplug the
logger and deploy it. For this test, leave the logger plugged in so you
can become familiar with checking the status, reading it out, and
plotting data.
14 Getting Started: Using HOBOware with HOBO Data Loggers
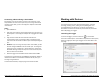
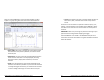
Checking Logger Status
To check the status, click the Status icon on the toolbar.
The Status window appears, displaying information about the device
as described below.
• Device Identification. This pane displays identifying information
for the device currently connected, including the device type,
description entered at launch time, serial number, and
firmware version.
• Device Details. This pane displays specifics about the device,
including battery level, memory used, when it is scheduled to
stop logging (if applicable), when it was last launched, the
deployment number, logging interval, current status and
current state (if applicable).
• Current Readings. This pane shows the latest readings for
configured sensors and derived series (if applicable).