
User Guide

Getting Started: Using HOBOware with HOBO Data Loggers 19
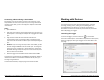
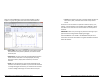
After you click the Plot button in the Plot Setup window, the data
appears in a graph along with other information described below.
• Points Table. Data points, including any internal events if they
were selected in the plot setup window, are listed in a table
above the plot.
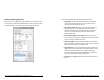
• Details Pane. The pane on the left shows detailed information
about the series and events currently displayed, including
device information, deployment information, and series
statistics.
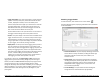
• Graph. The plot displays the series and (if applicable) events
selected in the Plot Setup window. If you ran the test described
in Testing the Logger and Sensors, you should see the variances
in sensor readings and changes in internal state on the plot.
20 Getting Started: Using HOBOware with HOBO Data Loggers
• Legend. The legend to the right of the plot displays the keys for
each sensor, state, and event series as well as any internal
events.
Click the icons on the toolbar to experiment with the export, print,
viewing, and customization tools available within HOBOware. Hover
the mouse cursor over each icon on the toolbar for a description of
each tool.
IMPORTANT: Make sure you change any test launch settings to your
preferred launch settings before deploying the logger.
See the HOBOware User’s Guide or the HOBOware Help for more
information on features described in this guide and additional details
about the software.