
User Manual

HOBO 4-Channel Analog Data Logger (UX120-006M) Manual
7
• The minimum, or lowest, sampled value,
• An average of all sampled values, and
• The standard deviation from the average
for all sampled
values.
For example, let’s say the logging interval is set to 5 minutes
and the sampling interval is set to 30 seconds (with maximum,
minimum, average, and standard deviation all enabled). Once
logging begins, the logger will measure and record the actual
sensor values every 5 minutes. In addition, the logger will take
a sample every 30 seconds and temporarily store it in memory.
The logger will then calculate the maximum, minimum,
average, and standard deviation using the samples gathered
over the previous 5-minute period and log the resulting
value(s). When reading out the logger, this would result in 5
data series for each channel: one sensor series (with data
logged every 5 minutes) plus four maximum, minimum,
average, and standard deviation series (with values calculated
and logged every 5 minutes based on the 30-second sampling).
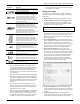
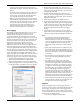
To set up statistics:
1. Select Statistics for Logging Mode in the Launch
Logger
window. If Statistics has already been configure
d
for this
logger, cli
ck the Edit button in the Launch Logger
window.
2. Click the Maximum, Minimum, Average, and Standard
Deviation checkboxes for each of the statistics you want to
calculate during logging. Note that Average is automatically
enabled when selecting Standard Deviation. In addition, the
more statistics you record, the shorter the logger duration
and the more memory is required.
3. Set the sampling interval, which must be less than and a
factor of the logging interval. Choose either a preset
sampling interval or select Custom and enter your own
sampling interval. Keep in mind that the more frequent the
sampling rate, the greater the impact on battery life.
4. Click OK when done. This will return you to the Launch
Logger window. Click the Edit button next to Logging Mode
in the Launch Logger window to make additional changes.
Once logging begins, click the Alarm/Stats button on the logger
to cycle through the current maximum, minimum, average, and
standard deviation data on the LCD screen. You can plot the
statistics series once you read out the logger.
Reading Out the Logger
To read out the logger, connect it to the computer with a USB
cable. In HOBOware, select Readout from the Device menu. You
can then save the data, plot it, and export it for further analysis.
Refer to the HOBOware Help for details.
Recording Internal Logger Events
The logger records the following internal events to track logger
operation and status. You can plot these events in HOBOware
after reading out the logger and opening the data file.
Internal Event Name Definition
Host Connected The logger was connected to the computer.
Started The Start/Stop button was pressed to begin
logging.
Stopped The logger received a command to stop
recording data (from HOBOware or by
pushing the Start/Stop button).
Button Up/Button
Down
The Start/Stop button was pressed for
1 second.
Chan <#> Alarm
Tripped
An alarm has tripped on that channel.
Chan <#> Alarm
Cleared
An alarm has cleared on that channel. This
event also contains the value that was
furthest out of range for the sensor before
the alarm cleared.
New Interval The logger has entered or exited burst
logging mode.
Safe Shutdown The battery level dropped below 1.85 V; the
logger performs a safe shutdown.
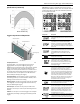
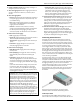
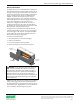
Mounting the Logger
There are several ways to mount the logger using the materials
included:
• Use the four built-in magnets on the back of the lo
gger to
mount it to a magnetic surface.
• Attach the Command strip to the back of the logger to
mount it a wall or other flat surface.
• Use the double-sided tape to affix the logger to a surface.
• Insert the hook-and-loop strap through the moun
ting
loops on both sides of the logger to mount it to a curved
surface, such as
a pipe or tubing.
Protecting the Logger
The logger is designed for indoor use and can be permanently
damaged by corrosion if it gets wet. Protect it from
condensation. If the message FAIL CLK appears on the LCD
screen, there was a failure with the internal logger clock
possibly due to condensation. Remove the batteries
immediately and dry the circuit board.
Note: Static electricity may cause the logger to stop logging.
The logger has been tested to 8 KV, but avoid electrostatic
discharge by grounding yourself to protect the logger. For more
information, search for “static discharge” in the FAQ section on
onsetcomp.com.