
User Manual

67
────────────────────────────────────────────────────
4.3 STATUS Settings (FFT)
────────────────────────────────────────────────────
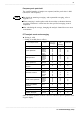
4.3.14 Setting the X-axis and Y-axis Displays
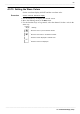
Function
display
Meaning
:
Real number part (linear display)
:
Imaginary number part (linear display)
:
Amplitude (linear display)
:
Amplitude (decibel display)
:
Phase (degree display)
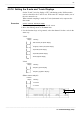
Function
display
Meaning
:
Frequency (linear display)
:
Frequency (logarithm display)
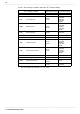
Function
display
Meaning
:
1/3 octave
:
1/1 octave
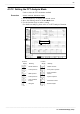
Flashing cursor
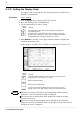
Set the X and Y axis for display of FFT calculation results. Different units
can be selected for the X and Y axis. With some FFT analysis modes, one of
the axis cannot be set.
When external sampling is used, the X-axis (horizontal axis) expresses the
data count.
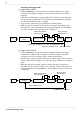
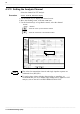
Procedure Screen: STATUS, Waveform display
1. Use the Menu keys to display the desired screen.
2. Move the flashing cursor to the
YAxis
item.
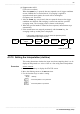
3. Use the function keys or Jog control, select the channel. Set the x-axis in the
same way.
Y Axis
X Axis
(When octave analysis)