
User Manual


59
────────────────────────────────────────────────────
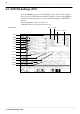
4.3 STATUS Settings (FFT)
────────────────────────────────────────────────────
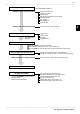
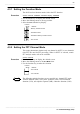
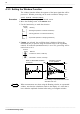
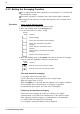
4.3.8 Setting the Display Format
Function
display
Meaning
:
Single screen
:
Dual screen
:
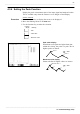
Nyquist screen
Single graph
Displays the waveform on a
single screen.
Dual graph
Nyquist graph
Divides the waveform display
screen into upper and lower
screens.
For the linear spectrum, cross
power spectrum, and transfer
function, displays the real-number
portion of the data for the FFT
calculation result on the X-axis,
and the imaginary number
portion of the data on the Y-axis.
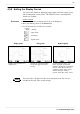
NOTE
You can set the format for displaying input signal waveforms on the screen
and recording them on the printer. The SINGLE, DUAL, and NYQUIST
formats are available.
Screen: STATUS
Procedure 1. Press the
STATUS
key to display the screen to be displayed.
2. Move the flashing cursor to the
Format
item.
3. Use the function key to make the selection.
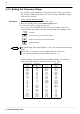
The peak value is displayed on the screen and printed out, but it is not
recorded as the peak value in data storage.