
User Manual

APPENDIX 11
────────────────────────────────────────────────────
Appendix 3 Reference
────────────────────────────────────────────────────
90%
10%
Fall time
Rise time
n
σ
={ (di - AVE)
2
/n}
i=1
Σ
n
S= |
di| h
i=1
Σ
Acurso
r
Bcurso
r
Shaded area is calculated
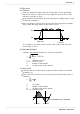
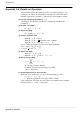
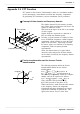
(10) Rise time
(11) Fall time
From the captured waveform data, the 0% and 100% level is determined,
and the rise time (s) is taken as the time required to go from 10% to 90%
(fall time: from 90% to 10%).
In the captured waveform data, the first rising slope (or falling slope) is used
to make the calculation.
If the A/B cursors (vertical, trace) are used, the first rising slope (or falling
slope) within the range defined by the cursors is used.
It is possible to set values of the rise time (10% to 90%) and of the fall
time to (90% to 10%).
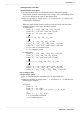
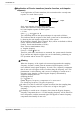
(12) Standard deviation
Calculates the standard deviation (V) of the waveform data.
σ
standard deviation
AVE effective value
n
number of data samples
di
i-th data of the source channel
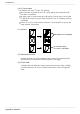
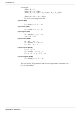
(13) Area value
Calculates the area bordered by the signal waveform and the zero position
(potential 0 V).
If the A/B cursors (vertical, trace) are used, the area between the cursors is
calculated.
S Area value
n
number of data samples
di
i-th data of the source channel
h=∆t sampling period