
User Manual


87
────────────────────────────────────────────────────
4.8 FFT Analysis Function
────────────────────────────────────────────────────
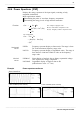
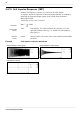
4.8.8 Cross Power Spectrum [CSP]
Function
Gab = Fa* Fb
=|Fa||Fb|{cos( θb- θa) + jsin ( θb- θa)}
Horizontal
cursor
Vertical
cursor
Displays the product of the spectra of two input signals.
The magnitude and phase information of the frequency components that are
common to both signals can be displayed.
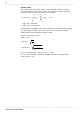
Major applications:
Obtaining frequency components common to two signals.
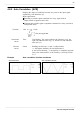
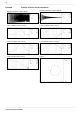
LIN-Hz Frequency spectrum display as linear units. The range is from
DC to the maximum frequency range value.
LOG Hz Frequency spectrum display as logarithmic units. The range is
from between 1/400 and 1/4000 of value to the frequency
range value.
Real Linear display of real-number part of the data as voltage
(Nyquist mode).
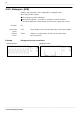
LIN-REAL Linear display of real-number part of the data as binary
exponential voltage
LIN-IMAG Linear display of imaginary-number part of the data as binary
exponential voltage
LIN-MAG Linear display of amplitude component as binary exponential
voltage
LOG-MAG Logarithmic display of the amplitude component as dB
(0dB reference value; 1V
2
rms.)
PHASE Degrees (deg) display of phase component of data
Imag Linear display of imaginary-number part of the data as binary
exponential voltage (Nyquist mode)