
User Manual


84
────────────────────────────────────────────────────
4.8 FFT Analysis Function
────────────────────────────────────────────────────
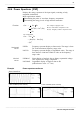
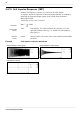
4.8.6 Histogram [HIS]
Function
Horizontal
cursor
Vertical
cursor
Stored waveform Histogram function
Displays the frequencies of the magnitudes of sampled points.
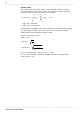
Major applications include:
Determining waveform imbalance
Determining whether a waveform is artificial or natural from the
waveform distribution (most natural waveforms are regular sine waves).
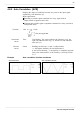
Pa
Volt Linear display of the measurement range of the input module.
Linear Number of sample points for the time axis data (total:
specified points).
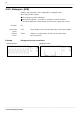
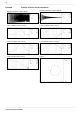
Example Histogram function waveforms
08-66, 39