
User Manual


83
────────────────────────────────────────────────────
4.8 FFT Analysis Function
────────────────────────────────────────────────────
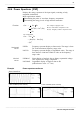
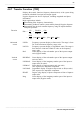
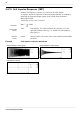
4.8.5 Auto Correlation [ACR]
Function
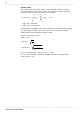
Raa (
τ
)=
-1
(Gaa)
=Gaa(ω)exp(jω
τ
)dω
Horizontal
cursor
Vertical
cursor
Stored waveform Auto correlation function
Displays the degree of similarity between two points in the input signal
separated by time difference (τ).
Major applications:
Detecting a periodic signal contained in a noisy signal with an
improvement in signal-to-noise ratio.
Checking the periodic signal components contained in a noisy waveform,
and periodic noise.
Time Time display. The center indicates the reference (τ=0), the
right side indicates time lag (+τ), and the left side indicates
time lead (-τ).
Linear Readings are between +1 and -1 (without units).
+1: the highest similarity for time differential τ
0: the lowest similarity, -1: the polarity is completely opposite.
Due to the characteristics of the function, τ=0 always results
in +1.
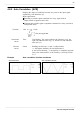
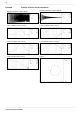
Example Auto correlation function waveforms
08-65, 38