
User Manual

80
────────────────────────────────────────────────────
4.8 FFT Analysis Function
────────────────────────────────────────────────────
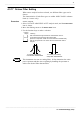
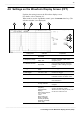
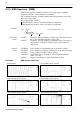
4.8.3 RMS Spectrum [RMS]
Function
DC components: Ra = Fa
Ra = Fa
=|Ra|exp(jθa)
=|Ra|(cos θa+jsin θa)
Horizontal
cursor
Vertical
cursor
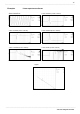
Y-axis: LIN-REAL (X-axis: LOG-Hz)
Y-axis: LIN-IMAG (X-axis: LOG-Hz) Y-axis: LIN-MAG (X-axis: LOG-Hz)
Y-axis: LOG-MAG (X-axis: LOG-Hz) Y-axis: PHASE (X-axis: LOG-Hz)
Stored waveform
Displays the frequency domain waveform of the input signal, including
magnitude (effective value) and phase information.
The LOG-MAG displays of RMS spectrum and Power spectrum express the
same processing result.
Major applications include:
Determining the peaks of waveform frequency components.
Determining the effective values of frequency components.
LIN-Hz Frequency spectrum display as linear units. The range is from
DC to the maximum frequency range value.
LOG-Hz Frequency spectrum display as logarithmic units. The range is
from between 1/400 and 1/4000 of value to the frequency
range value.
LIN-REAL Linear display of real-number part of the data as voltage
LIN-IMAG Linear display of imaginary-number part of the data as voltage
LIN-MAG Linear display of analysis data as voltage
LOG-MAG Logarithmic display of analysis data as dB (0dB reference
value: 1 V rms)
PHASE Degrees (deg) display of phase component of data
Examples RMS spectra waveform
08-23, 30, 31, 32, 33, 34