
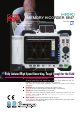
Data Sheet


10
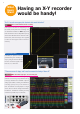
Time domain
Frequency domain
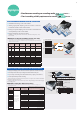
1,000 points
Convert 1,000 to 10,000 points
Before scaling
After scaling
Waveform in the MEM function
■
Recalculate by changing the number of calculation points after measurement
Even for measurement data currently based on a lower number of
calculation points, it is possible to increase the number later and
perform analysis again. For example, data measured at a setting of
1,000 points can be converted and reanalyzed with a 10,000 point
setting. This will result in a tenfold increase in frequency analysis
resolution. Of course, the opposite is also possible, going for example
from 10,000 points to 1,000 points.
* Recalculation with a different number of calculation points is not possible if frequency
averaging is set to ON.
■ Decibel-based scaling
Decibel-based scaling as requested by numerous customers
is now possible. There is no more need to make logarithmic
conversions on the side with an electronic calculator. The 8847
can accept input of overall values (power spectrum sum) in dB,
with the capability for easy scaling. Signals from noise level
meters and similar equipment can therefore be read directly.
Function available from version 2.00 or later
- Frequency area data analysis (FFT function) -
- Electrical distortion analysis/mechanical vibration analysis -
Highlights
This function comprises single-signal FFT for tasks such as frequency
component analysis, dual-signal FFT for transfer function analysis,
and octave analysis for acoustic measurements. The signal source for
analysis are selectable from 1,000 to 10,000 data points.
Compared to the predecessor model 8841, processing speed is about
ten times faster when performing the most time-intensive analysis
calculations under the same conditions.
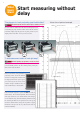
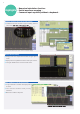
FFT analysis function
To use measurement data captured with the Memory function, the Jog & Shuttle
knobs serve to specify analysis points, and processing results can now be
displayed at the same time. Compared to earlier models such as the 8855 and
8841, operation has been significantly streamlined by eliminating the need to
go back and forth between the Memory function and the FFT function. It is also
possible to view raw data measured with the Memory function and processing
results obtained from stored waveforms side by side. This makes it possible
to check the effects of window functions while viewing spectrum waveforms,
resulting in a dramatic improvement in operation convenience during use of the
analysis functions.
FFT analysis from memory waveform data
Specify an analysis point
Convert 1,000 to 10,000 points
Before scaling
After scaling
■
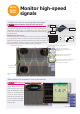
Running spectrum display
Display ever-changing time-based spectrums in 3D and use the jog
and shuttle to load previously captured waveform. Data can be saved
as text for further graphical processing on Excel or other spreadsheet
applications.