
User Manual


63
────────────────────────────────────────────────────
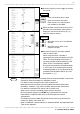
4.4 Using the X-Y Waveform Plots (MEM)
────────────────────────────────────────────────────
Screen: STATUS1, CHANNEL
1
Press the STATUS key to call up the
STATUS1 screen.
Move the flashing cursor to the format
item, as shown in the figure on the left.
Use the function keys to select the
"X-Y single or "X-Y quad" format.
Use the function keys to set the
interpolation (dot-line). See Section 4.3.6.
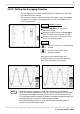
Method
Method
(1) Setting the Format
:Move the cursor up in the selectio
n
window.
:Move the cursor down in the
selection window.
Selection
Selection
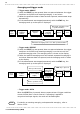
Press the CHAN key to call up the
CHANNEL1 screen.
Move the flashing cursor to desired
channel, and use the function keys to set
the waveform color (including displays
waveform ON/OFF).
Specify the X-axis channel.
Move the cursor to the channel to be used
as X axis. And use the function keys or
the JOG control to select X axis.
Specify the Y-axis channel.
This is done in the same way as in step
.
For graph 2 to graph 4, the settings are
made in an identical.
:Waveform is performed.
:Waveform is not performed.
(2) Setting the Channel