
User Manual


188
────────────────────────────────────────────────────
8.7 Analysis Function
────────────────────────────────────────────────────
8
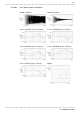
.7.11 Coherence [COH]
Functio
n
Gab*
・
Gab
C
OH =
Gaa・Gbb
Horizonta
l
curso
r
Vertica
l
curso
r
Vertical axis Display
LIN-REAL (real-number part) −
LIN-IMAG (imaginary-number part) −
LIN-MAG (amplitude) COH
LOG-MAG (logarithmic amplitude) −
PHASE (phase) −
NOTE
Displays the output signal component that is coherent (interference possible) to
the input signal, yielding a value from 0 to 1.
Major applications include:
・Evaluation of transfer functions.
・Determining the contribution of individual input lines to the output of multi-
input systems.
LIN-Hz Frequency spectrum display as linear units. The range is from
DC to the maximum frequency range value.
LOG-Hz Frequency spectrum display as logarithmic units. The range is
from 1/400 to 1/4000 the maximum frequency range value to the
maximum frequency range value.
Linear The relationship between the two input signals. The degree of
relationship is indicated from 0 to 1 on a linear scale (no units).
For a single measurement, the coherence function returns 1 for all
frequencies. When measuring, be sure to use frequency averaging.