
User Manual


184
────────────────────────────────────────────────────
8.7 Analysis Function
────────────────────────────────────────────────────
8
.7.8 Cross Power Spectrum [CSP]
Functio
n
G
ab = Fa*・Fb
= |Fa|・|Fb|{cos(∠θb ー ∠θa) + jsin (∠θb ー ∠θa
)}
Horizonta
l
curso
r
Vertica
l
curso
r
Vertical axis Display
LIN-REAL (real-number part) |Gab|・cos ∠θb−∠θa
LIN-IMAG (imaginary-number part) |Gab|・sin ∠θb−∠θa
LIN-MAG (amplitude) |Gab|
LOG-MAG (logarithmic amplitude) 10 log |Gab|
PHASE (phase) ∠θb−∠θa
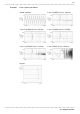
Displays the product of the spectra of two input signals.
The magnitude and phase information of the frequency components that are
common to both signals can be displayed.
Major applications:
Obtaining frequency components common to two signals.
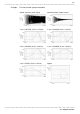
LIN-Hz Frequency spectrum display as linear units. The range is from
DC to the maximum frequency range value.
LOG Hz Frequency spectrum display as logarithmic units. The range is
from 1/400 to 1/4000 the maximum frequency range value to the
maximum frequency range value.
Real Linear display of real-number part of the data as voltage
(Nyquist mode).
LIN-REAL Linear display of real-number part of the data as binary
exponential voltage
LIN-IMAG Linear display of imaginary-number part of the data as binary
exponential voltage
LIN-MAG Linear display of amplitude component as binary exponential
voltage
LOG-MAG Logarithmic display of the amplitude component as dB
(0dB reference value; 1V
2
rms.)
PHASE Degrees (deg) display of phase component of data
Imag Linear display of imaginary-number part of the data as binary
exponential voltage (Nyquist mode)