
User Manual
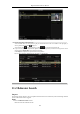

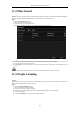

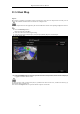


Table Of Contents
- Product Key Features
- Chapter 1 Introduction
- Chapter 2 Getting Started
- Chapter 3 Live View
- Chapter 4 PTZ Controls
- Chapter 5 Recording Settings
- 5.1 Configuring Encoding Parameters
- 5.2 Configuring Recording Schedule
- 5.3 Configuring Motion Detection Recording
- 5.4 Configuring Alarm Triggered Recording
- 5.5 Configuring Event Recording
- 5.6 Configuring Manual Recording
- 5.7 Configuring Holiday Recording
- 5.8 Configuring Redundant Recording
- 5.9 Configuring HDD Group
- 5.10 Files Protection
- 5.11 Configuring 1080P Lite
- Chapter 6 Playback
- 6.1 Playing Back Record Files
- 6.2 Auxiliary Functions of Playback
- Chapter 7 Backup
- Chapter 8 Alarm Settings
- Chapter 9 POS Configuration
- Chapter 10 VCA Alarm
- 10.1 Face Detection
- 10.2 Vehicle Detection
- 10.3 Line Crossing Detection
- 10.4 Intrusion Detection
- 10.5 Region Entrance Detection
- 10.6 Region Exiting Detection
- 10.7 Loitering Detection
- 10.8 People Gathering Detection
- 10.9 Fast Moving Detection
- 10.10 Parking Detection
- 10.11 Unattended Baggage Detection
- 10.12 Object Removal Detection
- 10.13 Audio Exception Detection
- 10.14 Defocus Detection
- 10.15 PIR Alarm
- Chapter 11 VCA Search
- Chapter 12 Network Settings
- Chapter 13 HDD Management
- Chapter 14 Camera Settings
- Chapter 15 DVR Management and Maintenance
- Chapter 16 Others
- Chapter 17 Appendix

Digital Video Recorder User Manual
144
11.5 Heat Map
Purpose:
Heat map is a graphical representation of data represented by colors. The heat map function is usually used to
analyze the visit times and dwell time of customers in a configured area.
The heat map function must be supported by the connected IP camera and the corresponding configuration must be
set.
Steps:
1. Enter the Heat Map interface.
Menu>VCA Search> Heat Map
2. Select the camera for the heat map processing.
3. Select the report type to Daily Report, Weekly Report, Monthly Report or Annual Report.
4. Set the statistics time.
Figure 11. 8 Heat Map Interface
5. Click the Counting button to export the report data and start heat map statistics, and the results are displayed
in graphics marked in different colors.
As shown in Figure 10.8, red color block (255, 0, 0) indicates the most welcome area, and blue color block (0, 0,
255) indicates the less-popular area.
You can click the Export button to export the statistics report in excel format.