
User Manual

Network Video Recorder User Manual
UM NVR v4.xx 111717NA 141
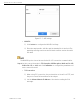
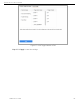
Step 2 Select a camera.
Step 3 Set the report type as Daily Report, Weekly Report, Monthly Report, or Annual Report.
Step 4 Set the Data to analyze.
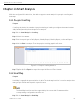
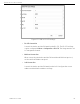
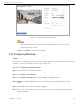
Figure 14-2 Heat Map Interface
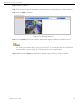
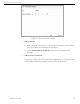
Step 5 Click Counting. The results will be displayed in graphics marked in different colors.
As shown in the figure above, red color block (255, 0, 0) indicates the most trafficked
area, and blue color block (0, 0, 255) indicates the less-popular area.
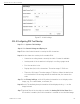
Step 6 (Optional) Click Export to export the statistics report in Microsoft Excel format.