
User Manual
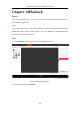
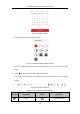
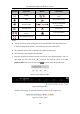
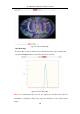
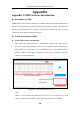
Table Of Contents
- Chapter 1 System Requirement
- Chapter 2 Network Connection
- Chapter 3 Access to the Network Camera
- Chapter 4 Live View
- Chapter 5 Network Camera Configuration
- Chapter 6 Network Settings
- Chapter 7 Video/Audio Settings
- Chapter 8 Configuring Image Parameters
- Chapter 9 Configuring Event Settings
- 9.1 Configuring Motion Detection
- 9.2 Configuring Video Tampering Alarm
- 9.3 Configuring Alarm Input
- 9.4 Configuring Alarm Output
- 9.5 Handling Exception
- 9.6 Configuring Audio Exception Detection
- 9.7 Configuring Intrusion Detection
- 9.8 Configuring Line Crossing Detection
- 9.9 Configuring Region Entrance Detection
- 9.10 Configuring Region Exiting Detection
- 9.11 Configuring Unattended Baggage Detection
- 9.12 Configuring Object Removal Detection
- Chapter 10 Storage Settings
- Chapter 11 People Counting
- Chapter 12 Heat Map
- Chapter 13 Intersection Analysis
- Chapter 14 Playback
- Chapter 15 Picture
- Chapter 16 Application
- Appendix

User Manual of Network Fisheye Camera
126
Chapter 16 Application
Click Application to enter the heat map statistics interface. You can search, view, and
download the counting data stored in the local storage or network storage.
16.1 People Counting Statistics
After you enable the people counting function, you can view and download the people
counting data from application tab. To get more intuitional results, you can display the
data in different charts.
Steps:
1. Select the report type. Daily report, weekly report, monthly report, and annual
report are selectable.
Note: Daily report calculates the data on the date you selected; weekly report
calculates for the week your selected date belongs to; monthly report calculates
for the month your selected date belongs to; and the annual report calculates for
the year your selected date belongs to.
2. Select the statistics type. People Entered, and People Exited are selectable.
3. Select the start time, and click Counting.
The counting result displays in the statistic result area. Click List, Bar Chart, or
Line Chart to display the result in different way.
Note: If you select table to display the statistics, there is an Export button to
export the data in an excel file.
Figure 16-1 People Counting