
User Manual
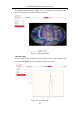
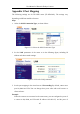

Table Of Contents
- Chapter 1 System Requirement
- Chapter 2 Network Connection
- Chapter 3 Access to the Network Camera
- Chapter 4 Live View
- Chapter 5 Network Camera Configuration
- 5.1 Configuring Local Parameters
- 5.2 Configuring System Settings
- 5.2.1 Viewing Basic Information
- 5.2.2 Time and DST Settings
- 5.2.3 RS-232 Settings
- 5.2.4 RS-485 Settings
- 5.2.5 Upgrade and Maintenance
- 5.2.6 Log Searching
- 5.2.7 System Service Settings
- 5.2.8 Authentication
- 5.2.9 IP Address Filter
- 5.2.10 Security Service
- 5.2.11 User Management
- 5.2.12 Open Source Software License
- 5.3 Configuring Network Settings
- 5.3.1 Configuring TCP/IP Settings
- 5.3.2 Configuring Port Settings
- 5.3.3 Configuring PPPoE Settings
- 5.3.4 Configuring DDNS Settings
- 5.3.5 Configuring NAT (Network Address Translation) Settings
- 5.3.6 Configuring SNMP Settings
- 5.3.7 Configuring FTP Settings
- 5.3.8 Email Settings
- 5.3.9 Configuring HTTPS Settings
- 5.3.10 Configuring QoS Settings
- 5.3.11 Configuring 802.1X Settings
- 5.4 Configuring Video and Audio Settings
- 5.5 Configuring Image Parameters
- 5.6 Configuring Event Settings
- 5.7 Configuring Heat Map
- Chapter 6 Storage Settings
- Chapter 7 Playback
- Chapter 8 Picture
- Chapter 9 Application
- Appendix

User Manual of Network Fisheye Camera
113
The duration displayed next to “High” or “Low” stands for the cumulative time
that the area keeps certain level of visit frequency.
Figure 9-1 Space Heat Map
Time Heat Map:
The heat value of the pre-defined area is calculated by hour, day, or month. You
can click the Export button to export the data in an excel file.
Figure 9-2 Time Heat Map