
User Manual
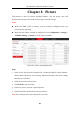
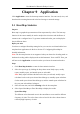
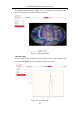
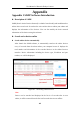
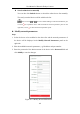
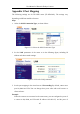

Table Of Contents
- Chapter 1 System Requirement
- Chapter 2 Network Connection
- Chapter 3 Access to the Network Camera
- Chapter 4 Live View
- Chapter 5 Network Camera Configuration
- 5.1 Configuring Local Parameters
- 5.2 Configuring System Settings
- 5.2.1 Viewing Basic Information
- 5.2.2 Time and DST Settings
- 5.2.3 RS-232 Settings
- 5.2.4 RS-485 Settings
- 5.2.5 Upgrade and Maintenance
- 5.2.6 Log Searching
- 5.2.7 System Service Settings
- 5.2.8 Authentication
- 5.2.9 IP Address Filter
- 5.2.10 Security Service
- 5.2.11 User Management
- 5.2.12 Open Source Software License
- 5.3 Configuring Network Settings
- 5.3.1 Configuring TCP/IP Settings
- 5.3.2 Configuring Port Settings
- 5.3.3 Configuring PPPoE Settings
- 5.3.4 Configuring DDNS Settings
- 5.3.5 Configuring NAT (Network Address Translation) Settings
- 5.3.6 Configuring SNMP Settings
- 5.3.7 Configuring FTP Settings
- 5.3.8 Email Settings
- 5.3.9 Configuring HTTPS Settings
- 5.3.10 Configuring QoS Settings
- 5.3.11 Configuring 802.1X Settings
- 5.4 Configuring Video and Audio Settings
- 5.5 Configuring Image Parameters
- 5.6 Configuring Event Settings
- 5.7 Configuring Heat Map
- Chapter 6 Storage Settings
- Chapter 7 Playback
- Chapter 8 Picture
- Chapter 9 Application
- Appendix

User Manual of Network Fisheye Camera
112
Chapter 9 Application
Click Application to enter the heat map statistics interface. You can search, view, and
download the counting data stored in the local storage or network storage.
9.1 Heat Map Statistics
Purpose:
Heat map is a graphical representation of data represented by colors. The heat map
function of the camera usually be used to analyze the visit times and dwell time of
customers in a configured area. To get more intuitional results, you can display the
data in different charts.
Before you start:
You have to configure Heat Map setting before you can view and download the heat
map data from application tab. Refer to Section 5.7 Configuring Heat Map for
detailed information.
Note: The heat map function is not supported when you choose the decoding mode as
hardware decoding and the display mode as 180 Panoramic View or 4PTZ. Thus, you
will not see the Application on menu bar when you choose the mentioned modes.
Steps:
1. Click Heat Map Statistics to enter the data statistics interface.
2. Select the report type by clicking the drop-down menu. Daily report, weekly
report, monthly report, and annual report are selectable.
Note: Daily report calculates the data on the date you selected; weekly report
calculates for the week your selected date belongs to; monthly report calculates
for the month your selected date belongs to; and the annual report calculates for
the year your selected date belongs to.
3. Select the start time, and click Counting to list the heat map data.
4. Select Space Heat Map or Time Heat Map to display the results.
Space Heat Map:
The different colors that mark areas in the surveillance scene stand for different
frequency of visits. The color closer to the red end of the color scheme shows a
relatively high frequency of visits.