
Manual

User Manual of Network Camera
119
6.7.3 Heat Map
Heat map is a graphical representation of data represented by colors. The heat map
function of the camera usually be used to analyze the visit times and dwell time of
customers in a configured area.
Heat Map Configuration
Steps:
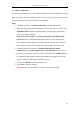
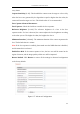
1. Enter the Heat Map configuration interface: Configuration > Advanced
Configuration > Heat Map
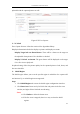
Figure 6-78 Heat Map Configuration
2. Select Heat Map Configuration tab to set the detailed parameters.
3. Check the checkbox of Enable Heat Map to enable the function.
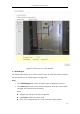
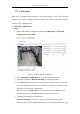
4. Click Draw Area to define the area for heat value statistics. Draw area by left
click four end-points in the live view window, and right click to finish the area
drawing. Up to 8 areas are configurable.
Note: You can click Select All to select the whole live view window as the
configured area. Or click Delete to delete the current drawn area.
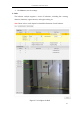
5. Configure the parameters for drawn area.
Detection Sensitivity [0~100]: It refers to the sensitivity of the camera
identify a target. The over-high sensitivity may cause the misinformation. It is