
User Manual
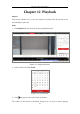
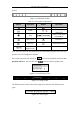
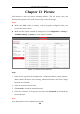
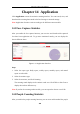
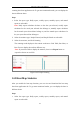
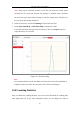
Table Of Contents
- Chapter 1 System Requirement
- Chapter 2 Network Connection
- Chapter 3 Access to the Network Camera
- Chapter 4 Wi-Fi Settings
- Chapter 5 Live View
- Chapter 6 Network Camera Configuration
- Chapter 7 Network Settings
- Chapter 8 Video/Audio Settings
- Chapter 9 Image Settings
- Chapter 10 Event Settings
- 10.1 Basic Events
- 10.2 Smart Events
- 10.2.1 Configuring Audio Exception Detection
- 10.2.2 Configuring Defocus Detection
- 10.2.3 Configuring Scene Change Detection
- 10.2.4 Configuring Face Detection
- 10.2.5 Configuring Intrusion Detection
- 10.2.6 Configuring Line Crossing Detection
- 10.2.7 Configuring Region Entrance Detection
- 10.2.8 Configuring Region Exiting Detection
- 10.2.9 Configuring Unattended Baggage Detection
- 10.2.10 Configuring Object Removal Detection
- 10.3 VCA Configuration
- Chapter 11 Storage Settings
- Chapter 12 Playback
- Chapter 13 Picture
- Chapter 14 Application
- Appendix

Network Camera User Manual
157
Note: Daily report calculates the data on the date you selected; weekly report
calculates for the week your selected date belongs to; monthly report calculates
for the month your selected date belongs to; and the annual report calculates for
the year your selected date belongs to.
2. Select the start time, and click Counting to list the heat map data.
3. Select Space Heat Map or Time Heat Map to display the results.
If you select the time heat map to list the statistics, there is an Export button to
export the data in an excel file.
Figure 14-3 Time Heat Map
Note:
It is recommended that you do not adjust the electronic lens after the installation is
completed, which may cause the inaccuracy of the data in some degree.
14.4 Counting Statistics
After you enable the counting function, you can view and download the counting data
from application tab. To get more intuitional results, you can display the data in