
User Guide


11
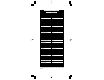
Temperature has an effect on pH. The calibration buffer solutions are
effected by temperature changes to a lesser degree than normal
solutions.
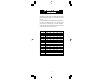
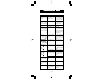
For manual temperature calibration please refer to the following chart.
For instance, if the buffer temperature is 25°C, the display should
show pH 4.01, 7.01 or 10.01 at pH 4, 7 or 10 buffers, respectively.
At 20°C, the display should show pH 4.00, 7.03 or 10.06. The meter
reading at 50°C will then be 4.06, 6.98 or 9.82.
pp
pp
p
H VALUES AT VARIOUSH VALUES AT VARIOUS
H VALUES AT VARIOUSH VALUES AT VARIOUS
H VALUES AT VARIOUS
TEMPERATURESTEMPERATURES
TEMPERATURESTEMPERATURES
TEMPERATURES
TEMP pH VALUES
°C °F 4.01 6.86 7.01 9.18 10.01
0
5
10
15
20
25
30
35
40
45
50
55
60
65
70
32
41
50
59
68
77
86
95
104
113
122
131
140
149
158
4.01
4.00
4.00
4.00
4.00
4.01
4.02
4.03
4.04
4.05
4.06
4.07
4.09
4.11
4.12
6.98
6.95
6.92
6.90
6.88
6.86
6.85
6.84
6.84
6.83
6.83
6.84
6.84
6.85
6.85
7.13
7.10
7.07
7.04
7.03
7.01
7.00
6.99
6.98
6.98
6.98
6.98
6.98
6.99
6.99
9.46
9.39
9.33
9.27
9.22
9.18
9.14
9.10
9.07
9.04
9.01
8.99
8.97
8.95
8.93
10.32
10.24
10.18
10.12
10.06
10.01
9.96
9.92
9.88
9.85
9.82
9.79
9.77
9.76
9.75